8-for-8 Midterm Streak: Amphenol (APH) Has Averaged 23.44% Gains From This July Window
Amphenol is heading toward a historically powerful midterm-election-year seasonal window just as the stock trades well below its 52-week high after a sharp pullback.

What is the seasonal pattern for Amphenol (APH)?
Amphenol has risen in 8 of 8 midterm-election-year windows starting around Jul 1 and lasting 278 trading days, with an average gain of 23.44% in winning years.
- 8 for 8 in this window, averaging 23.44% gains in winning years across the last eight midterm election cycles.
- Seasonal window begins Jul 1, 2026 and runs for 278 trading days, spanning the back half of the midterm year into the pre-election year.
- Percent Profitable is 100%, with 8 winners and 0 losers in the historical sample.
- Median outcome is a 21.16% gain, with cumulative return across all eight windows totaling 423%.
- TradeWave Ratio (TWR) of 1.95 signals that price has typically traveled meaningfully in the long direction within the window, while the Sharpe ratio of 1.79 reflects strong risk-adjusted results.
- Intraperiod swings have varied, with some years seeing double-digit drawdowns before finishing higher, so the ride has not always been smooth.
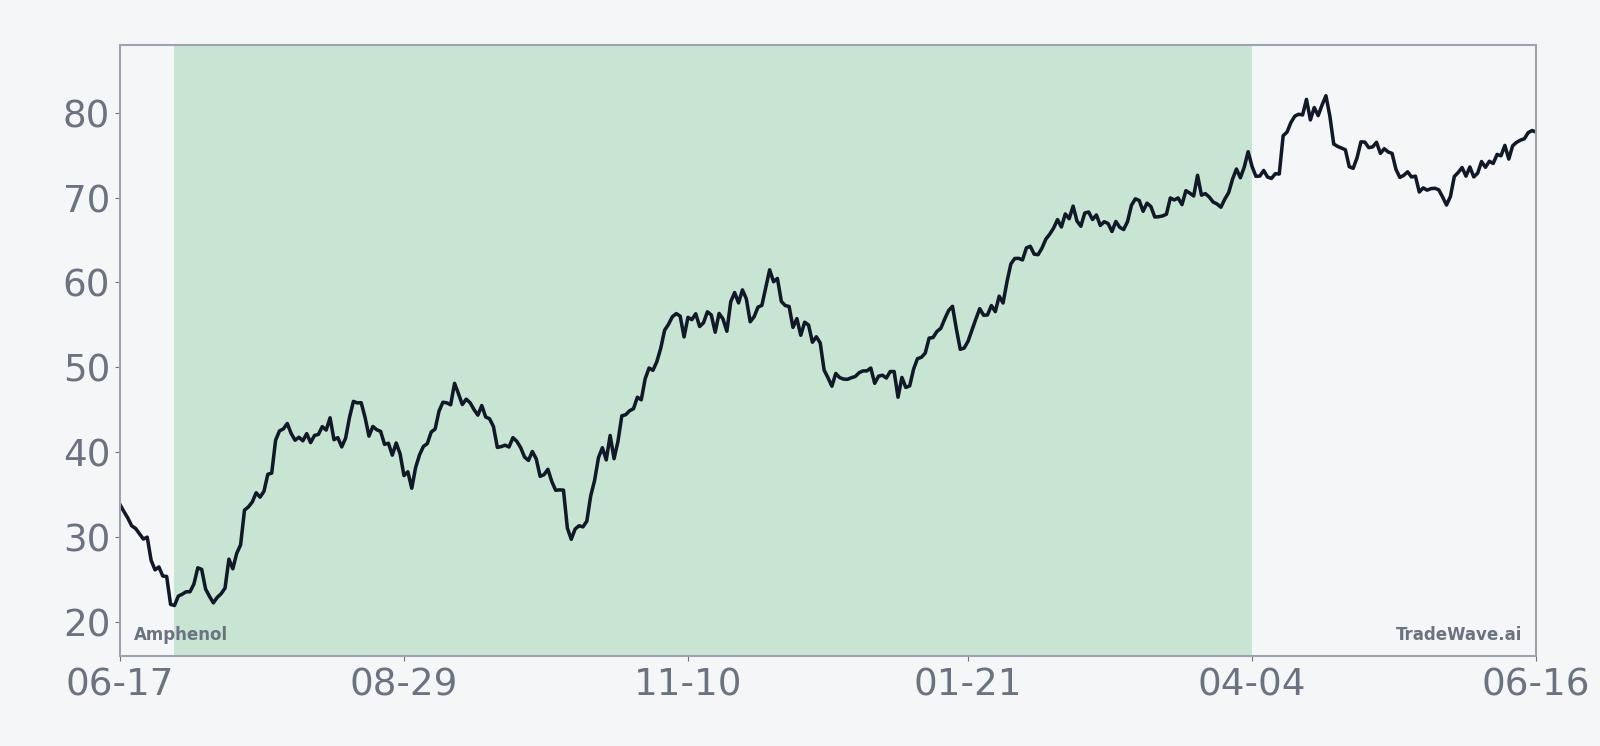
According to historical data from TradeWave.ai, this upcoming stretch for Amphenol behaves very differently from an average year on the calendar. The next section walks through how that midterm-election-year pattern has played out in prior cycles.
How has Amphenol (APH) traded in past midterm-year July-to-spring windows?
Across the last eight midterm election years, Amphenol has never posted a losing result in the 278-trading-day window that starts around Jul 1, with average gains of 23.44% and a 423% cumulative return. Today the stock closed at 138.72, down 5.5% on the session and sitting about 16.6% below its 52-week high of 166.38, after a strong run that has left it well above its 52-week low of 89.78.
Grouping the data by the presidential election cycle matters here because this window always lands in the back half of a midterm election year and then runs deep into the year before the presidential election, a phase that has often coincided with clearer policy visibility and stronger risk appetite. In this specific Amphenol trading window, the historical pattern phase is labeled “pe2-8,” which captures the last eight midterm-election-year instances that match today’s calendar setup.
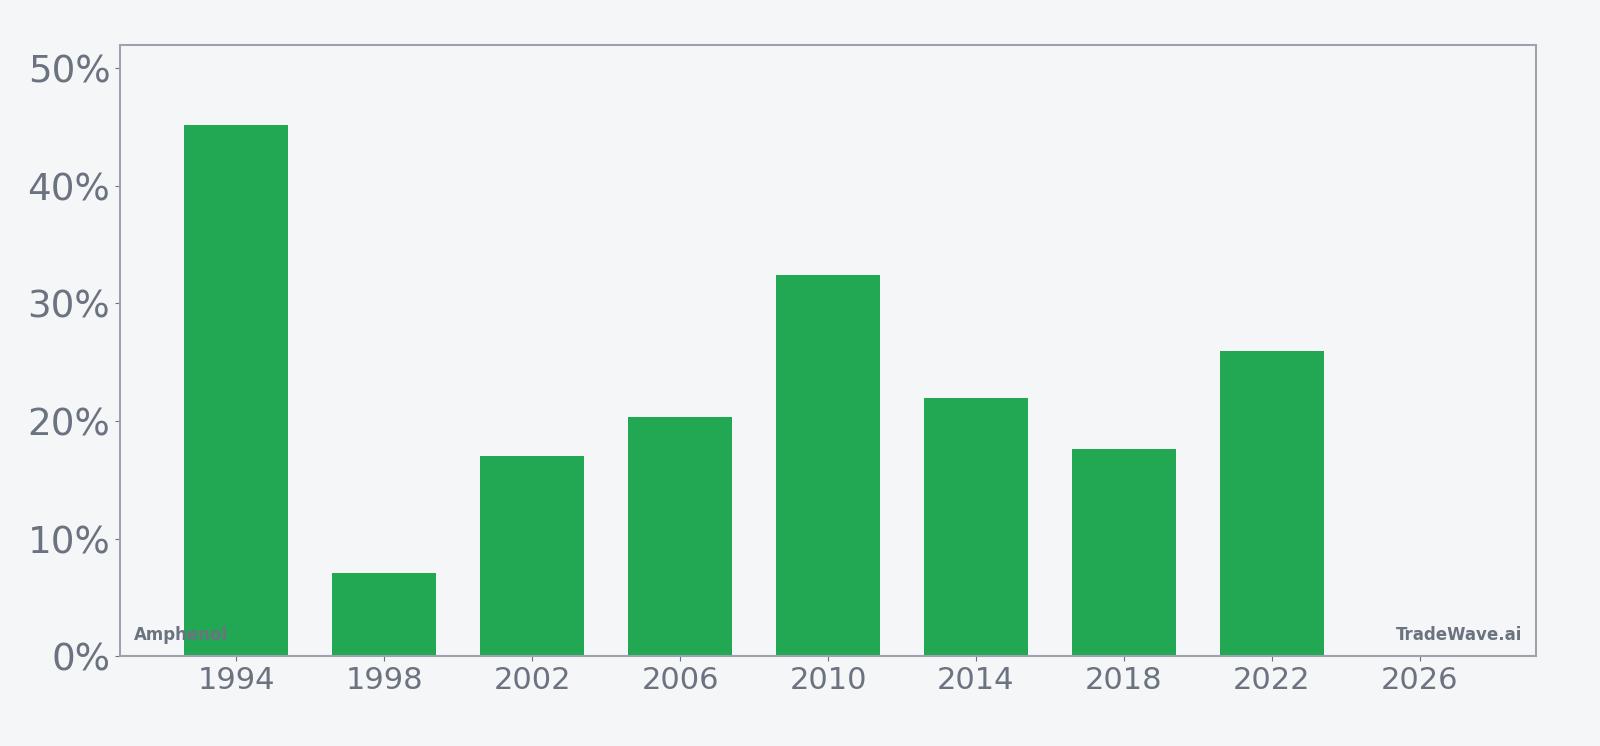
Historically, the trade direction for this pattern is long, and the results have been strikingly consistent. Percent Profitable is 100%, with 8 winners and 0 losers, and the median gain of 21.16% sits close to the average, which suggests the outcomes have clustered rather than being dominated by a single outlier year. The strongest year in the sample was 1994, when the stock gained 45.19% in the window, while the softest was 1998, which still finished up 7.05%.
The average profit of 23.44% refers to the mean net return across all eight completed windows, each measured from entry near Jul 1 to exit 278 trading days later. Because there were no losing years in this sample, the “Avg Loss” metric is 0% and the all-years average lines up with the winners-only average. Add it up and the cumulative return across these eight midterm-election-year windows is 423%, which is unusually strong for a single recurring slice of the calendar.
The historical seasonal average trend for this Amphenol trading window shows a generally upward path, with gains tending to build over the life of the window rather than arriving in a single short burst. In several years, including 2010 and 2022, the stock logged strong maximum favorable moves of 49.62% and 30.33% respectively, suggesting that when the pattern has worked, it has often delivered sizable rallies at some point during the stretch.
Year-by-year bars that combine net results with peak run-ups and worst drawdowns show how much the stock has swung inside the window before finishing higher.
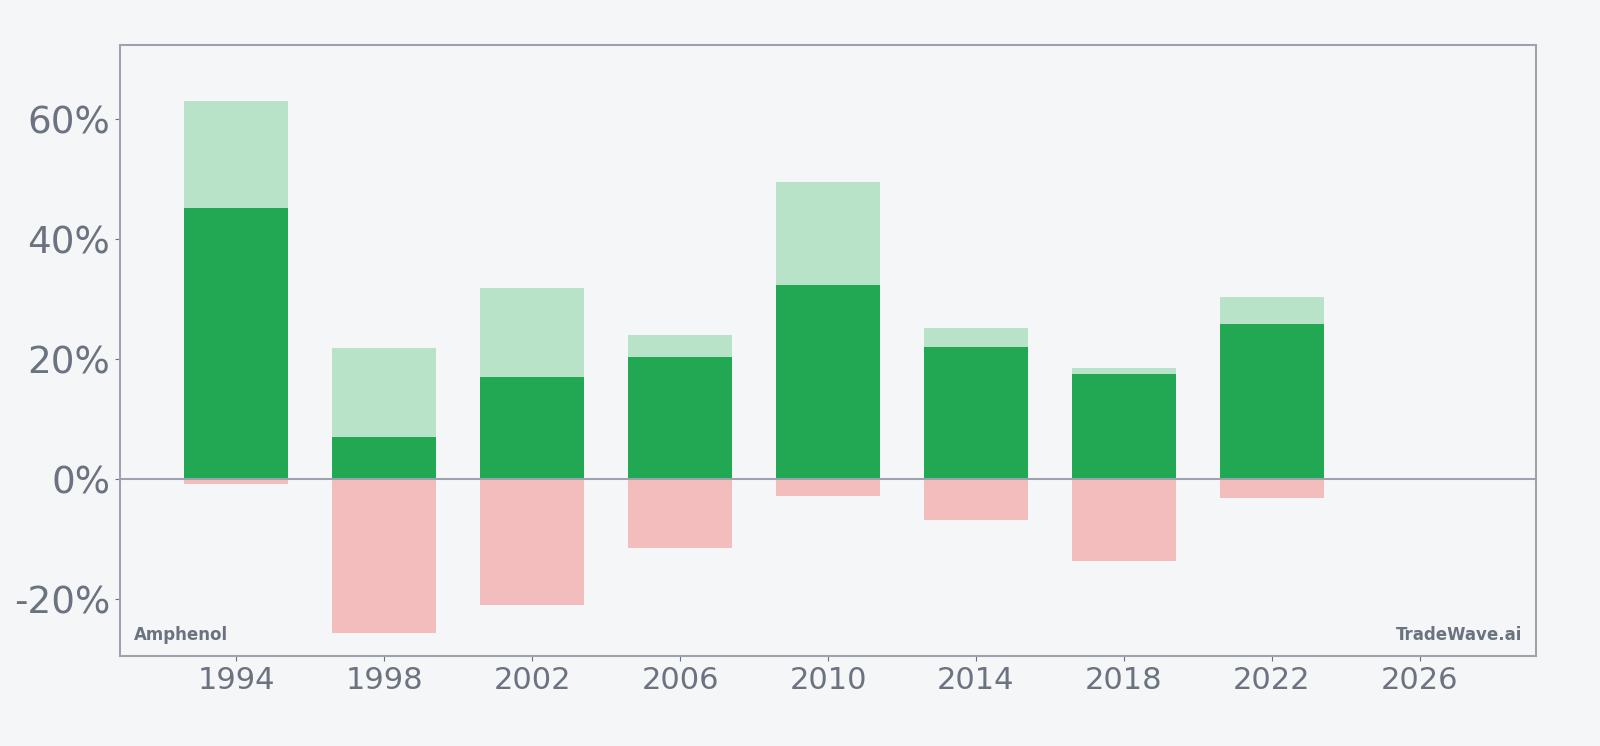
Looking at the maximum favorable excursion and maximum adverse excursion together, this has been a window with real swings. In 1998, for example, Amphenol ultimately gained 7.05%, but the stock first dropped as much as 25.65% from the entry level before recovering, while in 2010 the stock rallied as much as 49.62% with only a 2.76% worst drawdown. MFE and MAE, defined as the best and worst intraperiod excursions from the entry price, show that while the long bias has been strong, investors in this window have sometimes had to sit through double-digit downside before the pattern paid off.
History does not guarantee future results; adverse excursions can be large even in winning windows, and a 100% hit rate in the past does not mean the next iteration will follow the same script.
Why does Amphenol (APH) follow this seasonal pattern?
One likely driver is the way Amphenol’s earnings and capital spending cycles line up with the broader presidential election calendar, with midterm-year back halves often seeing clearer visibility on infrastructure, defense and broadband budgets. Analysts have also pointed to institutional portfolio repositioning into the year before the presidential election, when risk appetite has historically improved and benefitted high-quality industrial and communications suppliers. This pattern may reflect that combination of policy clarity and sector rotation into names tied to data center buildouts and defense connectivity rather than any single company-specific catalyst.
What is driving Amphenol (APH) today?
Amphenol shares closed at 138.72 on Jun 8, down 5.5% on the day, though the stock is still up 1.6% over the past month and trades well above its 52-week low of 89.78 while sitting about 16.6% below its 52-week high of 166.38. Average 20-day volume sits around 12.18 million shares, so today’s roughly 5.0 million shares traded represents a relatively normal session rather than a capitulation or blowout move.
In October 2025, Bank of America upgraded Amphenol to Buy and lifted its price target to 150, citing expectations for sustained high AI-related revenue growth and increased content per rack in future Nvidia data center systems, alongside merger-and-acquisition tailwinds.[1] That call came after a string of deal announcements in 2025, including plans reported in August 2025 to acquire CommScope’s broadband connectivity and cable unit for about 10.5 billion dollars including debt, and a separate agreement later that month to buy Trexon, a defense-focused interconnect and cable assemblies provider, for about 1 billion dollars in cash.[2][3] Together, those moves underscored Amphenol’s push deeper into broadband, data center and defense connectivity, themes that remain central to the stock’s long-term narrative.
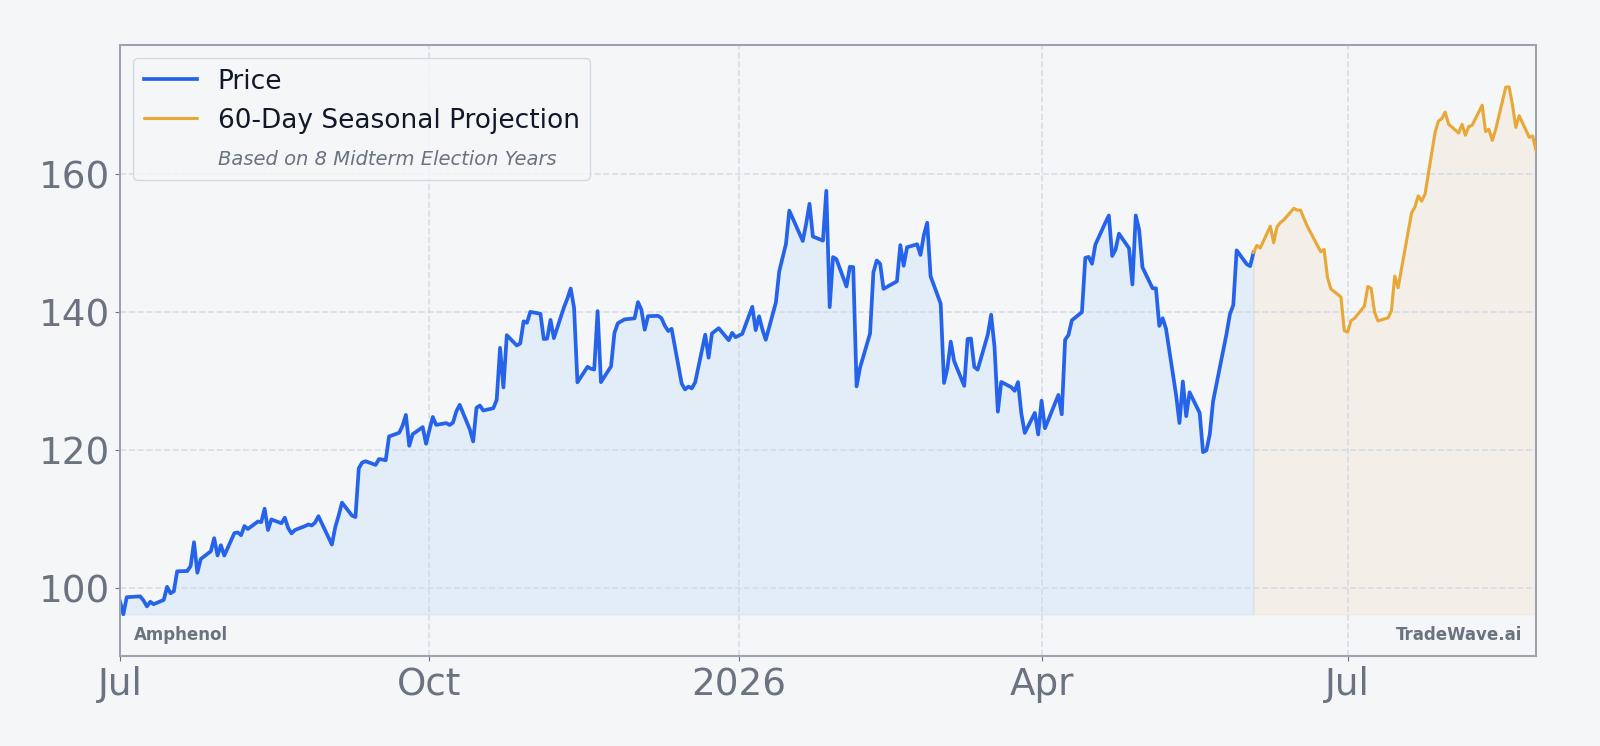
The chart below situates the latest pullback against the past year of trading and a short-term seasonal projection.
Macro-wise, Amphenol sits at the intersection of several powerful themes, including AI-driven data center demand where analysts have talked about the potential for triple-digit AI revenue growth into 2026 and higher component content per rack as new architectures roll out.[1] The company’s footprint across broadband communications, data center connectivity and defense interconnects, highlighted by the CommScope CCS and Trexon deals, means its fundamentals are tied not just to the tech cycle but also to communications infrastructure and defense spending trends.[2][3] That mix makes the upcoming midterm-year seasonal window particularly interesting, because it overlaps a period when policy clarity on infrastructure and defense budgets often improves while corporate IT and cloud spending plans for the pre-election year start to firm up.
Sources
- [1] CNBC, "Bank of America just upgraded one of the hottest derivative AI plays in the market today" (Oct 15, 2025).
- [2] Seeking Alpha, "Amphenol set to acquire CommScope unit in $10.5B deal - report" (Aug 4, 2025).
- [3] The Wall Street Journal, "Amphenol to Buy Trexon From Audax Private Equity for $1 Billion" (Aug 18, 2025).
About this seasonal analysis
Seasonal pattern data is sourced from TradeWave.ai, which analyzes historical price behavior across annual calendar windows going back up to 30 years. Read the full data methodology or the book The 100-Year Pattern by Afshin Moshrefi (2026 edition). Past performance of seasonal patterns does not guarantee future results. This article is for informational purposes only and does not constitute investment advice.