IBM Poised for Another Midterm-Summer Gain Streak Since 1994
IBM is heading into a 70-day midterm-year summer stretch that has never produced a loss in this dataset, even as the stock trades well below last year’s highs after a post-earnings pullback.

What is the seasonal pattern for IBM (IBM)?
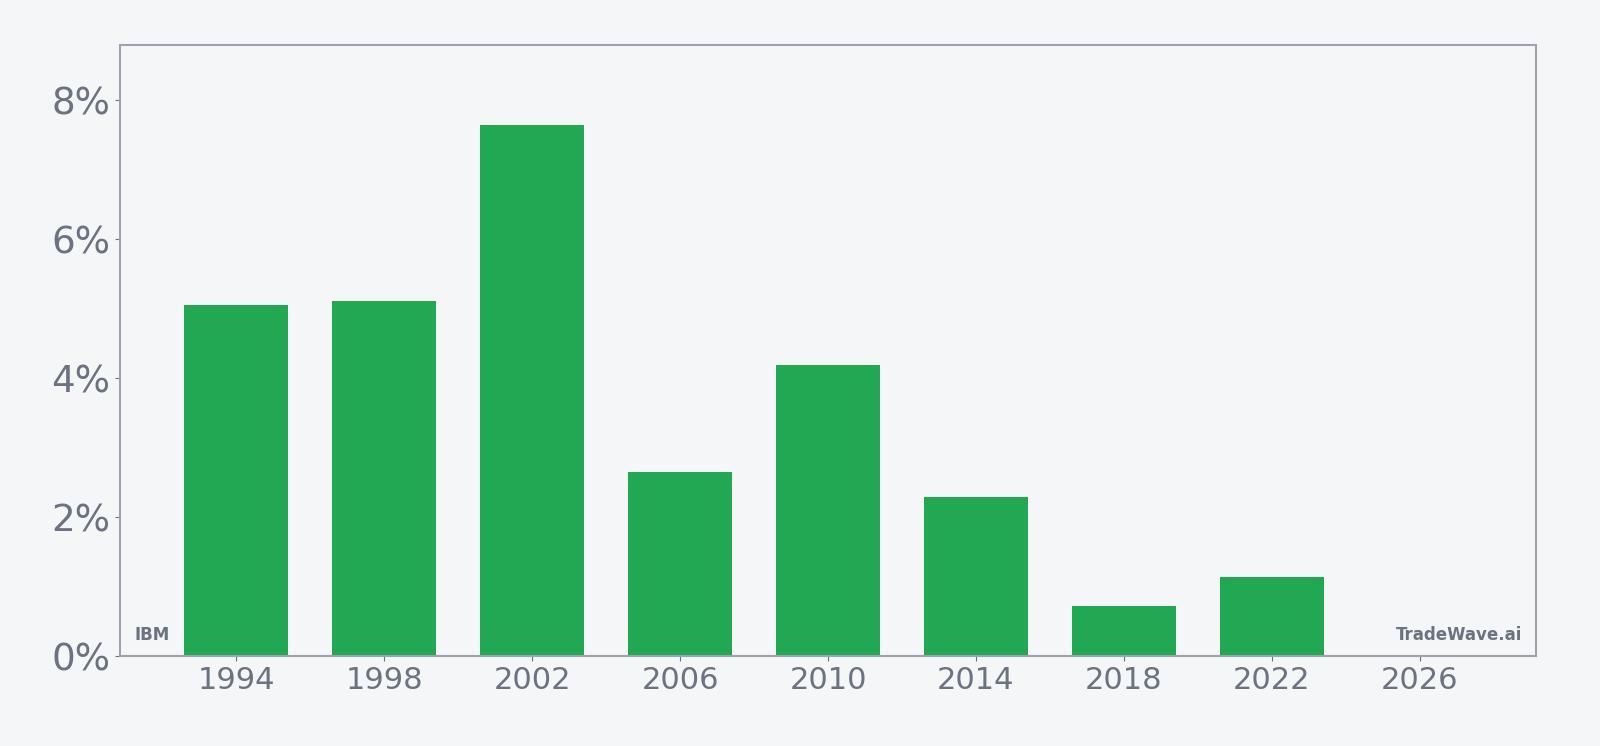
IBM has risen in 8 of 8 midterm-year summer windows starting around June 9, with an average gain of 3.6% in winning years.
- 8 for 8 in this window, with IBM averaging 3.6% gains across all winning years.
- The pattern covers a 70-day stretch starting Jun 9 in the last 8 midterm election years.
- Percent Profitable is 100%, with 8 winners and 0 losers in the historical sample.
- Trade Direction is long, supported by a TradeWave Ratio of 1.41 and a Sharpe ratio of 1.22.
- Individual years have seen maximum favorable moves as high as 15.83% and adverse swings down to about -14.45% inside the window.
- Cumulative return across all eight windows totals 32%, pointing to a persistent bullish IBM seasonal trend in midterm summers.
According to historical data from TradeWave.ai, this upcoming midterm-year summer stretch has behaved very differently from an average calendar window for IBM. The next section looks at how that election-cycle pattern has played out and what it means for the 2026 setup.
How has IBM (IBM) traded in past midterm-year summer windows?
IBM has risen in all eight midterm-year summer windows starting around Jun 9, averaging a 3.6% gain over 70 trading days and delivering a 32% cumulative return across the sample. Today the stock closed at $251.45, leaving it about 20.6% below its 52-week high of $316.55 and roughly 18.4% above its 52-week low of $212.34, after slipping 0.9% in the latest session.
The election-cycle framing matters here because this pattern only looks at the last eight midterm election years, not every calendar year. Midterm years often bring policy uncertainty, rate debates and spending fights that can weigh on broad tech indices, yet IBM’s historical seasonality in this specific June-to-late-summer window has leaned consistently positive.
A second view layers in the best and worst intraperiod swings alongside those net results.
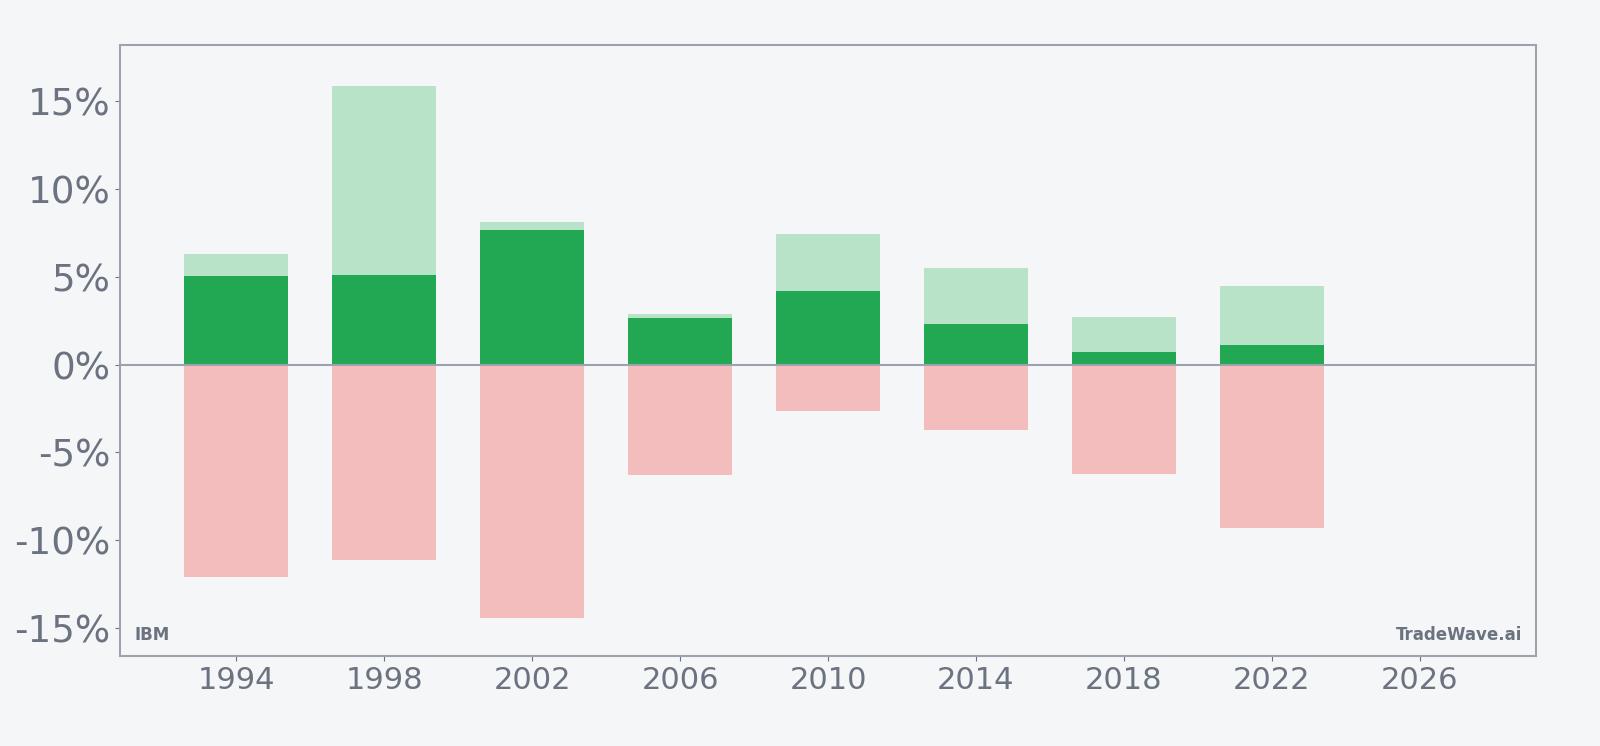
Across individual years, the strongest net gain came in 2002, when IBM added 7.65% over the window, while the softest outcome was 0.72% in 2018. Maximum favorable moves have ranged from 2.7% to 15.83%, showing that in some cycles the stock has pushed well beyond the final close before giving back part of the move. On the downside, maximum adverse excursions have stretched as far as about -14.45% in 2002 and roughly -12% in 1994, underscoring that even winning windows have contained sharp drawdowns along the way.
The historical seasonal trend chart suggests that gains have tended to build gradually rather than in a single burst, with a modest upward slope across most of the 70 days. The cumulative pattern is not a straight line, but the clustering of positive outcomes across eight separate midterm election years is unusual for a single stock window. Add it up: 32% cumulative gains across those eight midterm-summer stretches, with no losing years in this sample.
History does not guarantee future results; adverse excursions (MAE) can be large even in winning windows.
Why does IBM (IBM) follow this seasonal pattern?
One likely driver is the way IBM’s earnings calendar and guidance cadence line up with midyear, when investors reassess full-year spending on software, infrastructure and AI projects. Analysts have also pointed to institutional portfolio repositioning in midterm election years, where money rotates toward cash-generative, dividend-paying tech names as policy risk rises.[1] This midterm-summer IBM trading window may reflect that slow shift into perceived “defensive tech” as the broader market digests Washington headlines.
What is driving IBM (IBM) today?
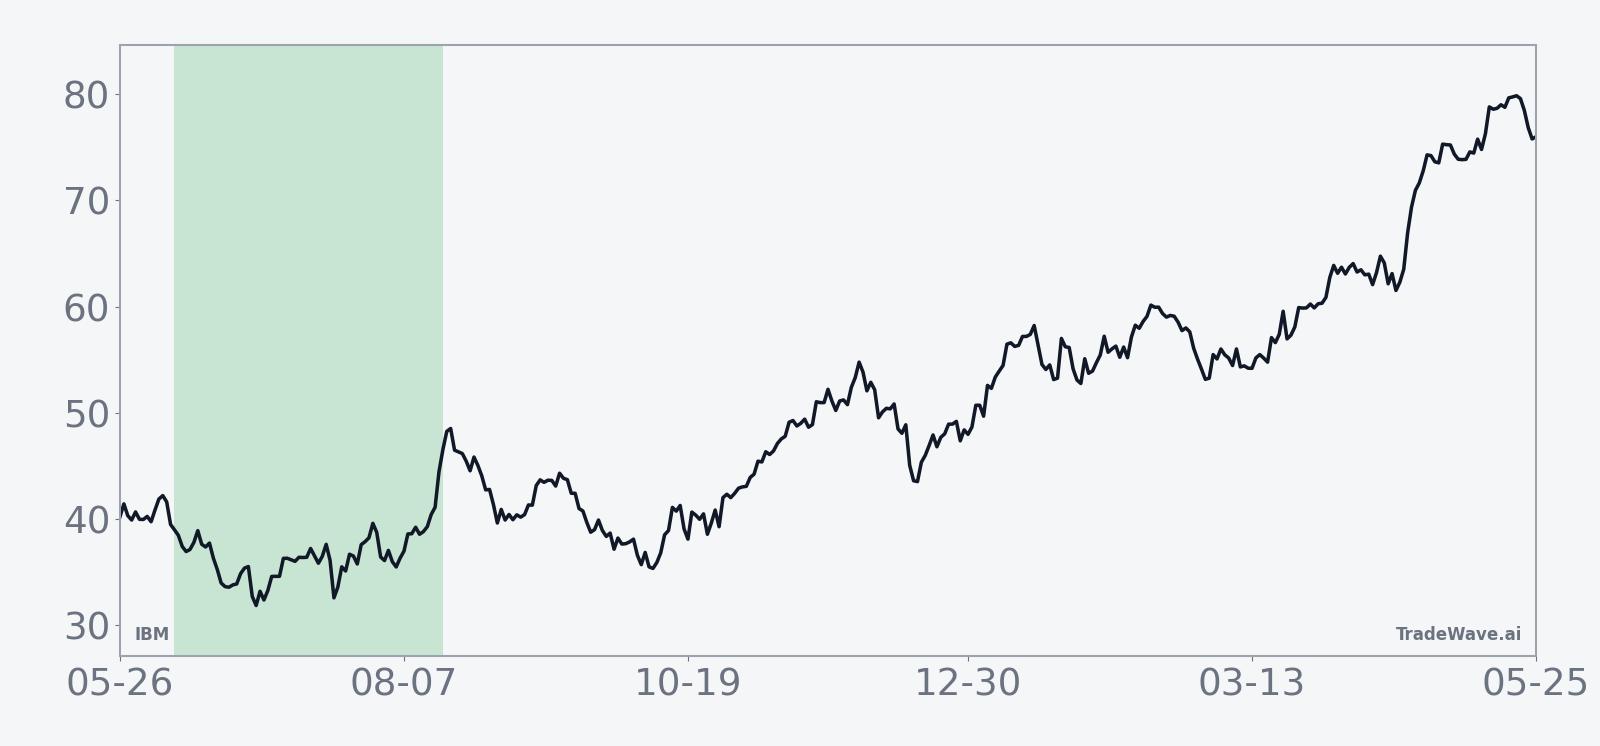
IBM slipped 0.9% to $251.45 on May 27, trading in a $245.45 to $254.55 intraday band and sitting about 20.6% below its 52-week high of $316.55 while remaining roughly 18.4% above its 52-week low of $212.34. The stock is still digesting its Apr 23 first-quarter report, when shares fell despite an earnings beat as investors focused on a cautious tone around the outlook and the reaction reset expectations after a strong run into the print.[3] That Q1 update kept the company’s target of more than 5% constant-currency revenue growth for 2026, reinforcing a steady, if unspectacular, growth profile anchored by hybrid cloud, AI and infrastructure demand.[3]
In October 2025, IBM had already raised its full-year 2025 revenue growth and free cash flow guidance after topping third-quarter estimates, but the stock still sold off as investors questioned the durability of the beat and weighed the pace of AI monetization.[4] Earlier in July 2025, a strong second-quarter headline number was overshadowed by concerns about a softer software mix, which kept some investors on the sidelines despite double-digit growth in hybrid cloud and Red Hat.[6] Those episodes show how IBM’s narrative has shifted from pure turnaround to a more nuanced debate about margin expansion, mainframe cycles and how quickly its AI book of business, which exceeded $9.5 billion by late 2025, can translate into sustained top-line acceleration.[4]
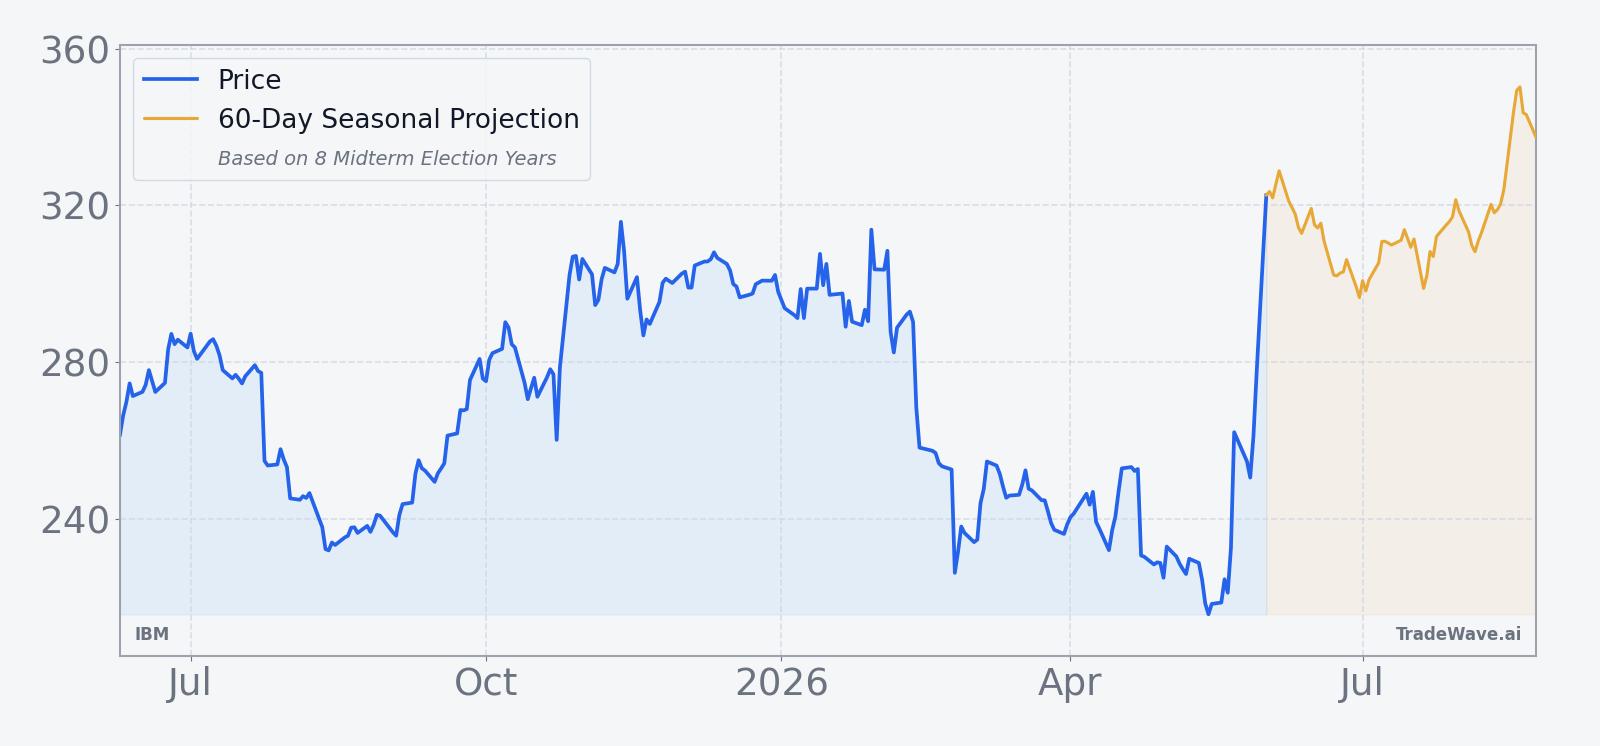
The chart below situates the latest move in its recent multi-month context alongside a 60-day seasonal projection.
What should traders watch as this IBM seasonal window approaches?
First, the calendar: the 70-day IBM trading window tied to midterm election years begins on Jun 9, so price action in the next two weeks will set the starting point for this historically bullish stretch. A firm base above the recent $245 area would keep the stock comfortably above its 52-week low and give the seasonal pattern more room to work, while a break back toward that low would test how much investors still trust the AI and hybrid-cloud story after the Q1 wobble.[3]
Second, watch how IBM trades around macro and policy headlines that typically heat up in the middle of a midterm election year, including budget debates and regulatory noise around big tech. If the stock shrugs off those crosscurrents and grinds higher in line with its historical seasonality, it would reinforce the idea that investors see IBM as a relative safe haven inside the broader tech sector. A choppy tape with deep intraday selloffs that quickly reverse would still be consistent with past windows, given how often maximum adverse excursions have stretched into double digits before finishing positive.
Finally, monitor any updates on IBM’s AI pipeline, mainframe cycle and software growth as the company moves closer to its next earnings update. Stronger commentary on AI deal flow or infrastructure demand could give the seasonal pattern a fundamental tailwind, while another “beat and selloff” reaction like April’s would signal that expectations remain ahead of execution.[3] For traders who track historical seasonality, the key tell will be whether IBM respects its midterm-summer tendency to finish higher over the full 70-day window, even if the path there includes the kind of sharp swings that have defined prior cycles.
Sources
- [1] CNBC, "IBM is trying to rebound after results disappointed initially. What analysts and investors are saying" (Oct 23, 2025).
- [2] MarketWatch, "IBM’s stock is sliding. Here’s why these analysts see an opportunity to buy." (Jul 24, 2025).
- [3] Yahoo Finance, "IBM Stock Tumbles. Solid Quarter Can't Offset Tepid Forecast" (Apr 23, 2026).
- [4] CNBC, "IBM tops third-quarter estimates and lifts guidance, but stock drops" (Oct 22, 2025).
- [6] MarketWatch, "Why is IBM’s stock down after an earnings beat? Here’s one quibble." (Jul 23, 2025).
About this seasonal analysis
Seasonal pattern data is sourced from TradeWave.ai, which analyzes historical price behavior across annual calendar windows going back up to 30 years. Read the full data methodology or the book The 100-Year Pattern by Afshin Moshrefi (2026 edition). Past performance of seasonal patterns does not guarantee future results. This article is for informational purposes only and does not constitute investment advice.