8-of-10 Midterm Summer Losses: Illinois Tool Works (ITW) Enters a Weak 45-Day Window
Illinois Tool Works is heading into a 45-day midterm-year seasonal window that has often rewarded short sellers, even as the stock trades near the middle of its 52-week range.

What is the seasonal pattern for Illinois Tool Works (ITW)?
Illinois Tool Works has fallen in 8 of 10 midterm-year summer windows during this 45-day pattern, with an average loss of 6.94% in winning short years.
- 8 for 10 in this window, with short trades averaging 6.94% gains in winning years.
- Seasonal window runs from Jun 6 for 45 trading days in the last 10 midterm election years.
- Percent Profitable is 80%, with 8 winners and 2 losers for the short-side pattern.
- Including all years, Avg Profit - All is 5%, showing the edge survives losing cycles.
- TradeWave Ratio of 1.92 signals that price has typically traveled meaningfully in the short direction within the window.
- Sharpe ratio of 0.94 points to a historically favorable risk-adjusted profile for this specific short window.
According to historical data from TradeWave.ai, this upcoming stretch for Illinois Tool Works behaves differently from a typical summer rally tape. TradeWave.ai’s historical database shows a repeatable midterm-year pattern that has often favored short exposure in this 45-day window.
How has Illinois Tool Works (ITW) traded in this midterm-year summer window?
Illinois Tool Works has delivered profitable short trades in 8 of the last 10 midterm election years during the 45 trading days starting Jun 6, with winning years averaging 6.94% moves in the short direction. Shares last closed at 250.585, leaving the stock about 16.3% below its 52-week high and roughly 10.0% above its 52-week low based on recent trading ranges.
Grouping the data by the presidential election cycle matters here because this year sits in the midterm election year, a phase that often brings policy noise, spending debates and choppier industrial order books than the pre-election year that follows. For a diversified industrial like Illinois Tool Works, that backdrop can translate into more volatile summer trading as investors reassess capital spending, defense budgets and global manufacturing demand.
This seasonal window begins on Jun 6 and spans 45 trading days. Historically, during this period in the last 10 midterm election years, Illinois Tool Works has tended to drift lower, aligning with a short trade direction rather than a long bias. The pattern’s Percent Profitable of 80%, with 8 winners and 2 losers, signals that most cycles have rewarded traders positioned for downside rather than upside.
Avg Profit of 6.94% reflects the average gain in those 8 winning short years, while Avg Profit - All of 5% folds in the 2 losing years and still leaves a solid edge. In other words, even after accounting for the years when shorts were squeezed, the typical outcome across the full sample has been meaningfully positive for the short side. The relatively small Avg Loss of -0.74% in losing years shows that when the pattern has failed, the damage has historically been contained compared with the size of the wins.
The TradeWave Ratio (TWR) for this pattern is 1.92, which means price has typically traveled a substantial distance in the short direction within the window, independent of where it finished. Combined with a Sharpe ratio of 0.94 based on end-of-window outcomes, the historical profile looks like a targeted, risk-adjusted short window rather than random midyear noise.
Looking at individual years, the strongest short-side outcome came in 2002, when the stock fell 14.27% from entry to exit during the window, with a best intraperiod drop of 15.97% from the starting level before any rebound. The weakest year for shorts was 1990, when Illinois Tool Works rose 1.15% over the window and at one point traded 5.28% above the entry price, illustrating how squeezes can develop even inside a generally bearish seasonal stretch.
The historical seasonal trend chart for this window shows that weakness has often built gradually rather than in a single air pocket. In many midterm years, Illinois Tool Works has chopped sideways early in the window before sliding more decisively in the back half, which matters for traders thinking about timing and risk management rather than just direction.
The cumulative return profile across the last 10 midterm election years reinforces that story. When you stack the windows together, the line slopes steadily in favor of shorts, with few deep countertrend spikes that would erase multiple years of gains. Add it up: a 67% cumulative return across these ten midterm-year windows for the short side is not a fluke, even if individual years have been noisy.
Put simply, this has been a summer stretch where short sellers have usually had the wind at their backs in Illinois Tool Works, not a period where dip buyers have dominated the tape.
Why does Illinois Tool Works (ITW) follow this seasonal pattern?
One likely driver is the way industrial and aerospace-and-defense order cycles line up with the policy calendar in midterm election years, when budget debates and procurement decisions can slow or shift spending. Analysts have also pointed to institutional portfolio repositioning in the summer as managers rebalance exposure to longer-cycle industrial names ahead of the typically stronger pre-election year. For Illinois Tool Works, that combination may translate into cautious guidance tones and lighter positioning in this specific midyear window, which has historically favored short trades.
History does not guarantee future results, and even in winning windows the worst intraperiod drawdowns can be large enough to challenge short positions before the pattern plays out.
What is driving Illinois Tool Works (ITW) today?
Illinois Tool Works shares last changed hands at 250.585, up 0.13% on the day, after trading between 249.8401 and 253.72 on volume of about 611,000 shares. That leaves the stock roughly 16.3% below its 52-week high near 299.36 and about 10.0% above its 52-week low around 227.88, with the 50-day moving average sitting higher at roughly 258.63 and 20-day average volume closer to 1.33 million shares, suggesting liquidity is ample even as price has slipped about 3.61% over the past month.
In the background, analysts have framed 2025 earnings guidance as conservative, pointing to an EPS range of $6.35 to $6.55 and flagging potential for organic growth to run ahead of those assumptions if industrial demand and aerospace-and-defense spending stay firm.[1] Sector commentary has highlighted healthy trends in longer-cycle aerospace and defense businesses, with military funding and rising drone operations seen as tailwinds for industrial suppliers tied into that ecosystem.[1] For Illinois Tool Works, that mix of cautious guidance and supportive end markets sets up a tug-of-war between macro optimism and company-level execution as the midterm-year summer window opens.
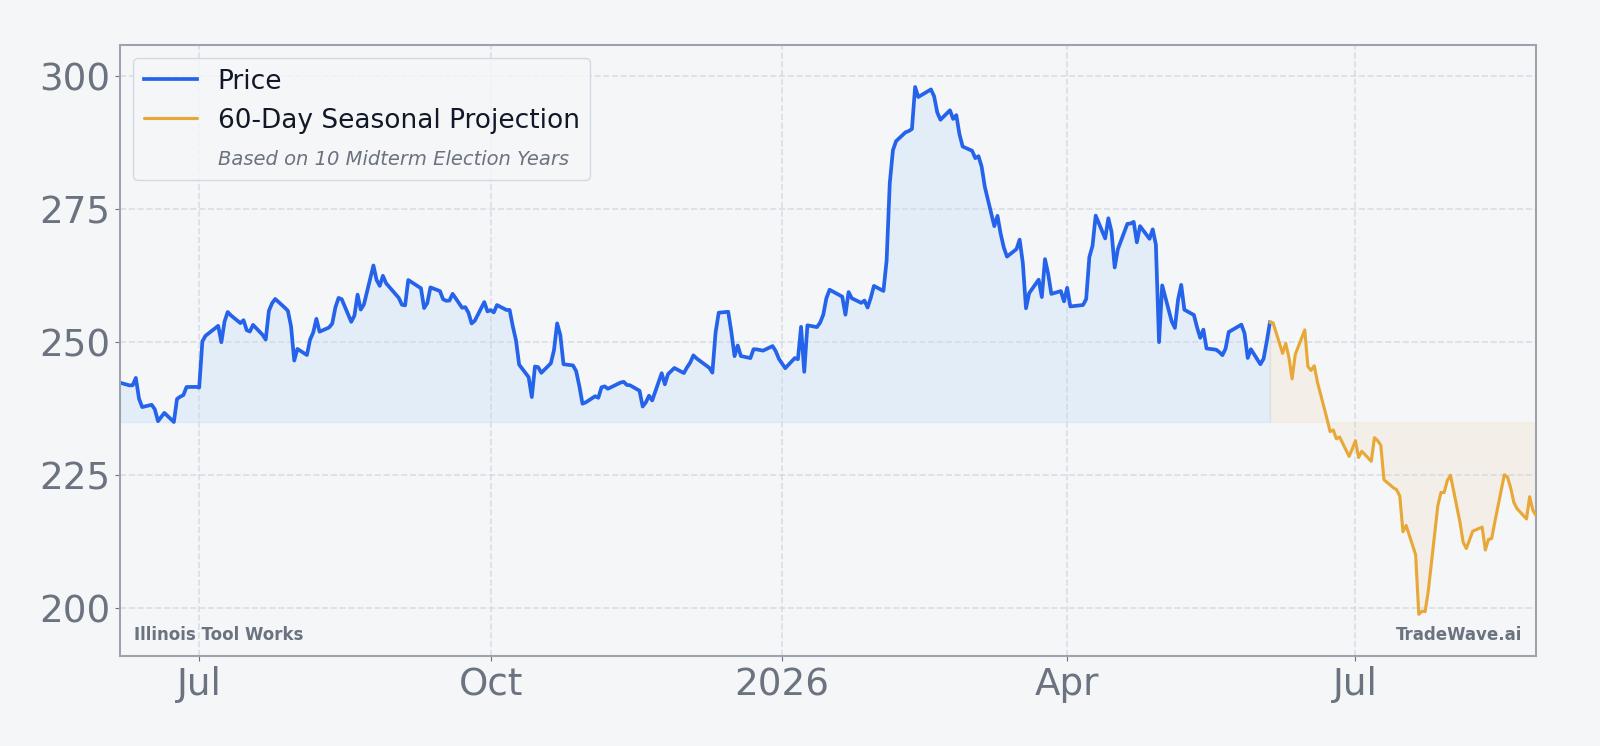
The chart below situates the latest move in its recent multi-month context and overlays the upcoming 60-day seasonal projection.
What should traders watch in this Illinois Tool Works (ITW) seasonal window?
First, watch how Illinois Tool Works trades as the Jun 6 window opens relative to its 50-day moving average near 258.63. A failure to reclaim that level and a drift back toward the low 240s would be consistent with the historical short-side bias, while a decisive push back toward the high 260s would look more like one of the rare losing years for this pattern.
Second, keep an eye on any updates to 2025 guidance or commentary around organic growth and aerospace-and-defense exposure, since prior midterm-year summers have often coincided with shifting expectations around industrial demand and defense budgets.[1] Stronger-than-expected order trends or upbeat commentary could blunt the usual seasonal weakness, while cautious tones would fit the historical script.
Finally, monitor volume and intraday volatility as the window progresses. The historical record shows that when this pattern moves, it has often done so with meaningful excursions in the short direction, but with occasional sharp squeezes along the way. How Illinois Tool Works behaves inside this 45-day stretch will tell traders whether the midterm-year seasonal script is repeating or being rewritten.
Sources
About this seasonal analysis
Seasonal pattern data is sourced from TradeWave.ai, which analyzes historical price behavior across annual calendar windows going back up to 30 years. Read the full data methodology or the book The 100-Year Pattern by Afshin Moshrefi (2026 edition). Past performance of seasonal patterns does not guarantee future results. This article is for informational purposes only and does not constitute investment advice.