Advanced Micro Devices (AMD) Faces AI Hype Hangover as 40-Day Midterm Summer Slide Nears
Advanced Micro Devices is heading toward a historically weak 40-day midterm-year window just as the stock pulls back sharply from AI-fueled highs, raising the stakes for traders watching this seasonal pattern.

What is the seasonal pattern for Advanced Micro Devices (AMD)?
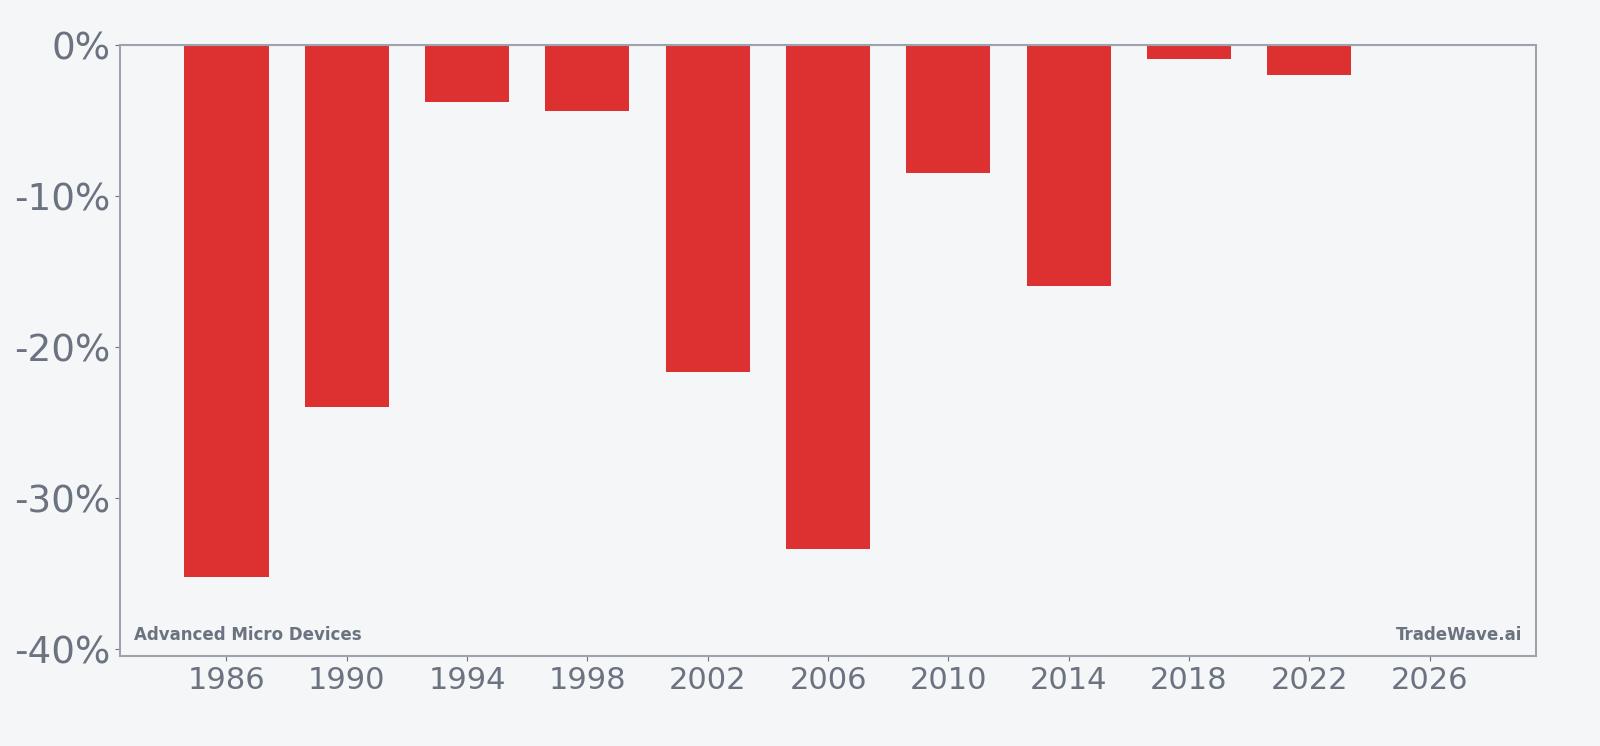
Advanced Micro Devices has fallen in 10 of 10 midterm election years during this 40-day June–July window, with an average 14.98% gain for short positions in winning years.
- 10 for 10 in this window for shorts, with an average 14.98% profit across winning years.
- The 40-day window starts Jun 15 and has historically been a bearish stretch for AMD in midterm election years.
- Percent Profitable is 100%, with 10 winners and 0 losers for the short-side pattern.
- Individual years have seen net declines as deep as 35.2%, underscoring how sharp moves can be in this AMD seasonal trend.
- Maximum adverse excursions have reached nearly 37% in some years, showing that rallies against the short can be painful before the pattern resolves lower.
- The TradeWave Ratio of 2.17 points to meaningful intraperiod travel in the trade direction, highlighting elevated volatility inside this Advanced Micro Devices trading window.
According to historical data from TradeWave.ai, this midterm-year summer stretch has behaved very differently from an average month for AMD, with a clear directional bias that many investors overlook.
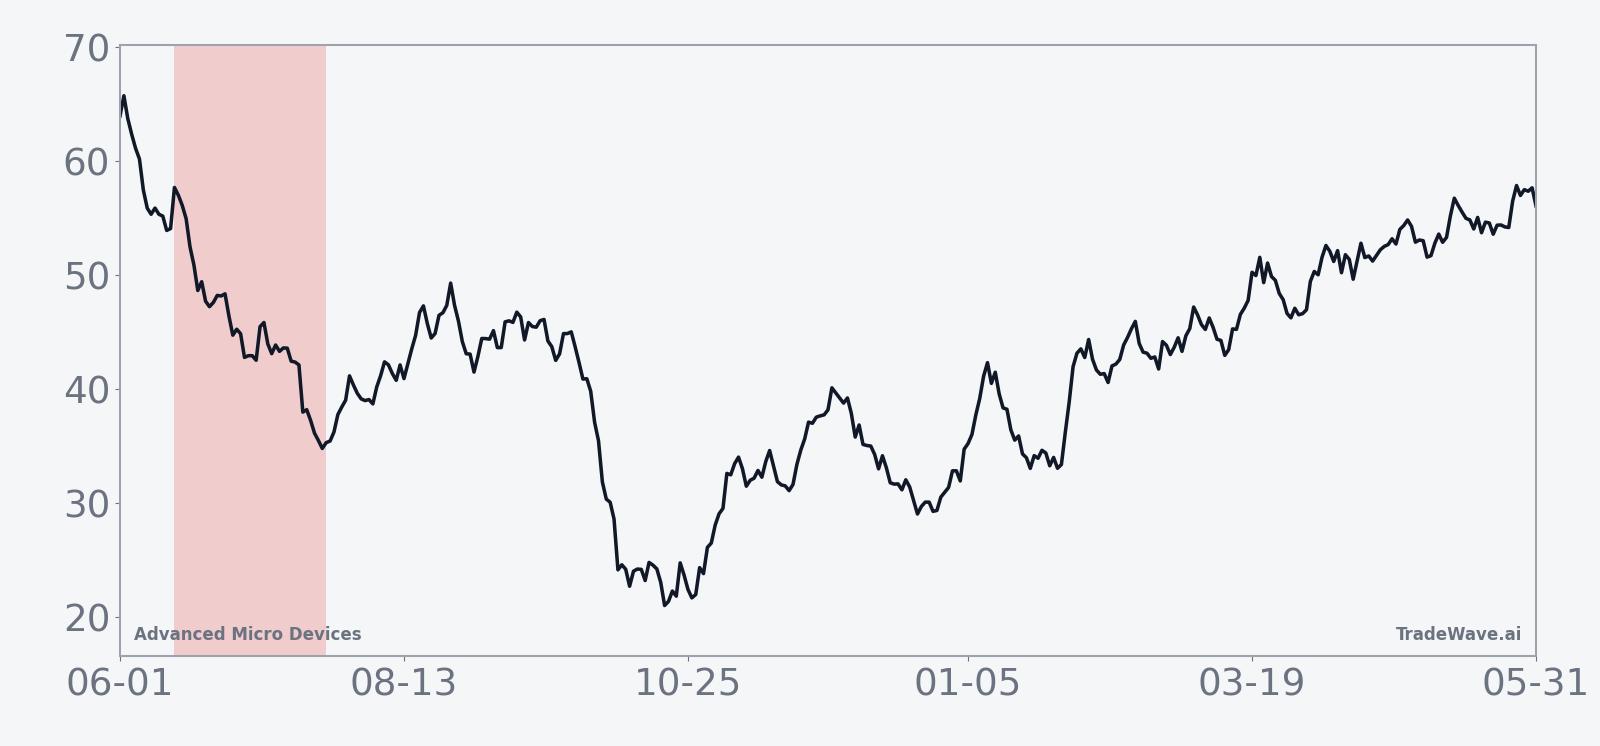
How has Advanced Micro Devices (AMD) traded in this midterm-year summer window?
Advanced Micro Devices has declined in every one of the last 10 midterm election years during the 40 trading days starting Jun 15, a window that has historically rewarded short positions with an average 14.98% gain. Today the stock closed at 472.07, down 9.8% on the session and sitting about 13.6% below its 52-week high of 546.44 after a powerful AI-driven run. Weekly options around AMD’s latest earnings were priced for nearly a 9% move and skewed toward upside participation, showing how aggressively traders have been willing to pay for volatility in this name.[6]
Grouping AMD’s behavior by the presidential election cycle matters here because this pattern only looks at the last 10 midterm election years, a phase that often brings policy uncertainty, tighter financial conditions and choppier risk appetite than the pre-election year that follows. In other words, this is not a generic June–July effect; it is a mid-cycle, midterm-year quirk that has repeated across very different macro backdrops.
Across those 10 midterm-year samples, every single iteration produced a negative net return for AMD during this 40-day stretch, consistent with the short trade direction. The worst year for longs was 1986, when the stock fell 35.2% from entry to exit, while 2006 was close behind with a 33.4% slide. Even the “milder” years like 1994, 1998, 2018 and 2022 still finished lower, with net drops between 0.9% and 4.4%, which is why the Percent Profitable metric for shorts sits at 100% with 10 winners and 0 losers.
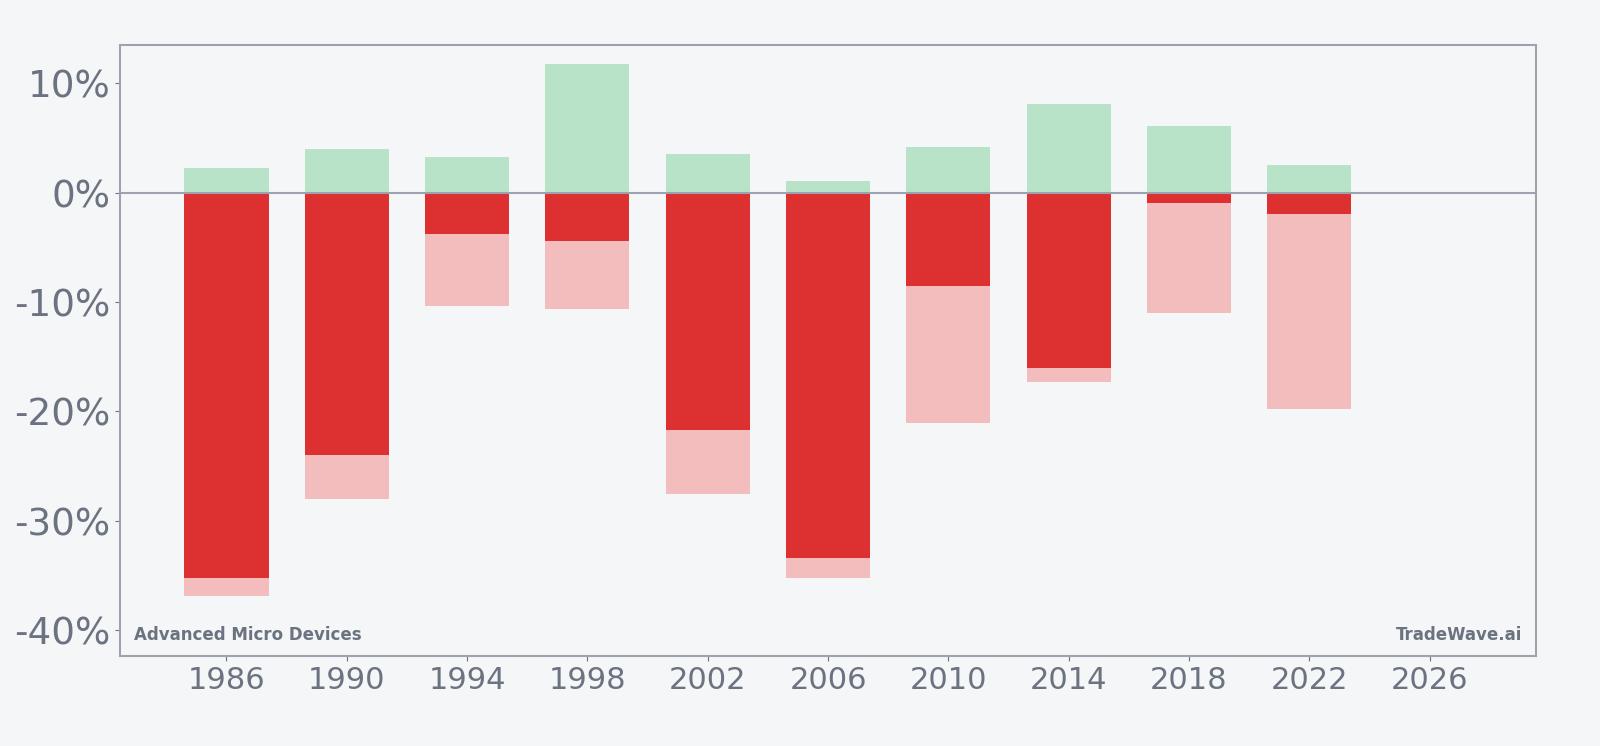
The average 14.98% profit for shorts masks a wide range of paths inside the window. Maximum favorable excursions, the best point-to-peak move in the trade direction, have been modest in some years, such as 1.03% in 2006, and more generous in others, like 11.76% in 1998. Maximum adverse excursions, the worst drawdown from entry, have been much larger, reaching 36.87% in 1986 and 35.27% in 2006, which means that even in years that ultimately paid off for shorts, AMD could squeeze sharply higher before rolling over.
The per-year table shows that the deepest net declines tended to cluster in earlier cycles like 1986, 1990, 2002 and 2006, when AMD was a smaller, more cyclical chip name. More recent midterm years such as 2010, 2014, 2018 and 2022 still followed the same direction but with smaller net moves, often after sizable intraperiod swings. That mix of consistent direction and varied magnitude is what drives the TradeWave Ratio of 2.17, which signals that price typically travels meaningfully in the short direction at some point during the window, even if the final close does not capture the full move.
A second view that layers in best- and worst-case intraperiod swings helps show how far AMD has tended to move inside this window.
Put together, the record is stark: 10 for 10 winning years for shorts, double-digit average profits and a history of sharp swings that can punish both complacent longs and poorly timed shorts.
Why does Advanced Micro Devices (AMD) follow this seasonal pattern?
One likely driver is the way AMD’s earnings calendar and guidance updates cluster around midyear, when investors reassess spending on data-center and PC chips and often reset expectations. Analysts have also pointed to midterm election years as periods when policy and rate uncertainty weigh more heavily on high-beta growth names, which can amplify any disappointment in AI or data-center spending plans. This pattern may also reflect institutional portfolio rebalancing away from crowded semiconductor trades ahead of the historically stronger pre-election year.
History does not guarantee future results, and the worst intraperiod drawdowns in this window show that AMD can move sharply against the short trade before ultimately resolving lower.
What is driving Advanced Micro Devices (AMD) today?
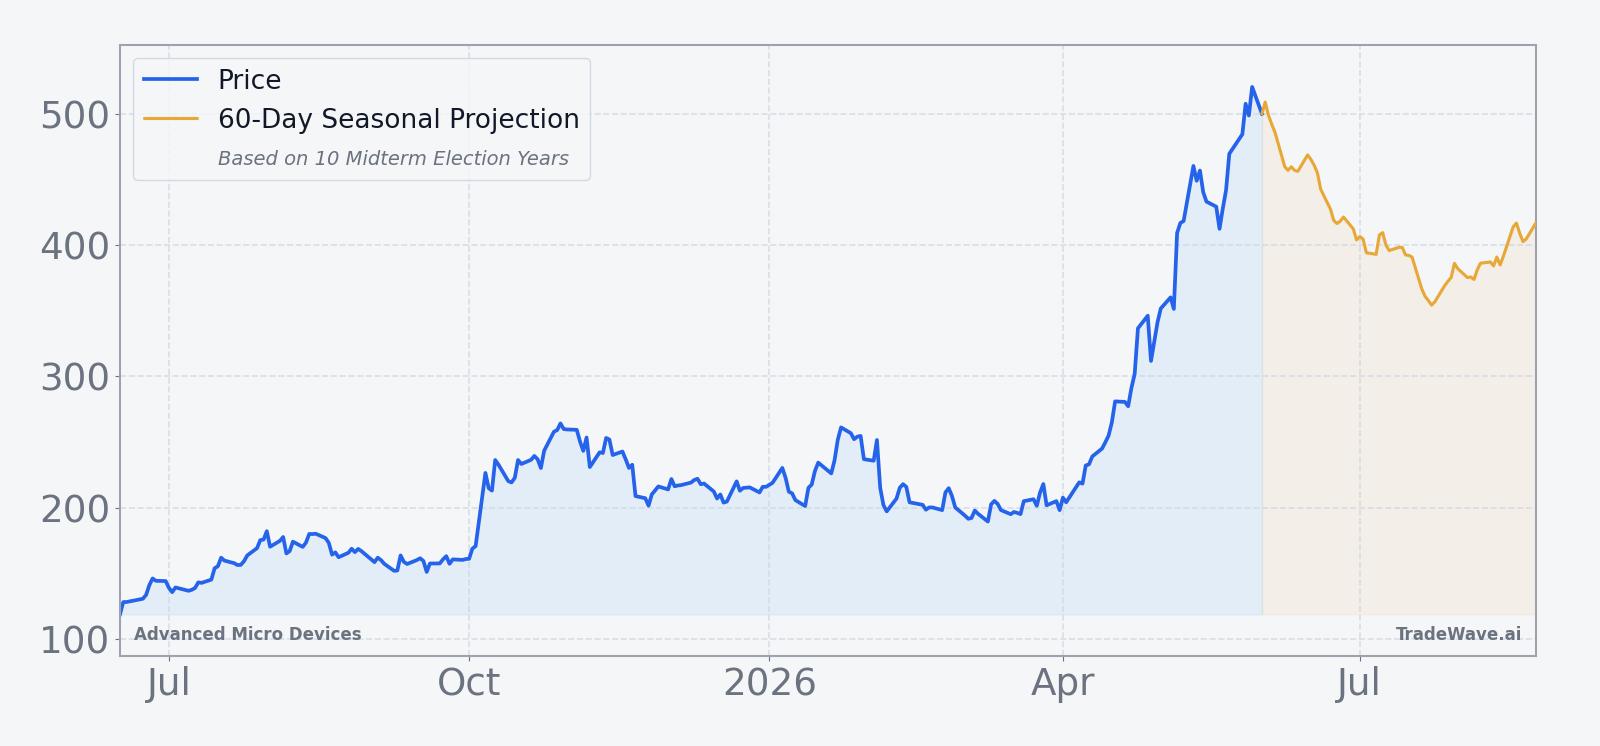
AMD dropped 9.8% to 472.07 on Monday, a sharp reversal that leaves the stock about 13.6% below its 52-week high of 546.44 even after a strong one-month gain of 14.18%. The pullback comes in the wake of blockbuster Q1 results reported in early May, when revenue jumped 38% year over year to $10.25 billion, adjusted EPS hit $1.37 and data-center sales surged 57% to $5.8 billion on AI demand.[4] Management guided to roughly $11.2 billion in revenue for the next quarter, reinforcing the AI-driven growth story that had helped push AMD to fresh highs.[10]
Coverage from major financial outlets in early May framed the quarter as a turning point, with headlines highlighting a “stunning AI-fueled revenue jump” and a near-doubling of profit as hyperscale customers ramped spending on AMD’s Instinct accelerators.[4][10] That enthusiasm was mirrored in derivatives markets, where options traders ahead of the report priced in a roughly 9% post-earnings move and leaned toward aggressive upside structures, signaling strong demand for leverage into potential good news.[6] The combination of high expectations, heavy positioning and a rapid price ascent has left AMD vulnerable to air pockets like Monday’s slide when sentiment cools or macro jitters flare.
The chart below situates the latest move against AMD’s past year of trading and a 60-day seasonal projection.
AMD’s role as a flagship AI and semiconductor name means its swings often ripple through broader tech and growth indices. The stock’s recent surge on AI optimism, followed by a sharp single-day drop, fits a pattern seen around prior inflection points where strong fundamentals collide with crowded positioning. As the calendar moves toward the historically weak midterm-year summer window, traders will be watching whether AI-driven demand and upbeat guidance can offset a seasonal backdrop that has not favored longs in past cycles.
What should traders watch as AMD enters this seasonal window?
First, the calendar: the 40-day window beginning Jun 15 runs through late July, overlapping a period when AMD has historically struggled in midterm election years even when the broader market was healthy. Price behavior around key levels such as the recent high near 546 and the 50-day moving average around 358.72 will help show whether this time is tracking closer to the deeper-drawdown years like 1986 and 2006 or the more muted declines seen in 2018 and 2022.
Second, watch how options and volume behave relative to May’s earnings episode. If upside call demand and implied volatility rebuild toward the extremes seen when traders were pricing a 9% post-earnings move, it would suggest speculative appetite is returning despite the seasonal headwind.[6] A fade in that activity, or a shift toward downside protection, would signal that investors are taking the historical pattern more seriously and are less willing to fight a window that has gone 10 for 10 against longs.
Finally, keep an eye on AI and data-center headlines. Any signs that hyperscale customers are pacing orders differently, that China-related AI shipments are being delayed or that competitors are gaining share could interact with this historically weak stretch to magnify volatility. If AMD can hold higher lows and shrug off negative news during the window, it would mark a clear break from its usual midterm-year script. If instead the stock sells off on otherwise solid news, it will look like the old seasonal playbook is still in force.
Sources
- [1] Barchart – Can AMD Stock Hit $210 In 2025? (Jul 31, 2025)
- [2] Yahoo Finance – AMD Reports August 5—Analyst Sees Q3 Upside and CPU Market Gains (Jul 31, 2025)
- [3] The Motley Fool – AMD Stock Slips Despite 30% Earnings Growth and Stronger-Than-Expected Guidance (Nov 5, 2025)
- [4] Yahoo Finance – AMD Shares Jump 15% on Stunning AI-Fueled Revenue Jump and Strong Outlook (May 6, 2026)
- [5] Seeking Alpha – AMD shares end in red after six straight days of gains (Jul 31, 2025)
- [6] Seeking Alpha – AMD options traders price ~9% post-earnings move (May 5, 2026)
- [7] Barron's – AMD Stock Jumps on Solid Earnings (May 5, 2026)
- [8] Seeking Alpha – Did AMD Just Leapfrog Nvidia? (NASDAQ:AMD) (Jan 14, 2026)
- [9] Forbes – Advanced Micro Devices Stock Could Make Quick Comeback (Jan 8, 2026)
- [10] Yahoo Finance – AMD Jumps on AI Surge, Profit Nearly Doubles (May 7, 2026)
About this seasonal analysis
Seasonal pattern data is sourced from TradeWave.ai, which analyzes historical price behavior across annual calendar windows going back up to 30 years. Read the full data methodology or the book The 100-Year Pattern by Afshin Moshrefi (2026 edition). Past performance of seasonal patterns does not guarantee future results. This article is for informational purposes only and does not constitute investment advice.