Gartner (IT) Has Favored Shorts in 5 of 7 Midterm Junes, Averaging 7.46% Declines
Gartner shares are trading well below their 52-week high as a historically soft 30-day midterm-year window approaches, putting a spotlight on how AI disruption and cautious spending could interact with the stock’s seasonal trend.

What is the seasonal pattern for Gartner (IT)?
Gartner has moved in favor of short trades in 5 of the last 7 midterm-year June windows, with average winning moves of 7.46% over the 30-day stretch.
- 5 wins and 2 losses for the short side in this 30-day midterm-year window, with average winning moves of 7.46%.
- Percent Profitable is 71%, with 5 winning short years and 2 losing years across the last 7 midterm election cycles.
- Including every year, Avg Profit - All is 5%, showing that losing years have been smaller than the best short-side moves.
- The window runs from Jun 2 for 30 trading days and has historically leaned bearish for Gartner in the midterm election year phase.
- Individual years have seen adverse moves as deep as about 17.56% against the short, underscoring meaningful intraperiod risk.
- TradeWave Ratio of 1.78 and a Sharpe ratio of 0.77 point to a pattern where downside moves have often developed with notable efficiency.
According to historical data from TradeWave.ai, this upcoming midterm-year stretch for Gartner has behaved differently from a typical month on the calendar, with a clear short-side bias in prior cycles.
How has Gartner (IT) traded in this midterm-year June window?
Starting Jun 2, a 30-day midterm-year window has historically favored short positions in Gartner, with 5 winning short years out of 7 and average winning moves of 7.46%. Today the stock closed at 161.15, up 0.73% on the session and sitting about 63.8% below its 52-week high of 445.50, after a 7.29% gain over the past month.[1]
Because this pattern is grouped by the presidential election cycle, it reflects how Gartner has behaved specifically in the midterm election year, not across random calendar years. That matters in 2026, which is itself a midterm election year, as corporate IT budgets and policy expectations often reset ahead of the pre-election year, shaping how clients commit to multi-year research and advisory contracts.
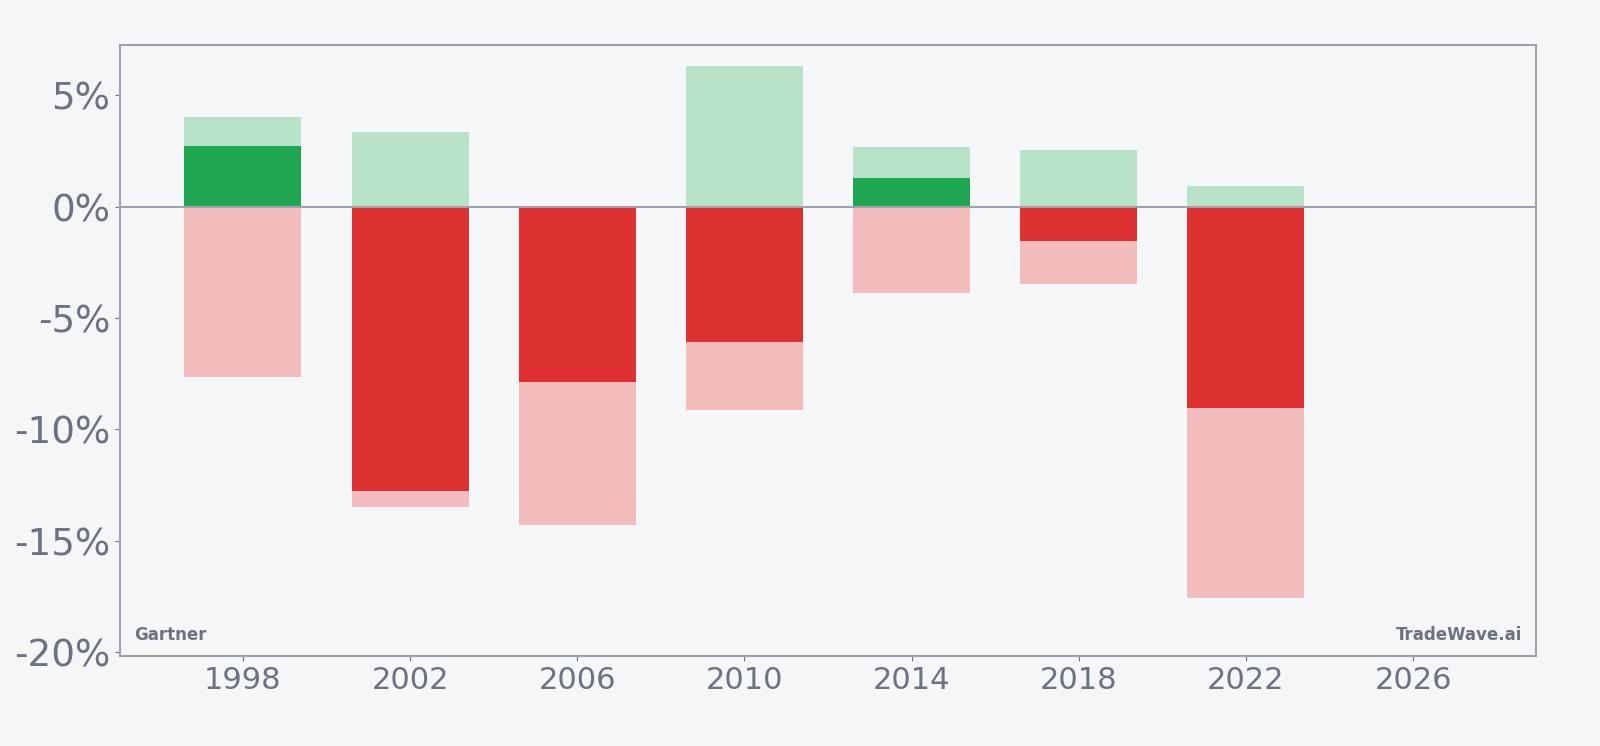
A second view layers in both the best and worst intraperiod swings for each year.
Across the seven midterm-year samples, the short side has been profitable in 5 years, while 2 years saw rallies that hurt shorts. Average profit on winning shorts is 7.46%, but when every year is included, Avg Profit - All is still 5%, which tells you the losing years have not fully offset the stronger downside stretches. The Sharpe ratio of 0.77 suggests that, on an end-of-window basis, returns have been reasonably attractive relative to volatility for traders leaning with the short-side seasonal bias.
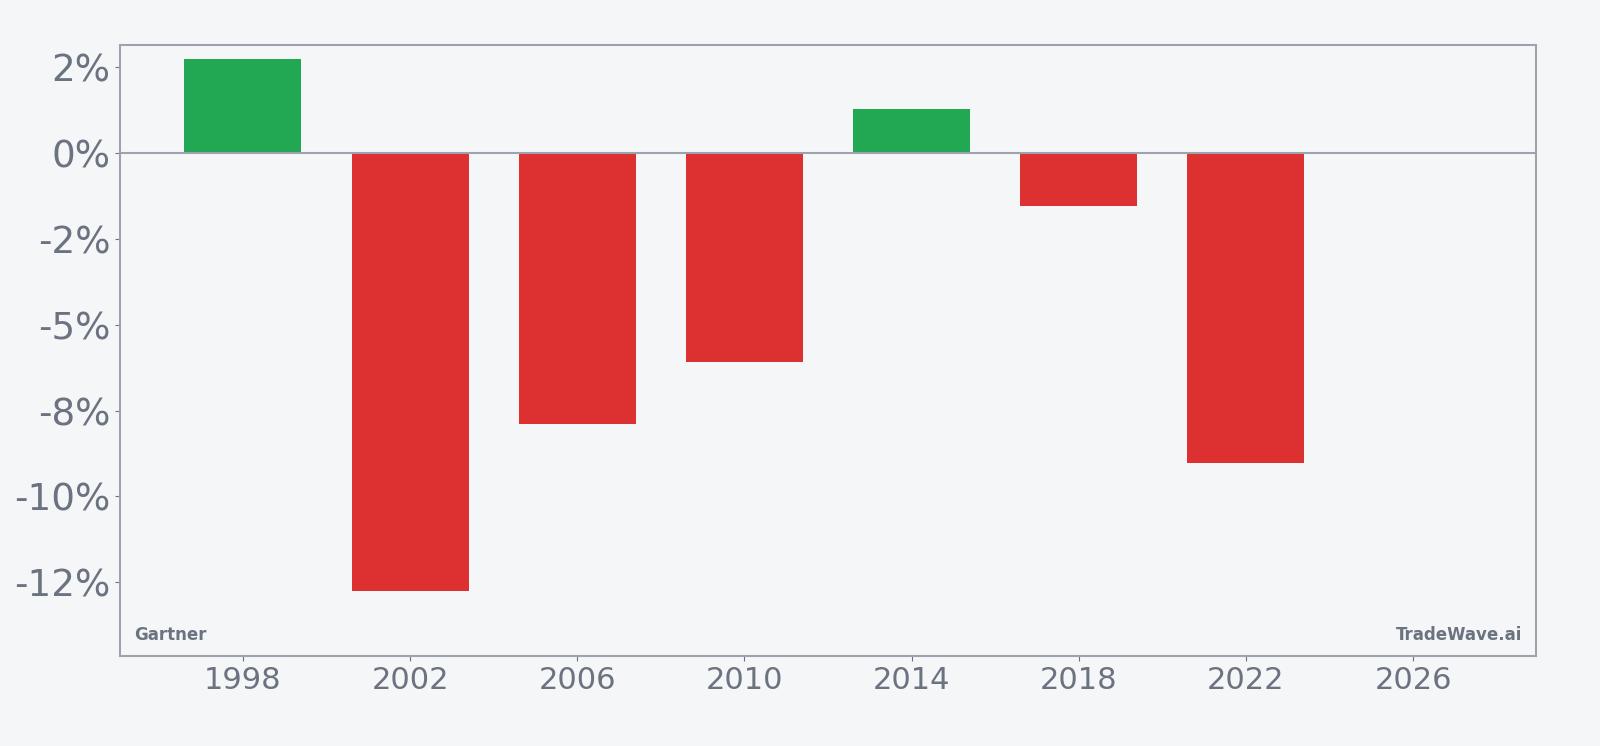
The per-year table shows how uneven individual cycles can be. In 2002, the short pattern captured a net return of -12.75% as Gartner fell from 10.98 to 9.58 over the window, while 2014 delivered only a modest 1.28% net move against the stock. The weakest year for shorts was 1998, when Gartner rose 2.74% during the window, and 2018 also saw a small 1.54% loss for the short side, reminding traders that even in a bearish seasonal window, squeezes do happen.
Intraperiod swings have been large. In 2022, the worst drawdown from entry, or maximum adverse excursion, reached about -17.56% against the short before the trade finished with a -9.03% net return, meaning the stock fell but not as far as the intraday extremes. In contrast, some years such as 2010 saw a maximum favorable move of 6.32% in the trader’s direction, with a final net return of -6.08%, showing that when the pattern works, it can move quickly and stay weak into the close of the window.
The TradeWave Ratio of 1.78 captures how far Gartner has typically traveled in the trade direction within the window, independent of where it finishes. Combined with the standard deviation of 5.72%, that points to a setup where volatility has been meaningful but skewed toward downside follow-through in most midterm-year June windows. The cumulative return across all seven samples is 37%, and the annualized return of 4.62% reflects how this relatively short window has still contributed a notable share of midterm-year performance for traders who focus on this slice of the calendar.
Put simply, this is a bearish-leaning seasonal window for Gartner: 5 for 7 in favor of shorts, with winning years that have tended to be meaningfully larger than the losing ones.
Why does Gartner (IT) follow this seasonal pattern?
One likely driver is the way enterprise IT budgets and contract renewals line up around midyear, especially in the midterm election year when policy and spending priorities are in flux. Analysts have pointed to cautious client behavior and cost-cutting when macro or political uncertainty rises, which can weigh on new commitments and free cash flow for research and advisory firms.[1] This pattern may also reflect institutional portfolio repositioning ahead of the stronger pre-election year, with investors trimming higher-multiple IT research names like Gartner before reallocating risk later in the cycle.[3]
History does not guarantee future results; adverse excursions (MAE) can be large even in winning windows, and individual years can diverge sharply from the historical average.
What is driving Gartner (IT) today?
Gartner closed Friday at 161.15, up 0.73% on the day, extending a 7.29% gain over the past month but still trading about 63.8% below its 52-week high of 445.50 and only 15.8% above its 52-week low of 139.18.[1] Trading volume of roughly 822,000 shares was below the 20-day average of about 1.67 million, suggesting the latest bounce has come on relatively light participation.[1]
In March 2026, Forbes highlighted how Gartner’s AskGartner tool and broader business transformation were supporting improved renewal rates, even as conservative 2026 revenue projections and softer free cash flow contributed to a valuation discount.[1] The same piece noted share repurchases and investment-grade bond issuance as signs of capital management discipline and confidence, though it did not flag specific insider buying or selling.[1]
Back in November 2025, a valuation review on Yahoo Finance, drawing on Simply Wall St analysis, argued that Gartner’s new forecasts around AI’s impact on the workforce and cloud transformation could be underappreciated by the market if clients accelerate digital investments and deepen advisory relationships.[2] A separate Forbes comparison in September 2025 framed Gartner as a faster-growing, higher-margin alternative to legacy IT services peers, underscoring its leadership in IT research and advisory even as investors debated how AI disruption and client cost-cutting might affect recurring revenue growth.[3]
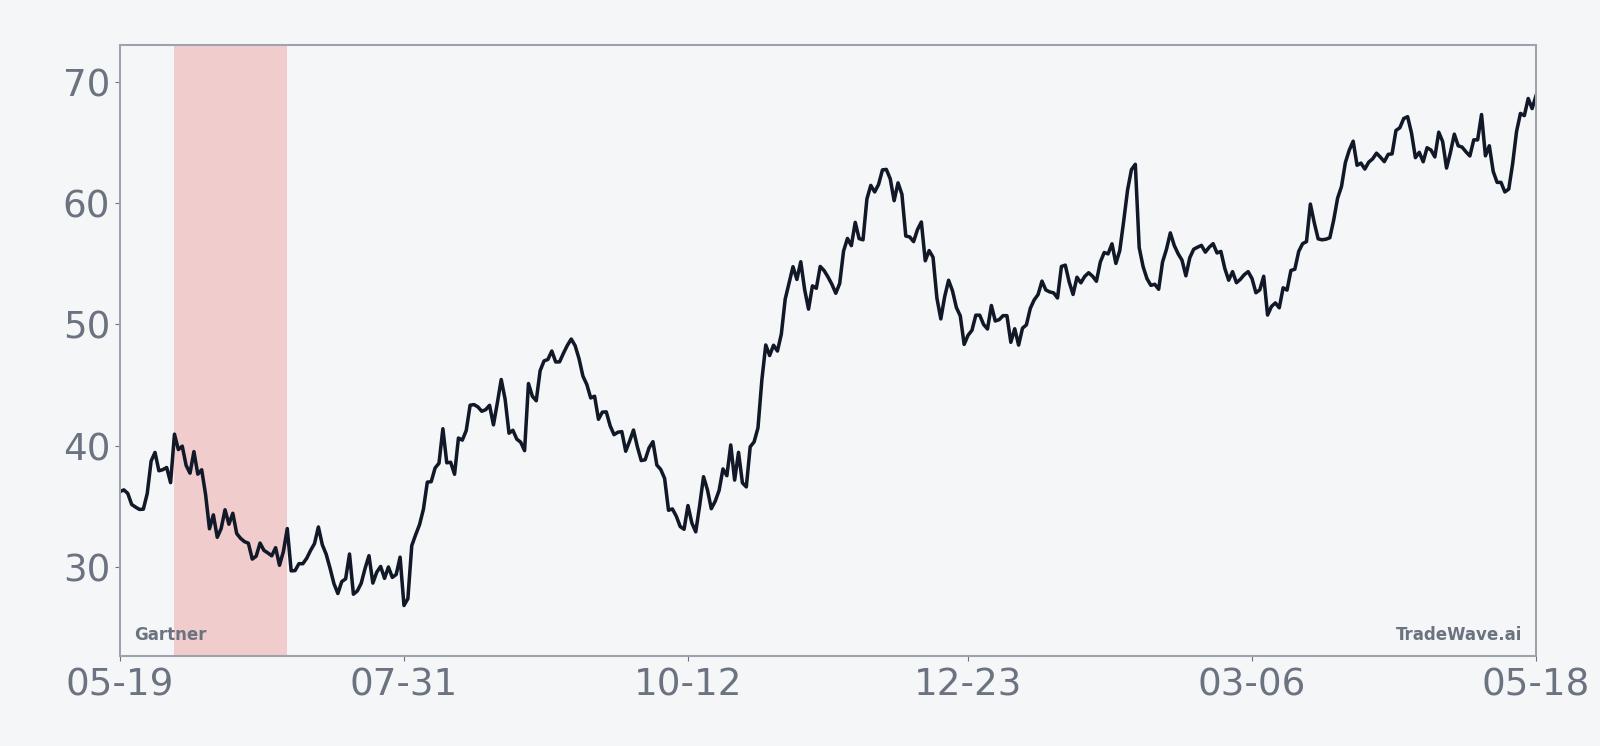
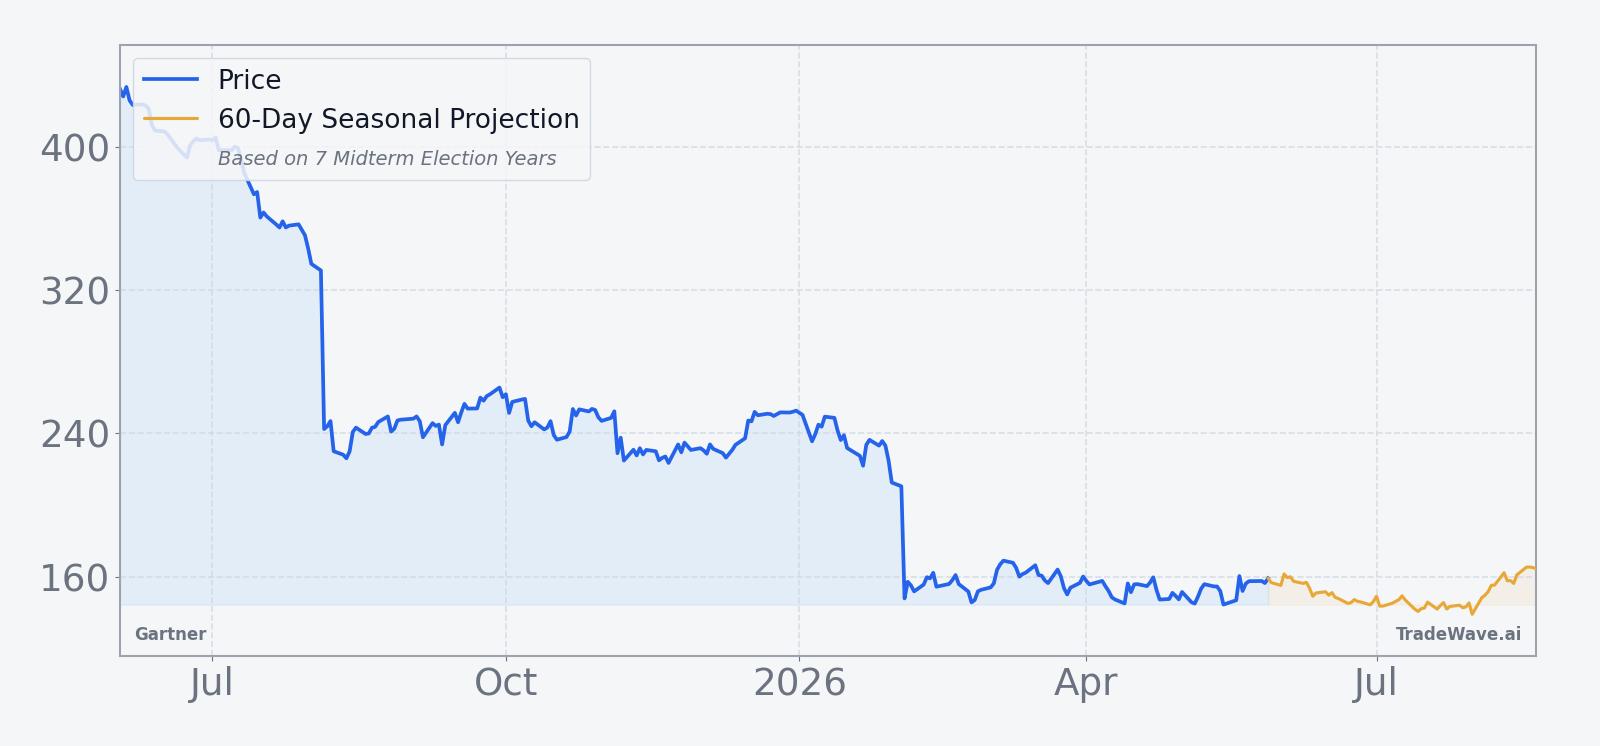
The chart below situates the latest move in its recent multi-month context alongside a 60-day seasonal projection.
What should traders watch in this upcoming window?
First, the calendar: the 30-day midterm-year window begins on Jun 2 and runs through early July, a period that has historically leaned bearish for Gartner even when the broader tech sector has been mixed. Traders will be watching whether the stock respects resistance near recent bounce highs on the daily chart or instead grinds lower in line with the historical short-side bias.
Second, macro and policy catalysts matter. AI disruption and client cost-cutting have already been cited as headwinds for recurring revenue and free cash flow, and any fresh commentary from management or large enterprise customers about budget tightening could reinforce the historical pattern.[1] Conversely, signs that AI-related advisory demand is accelerating, or that clients are locking in longer-term contracts, would challenge the idea that this midterm-year stretch must be weak.[2]
Third, watch how volatility behaves inside the window relative to history. Prior midterm-year June windows have seen maximum adverse excursions against the short as deep as about 17.56%, so a sharp rally early in the period would not automatically invalidate the pattern but would signal that this iteration is tracking one of the more volatile historical years. If, instead, the stock drifts lower with contained upside spikes, it would look more like the stronger short-side samples such as 2002 and 2010.
Finally, positioning into the transition from the midterm election year to the pre-election year will be key. If Gartner remains under pressure through this window while fundamentals stabilize, value-focused investors who have been tracking the name since the March 2026 valuation debate may see a more attractive entry point as the calendar shifts into a historically stronger phase for risk assets.[1] If the stock shrugs off the seasonal headwind and pushes higher, it would signal that AI-driven demand and contract renewals are overpowering the usual midterm-year pattern, and traders would need to recalibrate how much weight to give this specific window in future cycles.
Sources
About this seasonal analysis
Seasonal pattern data is sourced from TradeWave.ai, which analyzes historical price behavior across annual calendar windows going back up to 30 years. Read the full data methodology or the book The 100-Year Pattern by Afshin Moshrefi (2026 edition). Past performance of seasonal patterns does not guarantee future results. This article is for informational purposes only and does not constitute investment advice.