Illinois Tool Works (ITW) Has Dropped in 10 of 10 Midterm Summers as 52-Day Window Opens
Illinois Tool Works is heading into a 52-day midterm-year seasonal window that has been consistently weak, even as the stock trades higher and industrial tailwinds build.
What is the seasonal pattern for Illinois Tool Works (ITW)?
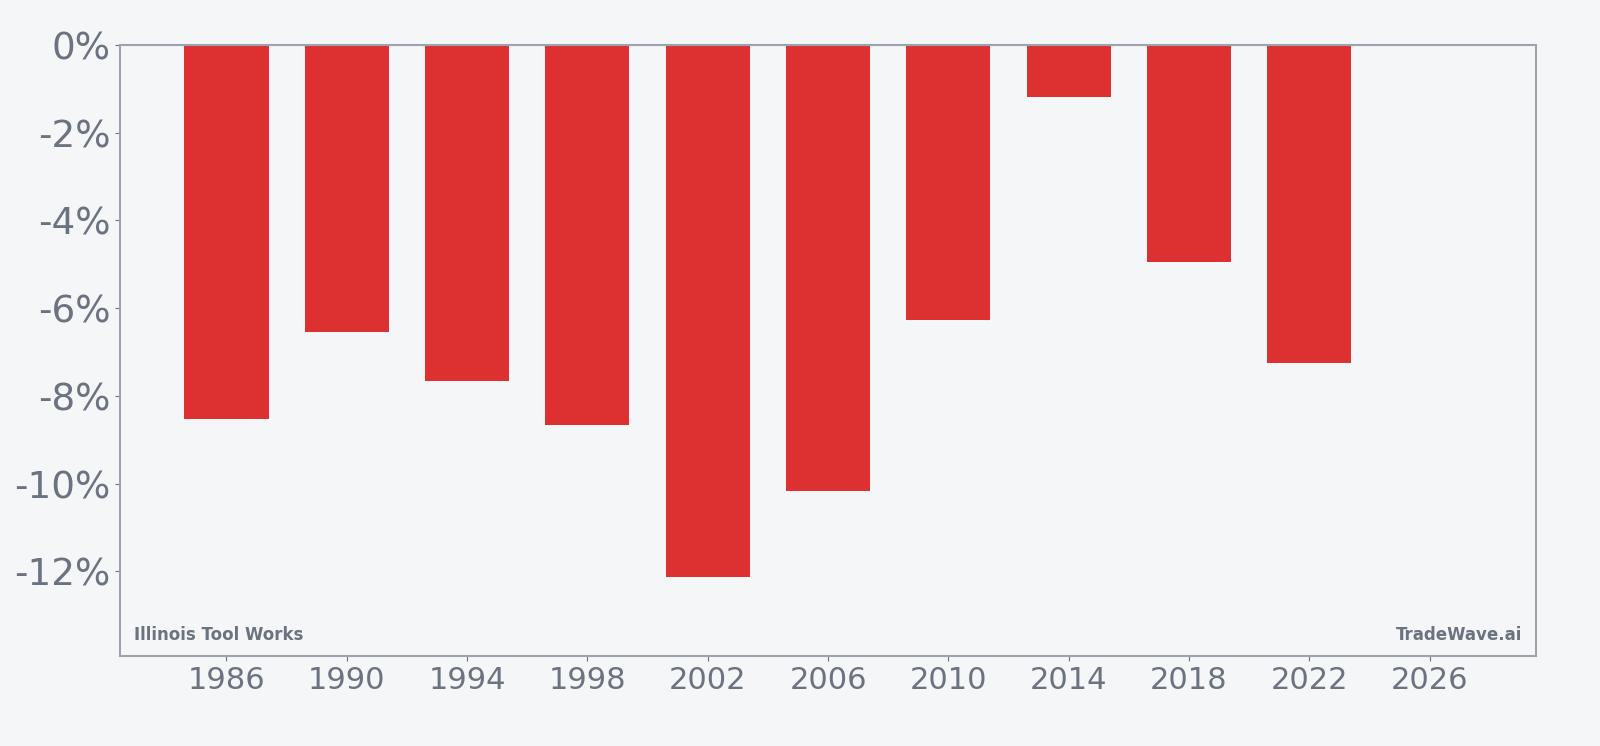
Illinois Tool Works has fallen in 10 of 10 midterm-year summer windows during this 52-day stretch, with an average gain of 7.33% in winning years for the short side.
- 10 for 10 in this window, with the short side averaging 7.33% gains across the last 10 midterm election years.
- Seasonal window starts Jun 3 and runs 52 trading days, covering the heart of the midterm-year summer for ITW.
- Percent Profitable is 100%, with 10 winners and 0 losers for the short trade direction in this pattern.
- Average winner delivers a 7.33% move in favor of the short, while the median outcome is a 7.44% decline in the stock over the window.
- Intraperiod swings have been meaningful, with historical best and worst excursions showing that rallies and drawdowns can both be sharp before the trade resolves lower.
- TradeWave Ratio of 2.18 and a Sharpe ratio of 2.28 point to a historically efficient short window compared with typical noise.
According to historical data from TradeWave.ai, this midterm-year summer stretch has behaved very differently from an average month on the calendar for Illinois Tool Works. The next section walks through how that pattern has played out and why it matters for the coming weeks.
How has Illinois Tool Works (ITW) traded in past midterm-year summer windows?
Illinois Tool Works has declined in every one of the last 10 midterm election years during this 52-day window, with the short side averaging a 7.33% gain. The upcoming stretch begins on Jun 3, just as ITW trades around $247.28 and sits roughly 17.4% below its 52-week high of about $299.36 while still up about 24% year to date. That mix of a strong year-to-date rally and a historically weak midterm-year summer window sets up a clean test of whether the ITW seasonal trend still bites when the stock is already extended.
Because this pattern is grouped by the presidential election cycle, it only looks at the last 10 midterm election years, not 10 consecutive calendar years. That matters for industrials like Illinois Tool Works, where spending on infrastructure, aerospace and defense, and capital equipment often tracks the policy and budget rhythm that tends to shift in the middle of a presidential term.
A stacked view of net returns alongside best and worst intraperiod moves shows how far ITW has typically swung before resolving lower.
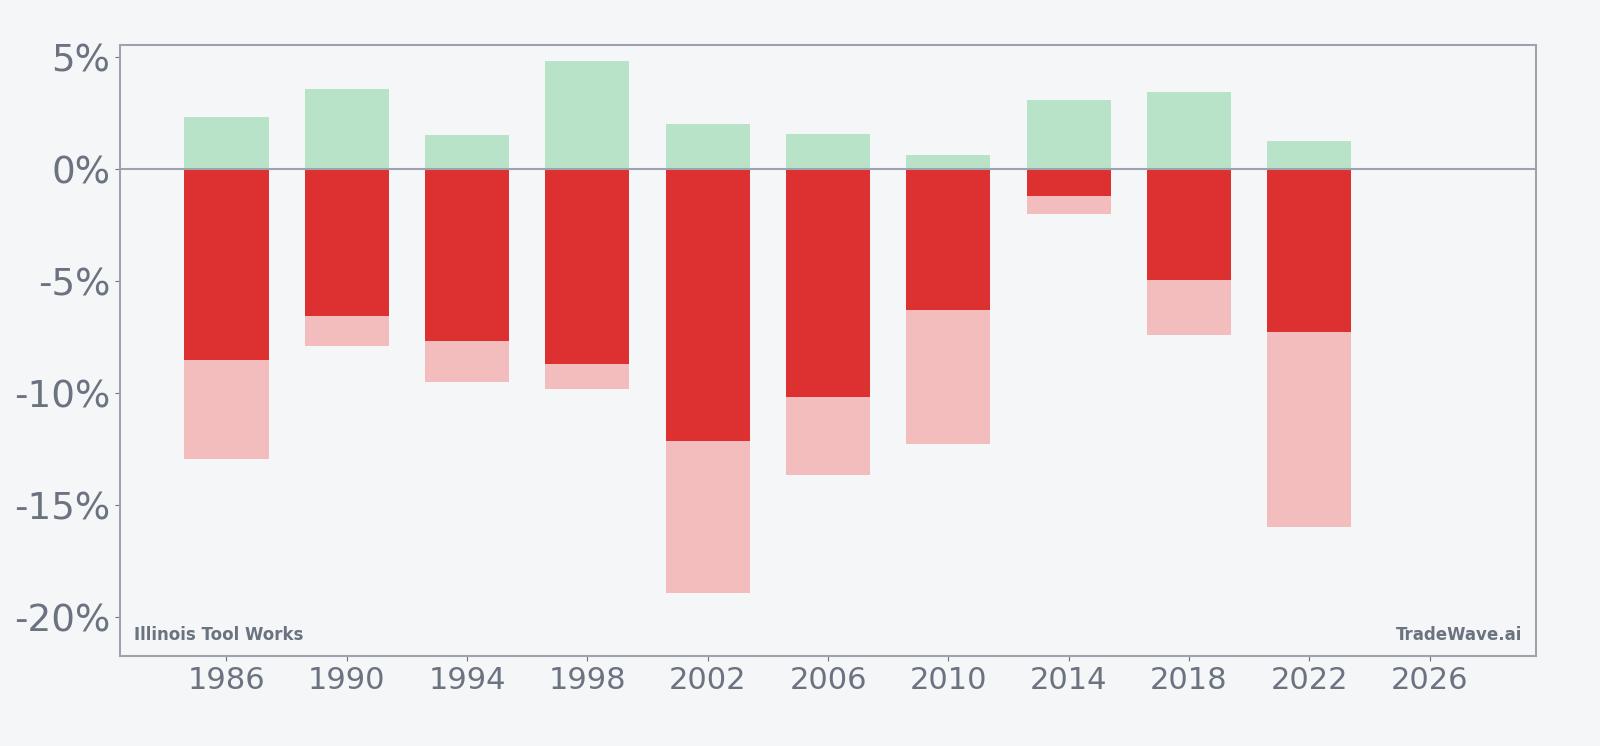
Across the 10 midterm-year samples, every single window has ended with ITW lower, which is why the short trade direction shows a 100% win rate and a 102% cumulative return. Average profit of 7.33% and a Sharpe ratio of 2.28 point to a pattern that has historically delivered consistent downside for the stock rather than a few outlier crashes. At the same time, the maximum favorable and maximum adverse excursions show that ITW has often bounced a few percent against the short before rolling over, and in some years the worst drawdown from entry has been in the low to mid-teens, underscoring that the path has not been a straight line.
Looking at individual years, 2002 stands out as one of the strongest short windows, with the stock dropping about 12.12% over the period and experiencing an intraperiod drawdown of roughly 18.91% from the entry before the trade closed. On the milder side, 2014 still finished as a winner for the short, but the net move was only about 1.19% lower, with a relatively shallow worst drawdown of around 1.98%. Add it up and the pattern has been remarkably consistent in direction, but the magnitude and timing of the move have varied, which is exactly what the TradeWave Ratio of 2.18 is designed to capture: how far price typically travels in the trade direction within the window, independent of the final close.
The cumulative return profile across these midterm-year windows slopes steadily in favor of the short side rather than relying on one or two big years. The historical seasonal trend chart shows that, on average, most of the downside has tended to accrue over the middle of the 52-day stretch, with some years front-loading the weakness and others seeing a late slide as the window closes. For traders, that means the Illinois Tool Works seasonal trend has not been about a single event day, but about a multi-week drift lower that has repeated across very different macro backdrops.
History does not guarantee future results; adverse excursions can be large even in winning windows, and Illinois Tool Works has shown it can rally several percent against the short before the seasonal pattern reasserts itself.
Why does Illinois Tool Works (ITW) follow this seasonal pattern?
One likely driver is the way industrial spending and aerospace and defense budgets line up with the midterm-year policy calendar, which can leave order books and guidance under extra scrutiny in early summer. Analysts have also pointed to institutional portfolio repositioning around midyear, when managers reassess exposure to cyclical industrials after the first half of the presidential term. For a diversified manufacturer like Illinois Tool Works, that combination of policy noise, budget timing, and portfolio rotation may help explain why this specific midterm-year summer window has so often leaned lower.
What is driving Illinois Tool Works (ITW) today?
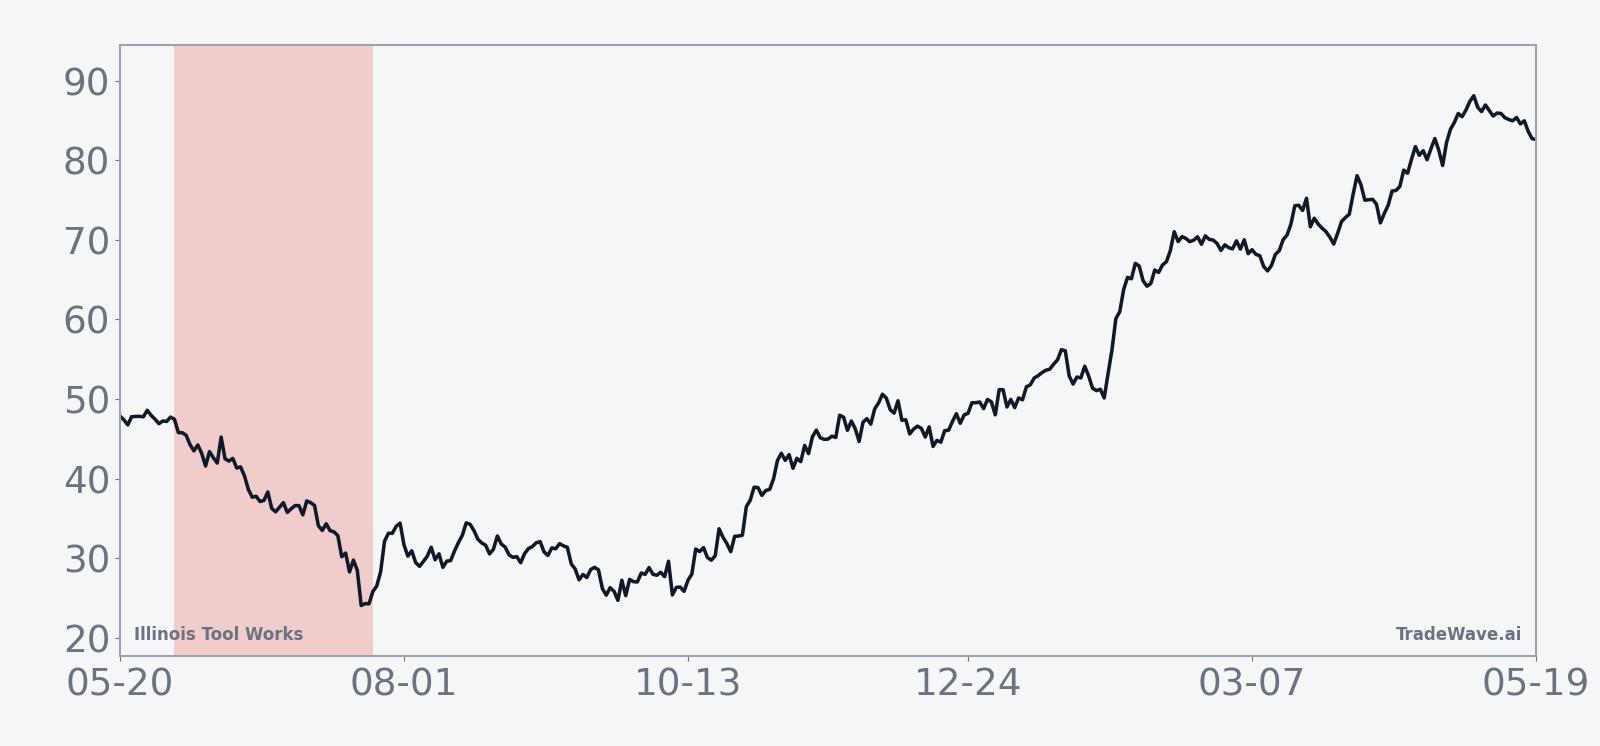
Illinois Tool Works shares closed Monday at $247.28, down about 0.9% on the day, leaving the stock roughly 17.4% below its 52-week high near $299.36 and still up about 24% year to date. The move comes against a constructive backdrop for industrials tied to aerospace and defense, where analysts have highlighted ongoing military funding in Europe and rising drone operations as tailwinds for longer-cycle businesses that resemble parts of ITW’s portfolio, including exposure to power and infrastructure spending.[1]
The chart below situates the latest pullback in the context of ITW’s past year of trading and the upcoming seasonal projection.
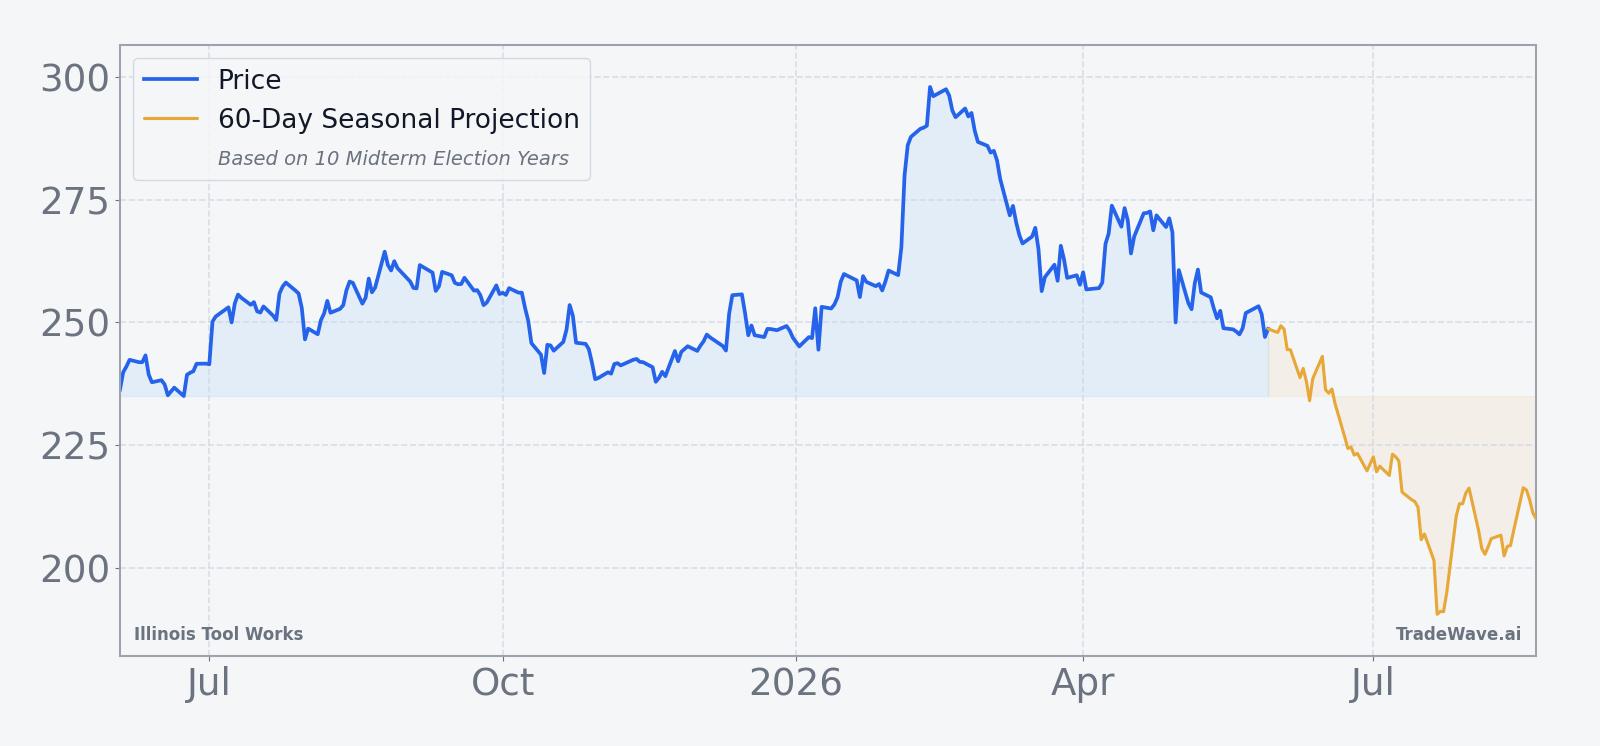
From a sector standpoint, Illinois Tool Works sits at the intersection of industrial, aerospace and defense, and power-generation themes that have drawn renewed attention as governments lean on infrastructure and security spending.[1] That macro tailwind helps explain the strong year-to-date performance, but it also raises the stakes for the upcoming seasonal window: if the stock shrugs off a historically weak stretch despite rich gains and elevated expectations, it would signal that the current cycle is overpowering the usual midterm-year pattern.
What should traders watch as this Illinois Tool Works (ITW) window opens?
First, watch how ITW behaves as the 52-day window kicks off on Jun 3: a quick slide that lines up with the historical pattern would confirm that the midterm-year seasonal trend is still in play, while a firm or rising tape would mark a clear break from the last 10 cycles. Second, monitor the stock’s behavior around any updates on aerospace and defense demand or infrastructure spending, since stronger-than-expected commentary could blunt the usual midterm-year softness even if the seasonal template points lower.[1] Third, keep an eye on the depth of any intraperiod rallies and pullbacks: if maximum adverse moves against the short stay shallow compared with prior years, it would suggest a more controlled drift, while deeper swings would echo the high-variance years like 2002 and 2022. Finally, traders will be watching whether ITW’s price action during this window tracks the historical seasonal trend chart or diverges sharply, which would offer an early read on how much weight to give this specific Illinois Tool Works trading window in future midterm election years.
Sources
About this seasonal analysis
Seasonal pattern data is sourced from TradeWave.ai, which analyzes historical price behavior across annual calendar windows going back up to 30 years. Read the full data methodology or the book The 100-Year Pattern by Afshin Moshrefi (2026 edition). Past performance of seasonal patterns does not guarantee future results. This article is for informational purposes only and does not constitute investment advice.