9-of-10 Win Streak: CenterPoint Energy (CNP) Enters Bullish 12-Day Midterm May Window
CenterPoint Energy is heading into a historically strong 12-day midterm-year May window just below its 52-week high, as investors digest earnings, guidance and a massive capex plan.
What is the seasonal pattern for CenterPoint Energy (CNP)?
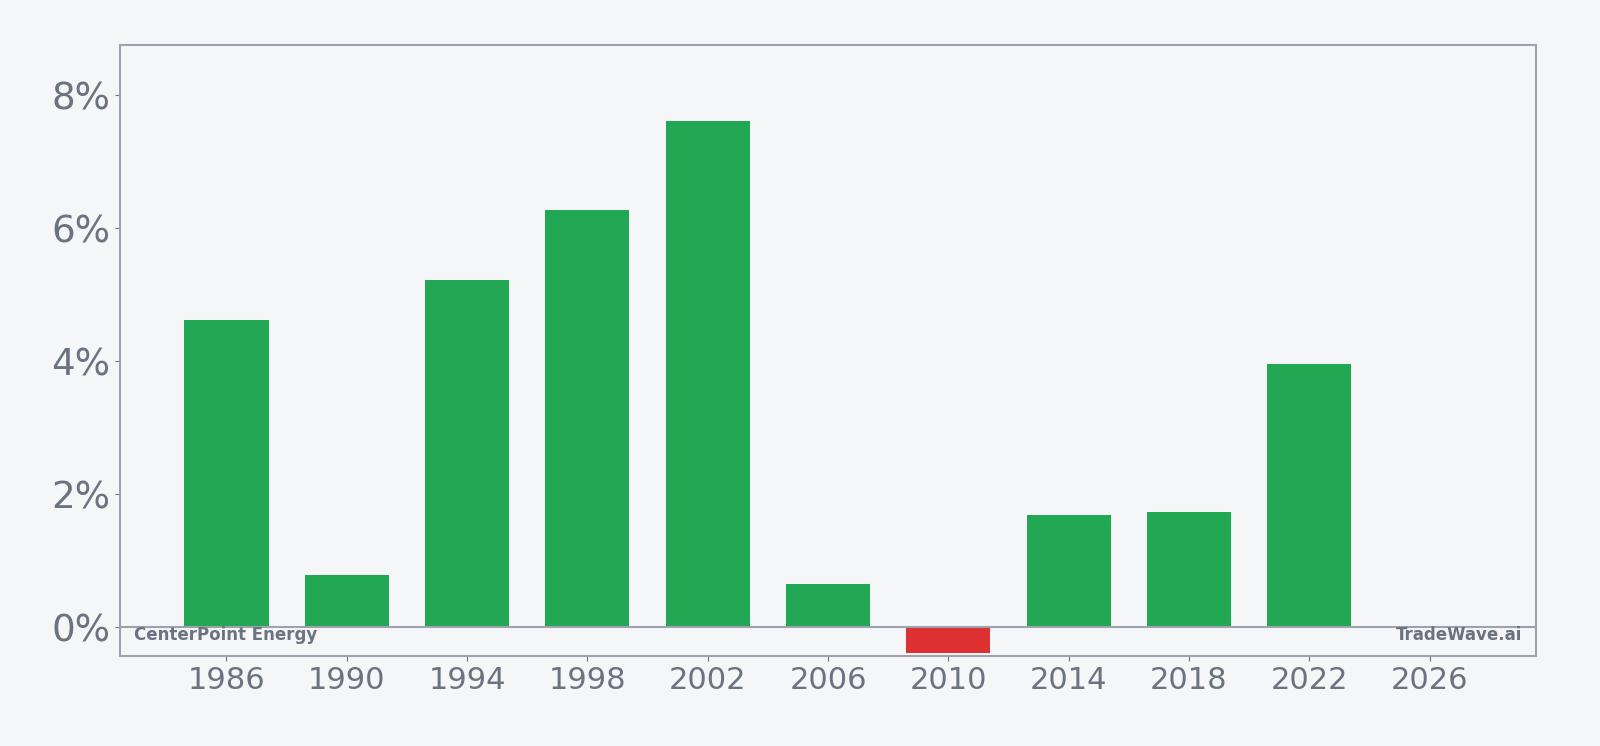
CenterPoint Energy has risen in 9 of 10 midterm-year May windows during this 12-day stretch, with an average gain of 3.62% in winning years.
- 9 for 10 in this window, with winning years averaging 3.62% gains over the 12 trading days.
- The upcoming seasonal window runs from May 21, 2026 and spans 12 trading days in midterm election years.
- Percent Profitable sits at 90%, with 9 winners and just 1 loser across the last 10 midterm election cycles.
- Including all years, the average outcome is a 3% gain, reflecting only modest drag from the lone losing year.
- Intraperiod swings have featured strong upside bursts in some years alongside occasional drawdowns, making risk management important even in a bullish pattern.
- The pattern aligns with a long trade direction, fitting a utilities seasonal outlook that has often strengthened into late May of midterm years.
According to historical data from TradeWave.ai, this late-May stretch for CenterPoint Energy behaves differently from an average month on the calendar, especially in midterm election years.
How has CenterPoint Energy (CNP) traded in this late-May midterm window?
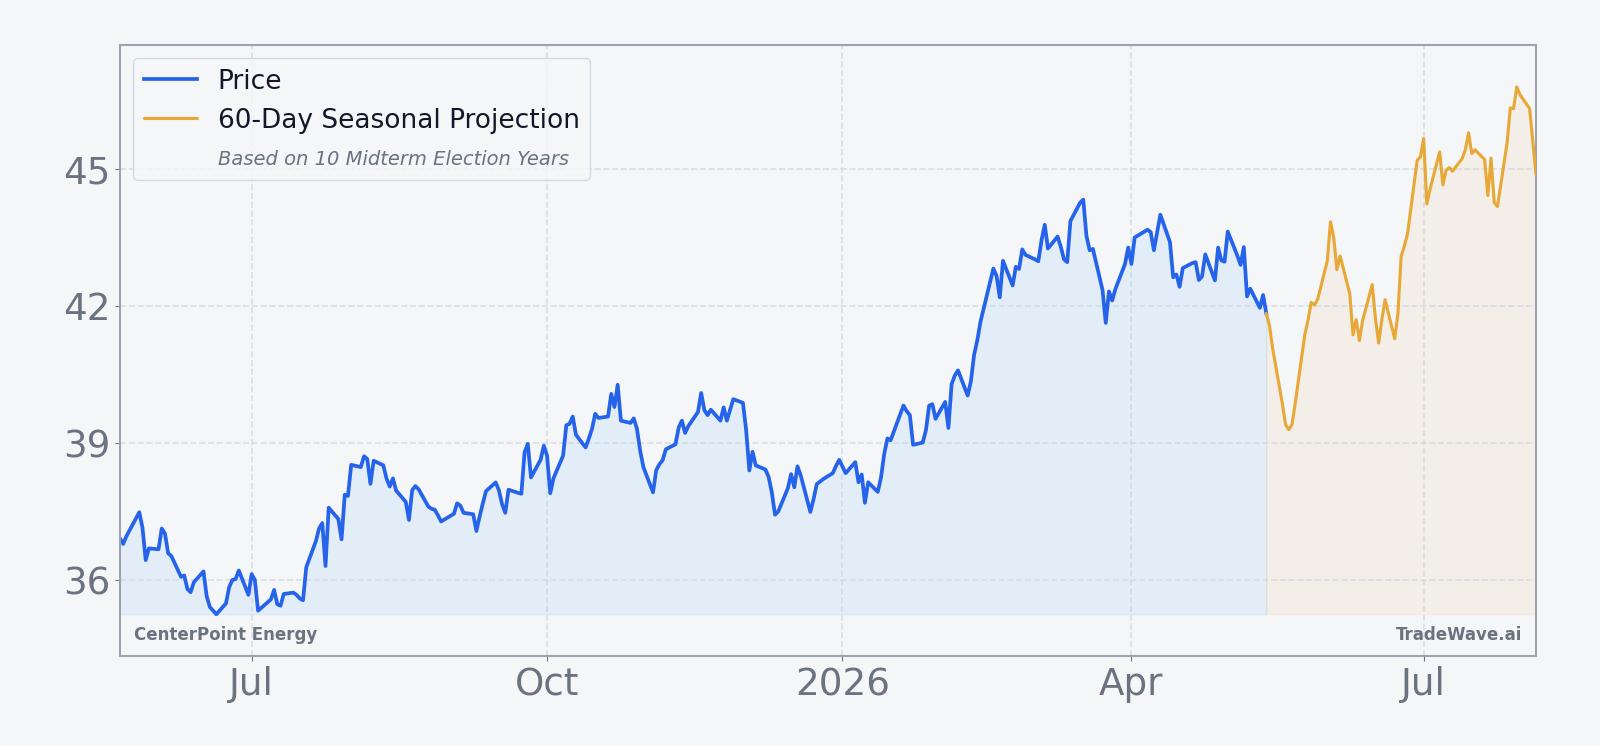
CenterPoint Energy has rallied in 9 of the last 10 midterm election years during the 12 trading days starting May 21, averaging 3.62% gains in the winning runs. Shares last closed at 42.395, up 0.63% on the day and about 4.7% below the 52-week high of 44.465.[1]
Grouping the data by the presidential election cycle matters here because utilities often respond to shifting policy and rate expectations, and midterm years have historically been a distinct mid-cycle phase for regulation and infrastructure spending. In this case, the pattern looks only at the last 10 midterm election years, so each data point reflects how CNP traded in that specific political and policy backdrop rather than in a generic May.
This seasonal window begins on May 21, 2026 and spans 12 trading days. Historically, during this period, CenterPoint Energy has shown a strong bullish tendency for long trades, with a 90% win rate and a 3% average gain when all years are included. The trade direction is explicitly long, so the favorable years are the ones where the stock climbed over the window, while the single losing year in 2010 saw a small 0.38% decline.
The strongest historical run came in 2002, when CNP gained 7.62% over the window and at one point was up 18.54% from the entry level before giving back some of that move by the close. The softest outcome was 2010, which still saw a maximum favorable move of 3.6% at one point but ultimately finished down 0.38%, showing how intraperiod rallies can fade before the window ends.
The historical seasonal trend chart for this window shows a steady upward bias rather than a single explosive day. On average, gains have tended to build across the full 12-day stretch, with several years like 1994 and 1998 posting smooth climbs and limited downside, while others such as 2006 and 2010 were choppier and featured deeper dips before recovering.
Year-by-year bars with maximum favorable and adverse moves show how often rallies have come with manageable drawdowns.
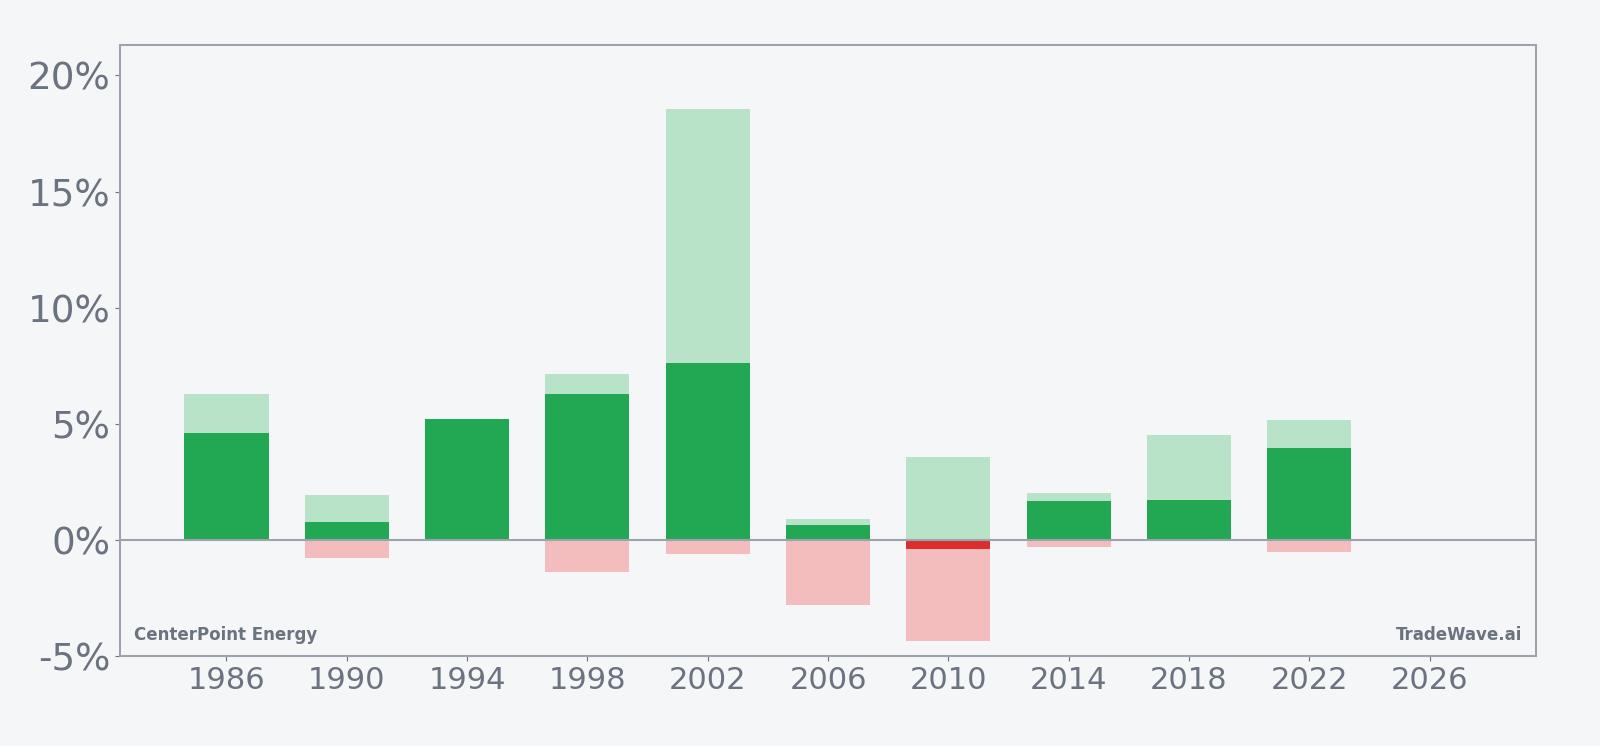
The stacked net, maximum favorable excursion and maximum adverse excursion bars show that in most years, upside spikes have outweighed downside dips. Years like 2002 and 1998 saw large peak run-ups with relatively contained drawdowns, while 2006 and 2010 remind traders that even a bullish CNP seasonal trend can include intraperiod pullbacks of 2% to 4% before the final result is known. The TradeWave Ratio of 1.09 suggests that price has typically traveled meaningfully in the trade direction within the window, not just drifted sideways.
The cumulative return profile across all 10 midterm years adds up to a 36% gain for this specific 12-day slice of the calendar, which is a notable contribution for such a short window. Nine for ten with positive average outcomes is a clean record, and it is that consistency, rather than any single blockbuster year, that stands out.
History does not guarantee future results; adverse excursions (MAE) can be large even in winning windows.
Why does CenterPoint Energy (CNP) follow this seasonal pattern?
This pattern may reflect how utilities stocks trade around midterm-year policy and rate expectations, with investors repositioning into regulated names as fiscal and regulatory agendas become clearer. One likely driver is the clustering of capital spending updates and infrastructure headlines in late spring, which can focus attention on grid and transmission plays like CenterPoint. Analysts have also pointed to sector rotation out of higher-beta growth into defensive yield names during parts of the midterm year, which can amplify a utilities seasonal trend in windows like this one.
What is driving CenterPoint Energy (CNP) today?
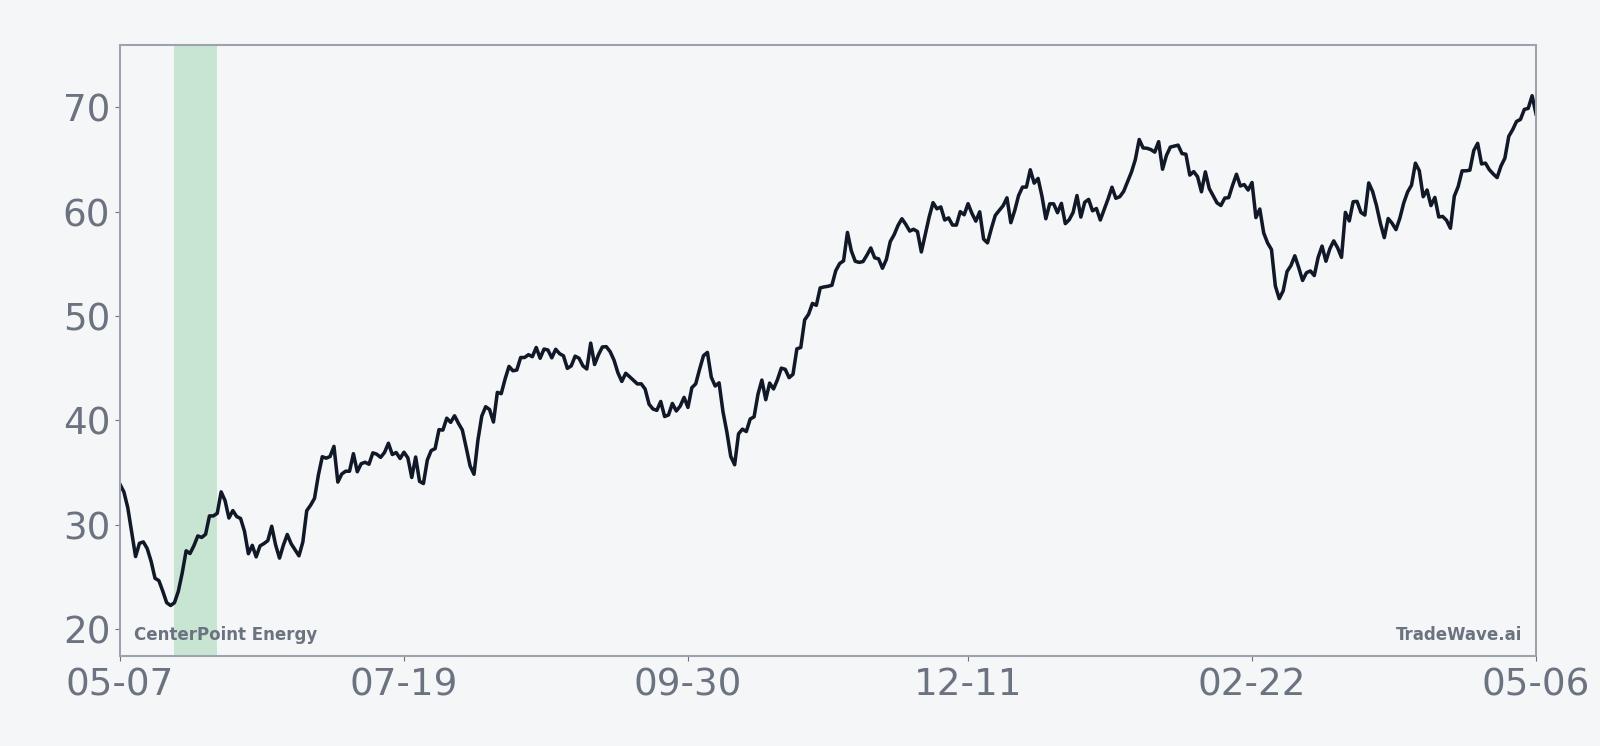
CenterPoint Energy closed at 42.395 on May 13, up 0.63% on the session, with the stock roughly 4.7% below its 52-week high of 44.465 and comfortably above the 52-week low of about 34.67.[1] The move comes after the company reported Q1 2026 earnings of $0.48 per diluted share on a GAAP basis and $0.56 on a non-GAAP basis on Apr 23, alongside full-year 2026 EPS guidance of $1.89 to $1.91, which keeps the regulated utility on a steady growth track.[3][6]
Analysts tracked by MarketBeat currently rate the stock a Hold, with a consensus price target of $44.15 that sits modestly above the latest close and frames expectations for mid-single-digit upside from here.[2] On Apr 25, Wall Street Zen cut its rating on CenterPoint from Hold to Sell, a shift that could cap near-term enthusiasm even as the stock trades near the upper end of its one-year range.[1] Institutional interest remains engaged, with Jennison Associates recently increasing its position in the name, signaling that some large investors are willing to look through short-term rating noise to the longer-term regulated earnings and capex story.[5]
That longer-term story is capital intensive. In Sep 2025, CenterPoint outlined a $65 billion capital spending plan from 2026 through 2035 to meet rising electric demand, particularly in Texas, where AI data centers and industrial growth are driving power needs higher.[9][12] The plan ties the stock tightly to the broader power demand growth theme, where utilities and energy infrastructure names are being asked to fund and build out capacity for a more electrified, AI-heavy economy.[12]
The chart below situates the latest move in its recent multi-month context and overlays the upcoming seasonal projection.
What should traders watch as this CenterPoint Energy seasonal window approaches?
First, the calendar. The 12-day window starting May 21 lands in the middle of the midterm election year, a phase where utilities have often benefited from clearer policy direction and a bid for defensive yield. For CenterPoint, that means traders will be watching whether the stock can build on its current position near the top of its range or whether the recent Hold consensus and one high-profile Sell call keep it capped.[1][2]
Second, levels. The 52-week high around 44.47 is the obvious upside reference, while the 50-day moving average near 42.98 provides a nearby gauge of trend support.[1] A push through the high during the window would line up with the historical CNP seasonal trend, which has favored longs in 9 of 10 midterm years. A failure to hold the 50-day line, especially if accompanied by heavier-than-normal volume against the backdrop of that bullish history, would be a clear sign that this cycle is diverging from the pattern.
Third, macro and policy headlines. Any updates on rate expectations, grid regulation or infrastructure funding could matter more than usual for a regulated utility that has committed to $65 billion of capex over the next decade.[9][12] Positive signals on allowed returns or demand growth could reinforce the historical upside bias in this CenterPoint Energy trading window, while tougher regulatory rhetoric or concerns about cost recovery would cut the other way.
Finally, behavior inside the window itself will be the tell. If CNP starts the period with early strength and shallow intraday dips, it would echo the stronger historical years like 1994 and 1998. A choppy tape with deeper pullbacks, more in line with 2006 or 2010, would not break the pattern on its own but would remind traders that even a 90% win-rate seasonal setup can involve uncomfortable drawdowns before the final outcome is known. Add it up, and this is a short, well-defined slice of the calendar where CenterPoint’s price action will say a lot about whether the midterm-year seasonal script is still in play.
Sources
- [1] MarketBeat, "CenterPoint Energy (NYSE:CNP) Rating Lowered to Sell at Wall Street Zen", Apr 23, 2026.
- [2] MarketBeat, "CenterPoint Energy, Inc. (NYSE:CNP) Given Consensus Recommendation of \"Hold\" by Analysts", Apr 23, 2026.
- [3] MarketBeat, "CenterPoint Energy Q1 Earnings Call Highlights", Apr 23, 2026.
- [4] Public.com, "CenterPoint Energy (CNP) Stock Forecast: Analyst Ratings, Predictions & Price Target 2026", Feb 1, 2025.
- [5] MarketBeat, "Jennison Associates LLC Increases Position in CenterPoint Energy, Inc. $CNP", Apr 30, 2026.
- [6] MarketBeat, "CenterPoint Energy (NYSE:CNP) Issues FY 2026 Earnings Guidance", Apr 23, 2026.
- [7] MarketBeat, "CNP News Today | Why did CenterPoint Energy stock go up today? $CNP", Jun 18, 2018.
- [8] Seeking Alpha, "Palantir teams up with Nvidia, CenterPoint Energy to speed AI infrastructure buildout", Dec 4, 2025.
- [9] Reuters, "CenterPoint unveils $65 billion capital spending plan over next 10 years", Sep 29, 2025.
- [12] Reuters, "Power Demand Growth and Utilities and Energy sector context for CenterPoint Energy", Sep 29, 2025.
About this seasonal analysis
Seasonal pattern data is sourced from TradeWave.ai, which analyzes historical price behavior across annual calendar windows going back up to 30 years. Read the full data methodology or the book The 100-Year Pattern by Afshin Moshrefi (2026 edition). Past performance of seasonal patterns does not guarantee future results. This article is for informational purposes only and does not constitute investment advice.