8-for-8: Gen Digital (GEN) Has Fallen in Every 33-Day Midterm Window Starting May 15
Gen Digital is set to enter a 33-day midterm-election seasonal window that has rewarded shorts in every prior cycle, just as the stock trades well below its 52-week high after an earnings beat.

What is the seasonal pattern for Gen Digital (GEN)?
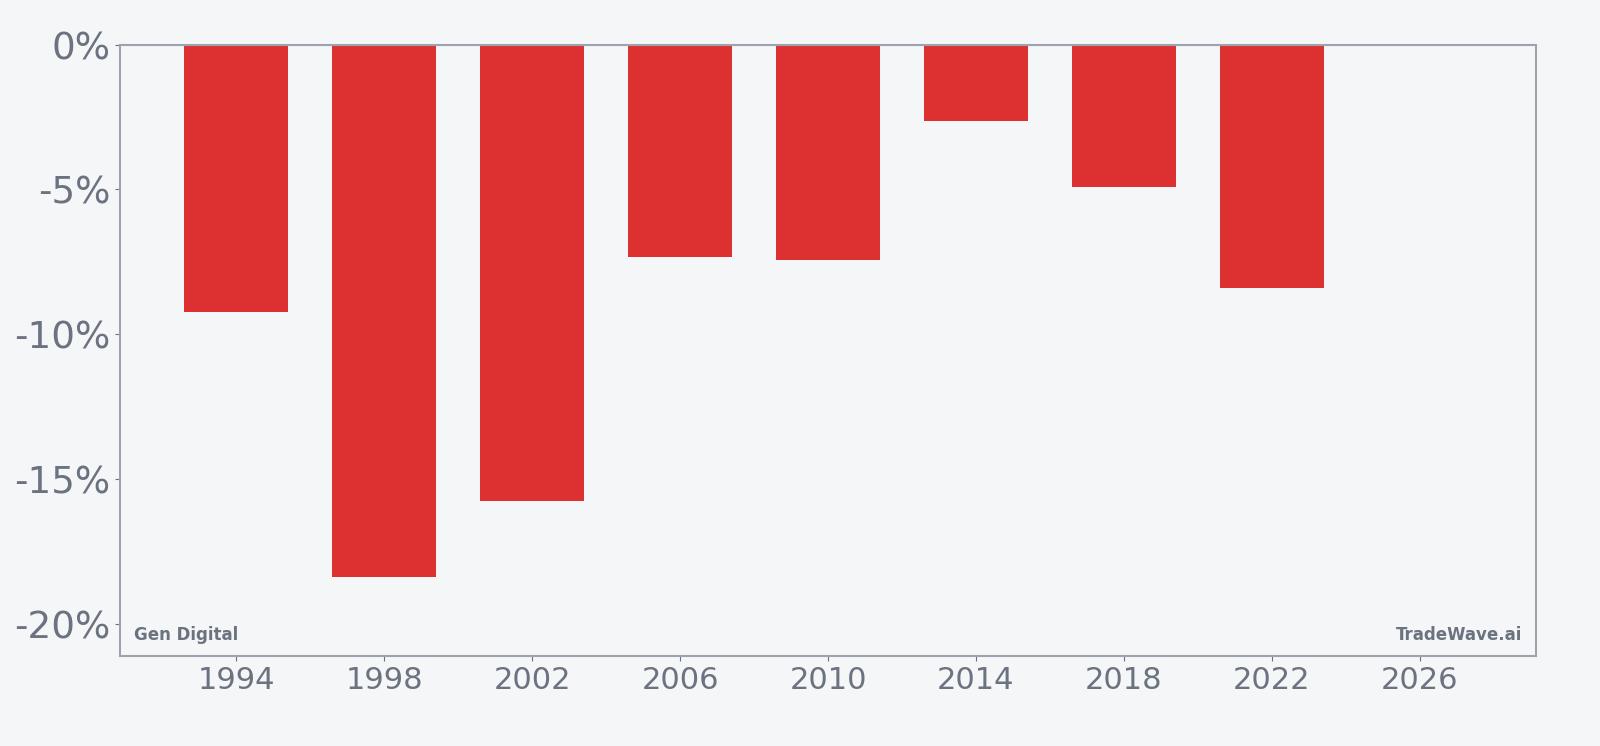
Gen Digital has fallen in 8 of 8 midterm-election-year windows starting May 15, with an average gain of 9.26% in winning years for short positions.
- 8 for 8 in this window, with short trades averaging 9.26% gains in winning years across the last eight midterm election cycles.
- The 33-day Gen Digital trading window begins May 15 and has historically favored downside moves for the stock.
- Percent Profitable is 100%, with 8 winners and 0 losers for the short-side pattern in this specific midterm-year slice.
- Avg Profit of 9.26% reflects the typical net move in years when the short pattern worked, with no offset from losing years in this sample.
- The TradeWave Ratio of 1.72 signals that price has typically traveled meaningfully in the trade direction within the window, while the Sharpe ratio of 1.68 points to strong risk-adjusted results.
- Intraperiod swings have included double-digit adverse moves in some years, so shorts have historically faced real drawdown risk even in an all-winner sample.
According to historical data from TradeWave.ai, this midterm-election window for Gen Digital has behaved very differently from an average month on the calendar, and the next iteration starts today.
How has Gen Digital (GEN) traded in this midterm-year May–June window?
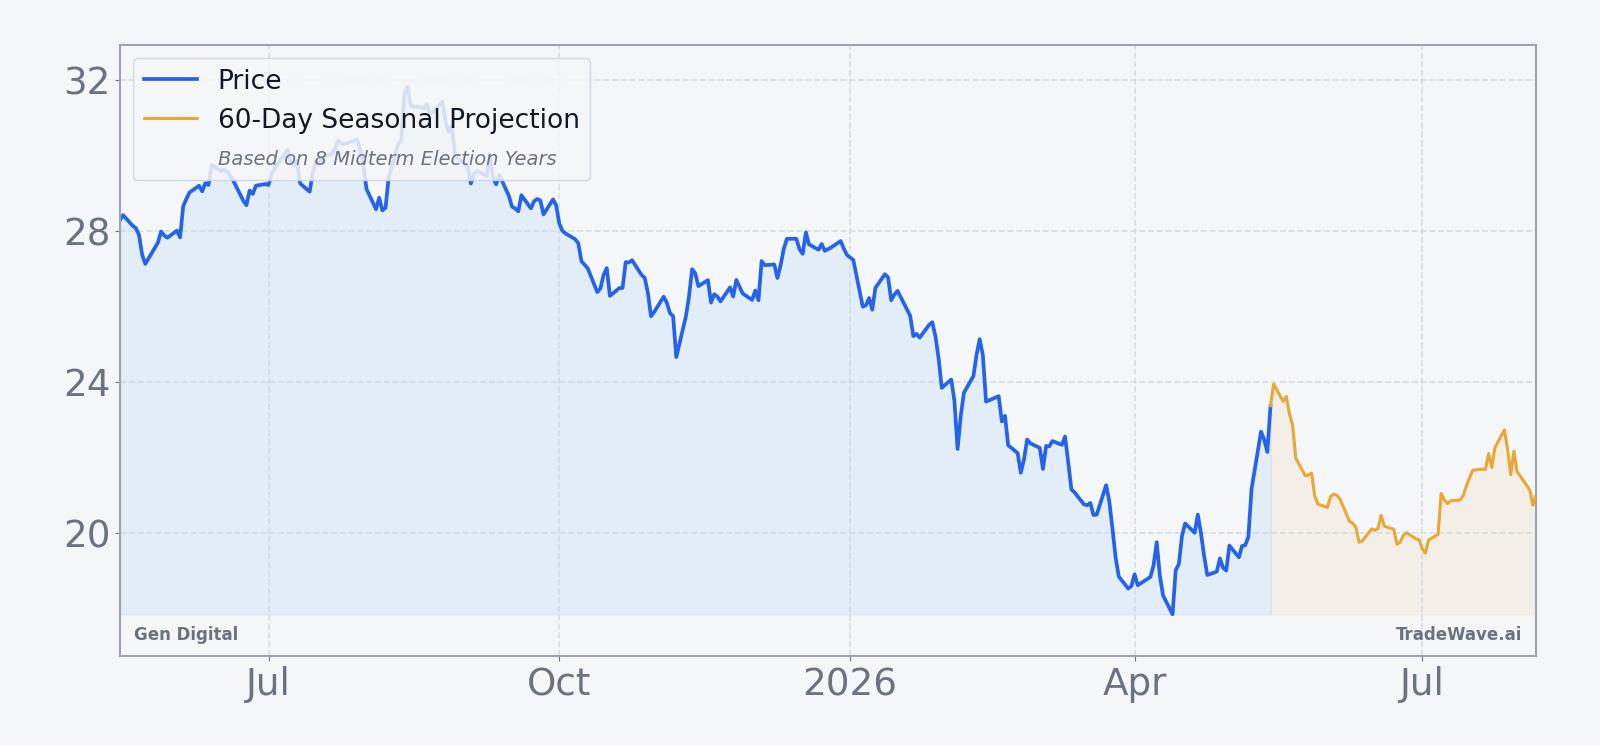
Gen Digital has delivered profitable short-side trades in all eight midterm-election-year windows that start on May 15 and run for 33 trading days, averaging 9.26% gains for bears. Shares finished Thursday at 23.225, leaving the stock about 26.7% below its 52-week high of 31.66 and roughly 30.6% above its 52-week low of 17.78.[1]
Grouping the data by the presidential election cycle matters here because midterm years often bring regulatory noise, budget fights and shifting risk appetite that hit individual tech names differently than broad-market averages. For Gen Digital, the last eight midterm-election years have produced a consistent pattern of weakness in this late-spring slice, even when the broader software sector was not uniformly under pressure.
Across the eight midterm-election years in this sample, every single iteration of the May 15 window has ended with Gen Digital lower, which is favorable for the short trade direction. The weakest year for the stock in this pattern was 1998, when the window produced an 18.38% decline, while the mildest drop was 2.64% in 2014. Even the more modest years still finished in the red, which is why the Percent Profitable metric sits at 100% with 8 winners and 0 losers for shorts.
The average 9.26% profit figure describes the typical net move in those winning short years, not a cherry-picked best case. Because there are no losing years in the sample, the all-years average lines up with that same 9% neighborhood, and the Sharpe ratio of 1.68 signals that the risk-adjusted profile has been unusually strong for a 33-day stock pattern. For traders who track GEN seasonal trends, this is one of the cleaner short-biased windows on the calendar.
The historical seasonal average curve for this window slopes steadily lower, with much of the damage typically occurring in the middle third of the 33-day span. Early days have sometimes been choppy, but the pattern has tended to grind against longs as the window progresses, which aligns with the short-side trade direction.
A closer look at yearly net returns and intraperiod swings shows how often downside has persisted and how large drawdowns have been along the way.
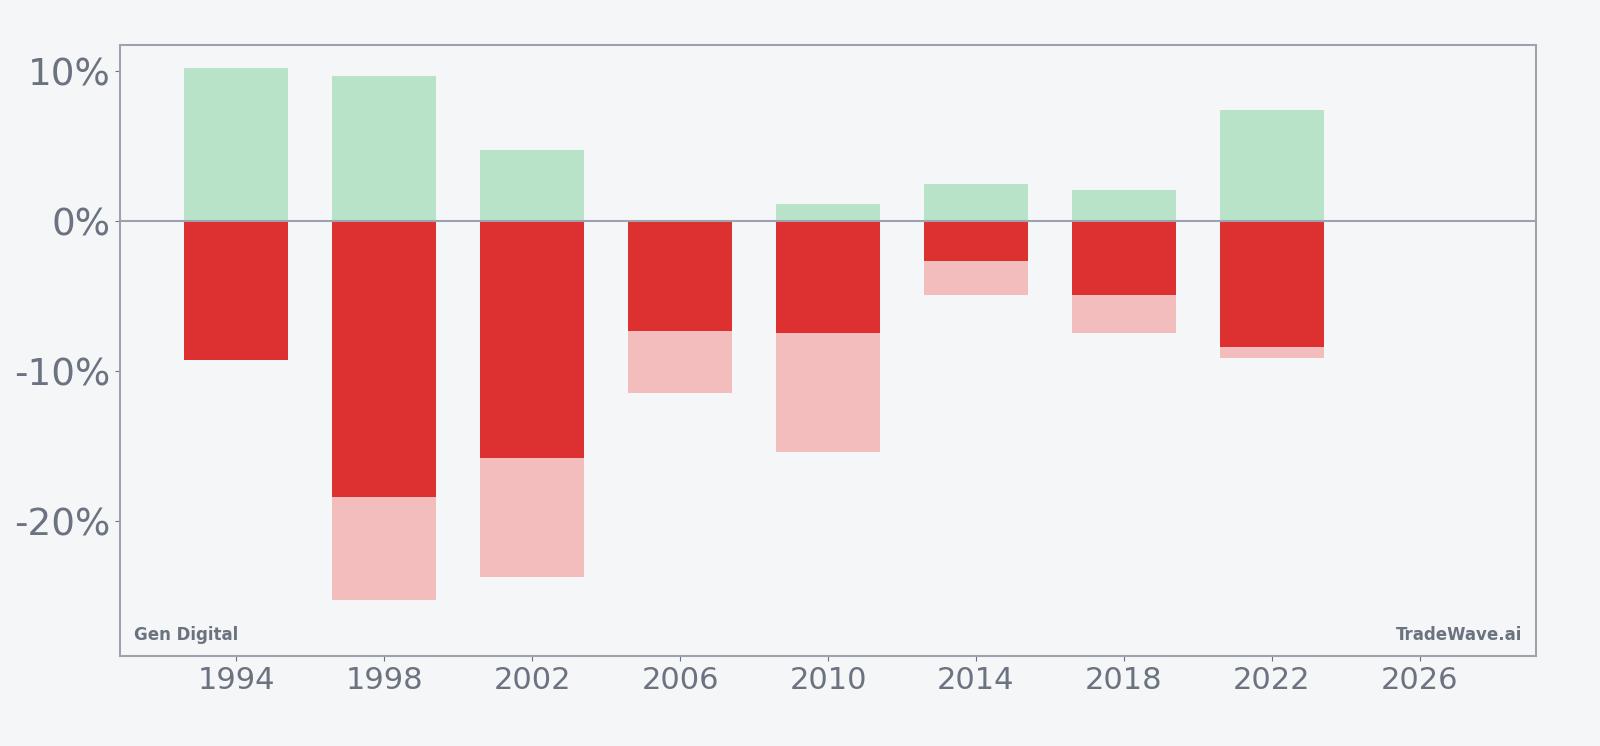
Year-by-year bars show that in strong short years like 1998 and 2002, Gen Digital not only finished sharply lower but also saw maximum favorable moves for shorts that exceeded 9%, while maximum adverse excursions for shorts reached as deep as 25.21% in 1998. In softer years such as 2014 and 2018, both the best-case and worst-case intraperiod swings were smaller, but shorts still had to sit through several percentage points of adverse movement before the pattern resolved lower. Add it up: eight straight midterm-election windows have rewarded patience on the short side, but they have rarely been smooth rides.
History does not guarantee future results, and even in an all-winner sample like this, adverse excursions within the window have sometimes been large.
Why does Gen Digital (GEN) follow this seasonal pattern?
One likely driver is the way midterm-election years cluster regulatory headlines and budget debates that can weigh on cybersecurity and consumer software names just as investors reassess risk into summer. Analysts also point to the timing of Gen Digital’s fiscal year-end and guidance cycle, which can leave the stock vulnerable to profit-taking after spring earnings in years when expectations have run ahead of fundamentals. This pattern may also reflect broader sector rotation, as money often shifts toward cyclicals and away from defensive tech in the middle of the presidential cycle.
What is driving Gen Digital (GEN) today?
Gen Digital shares last traded at 23.18 on Friday, down 0.3% on the day, after a strong one-month run of 17.19% that has carried the stock off its 52-week low but still left it well below the 31.66 high set over the past year.[1] The stock is trading above its 50-day moving average of 20.13 and has seen recent volume of about 4.9 million shares, versus a 20-day average of roughly 7.6 million, suggesting the post-earnings surge is consolidating rather than accelerating.[1]
On May 8, Gen Digital reported fiscal fourth-quarter adjusted earnings and revenue that topped Wall Street estimates and paired the beat with revenue guidance ahead of analyst expectations, sparking a roughly 6% jump in the stock.[1] That upbeat report helped reset sentiment after a choppy stretch for many software names, and it gives bulls a fundamental story to lean on as the stock heads into a historically tricky late-spring trading window.
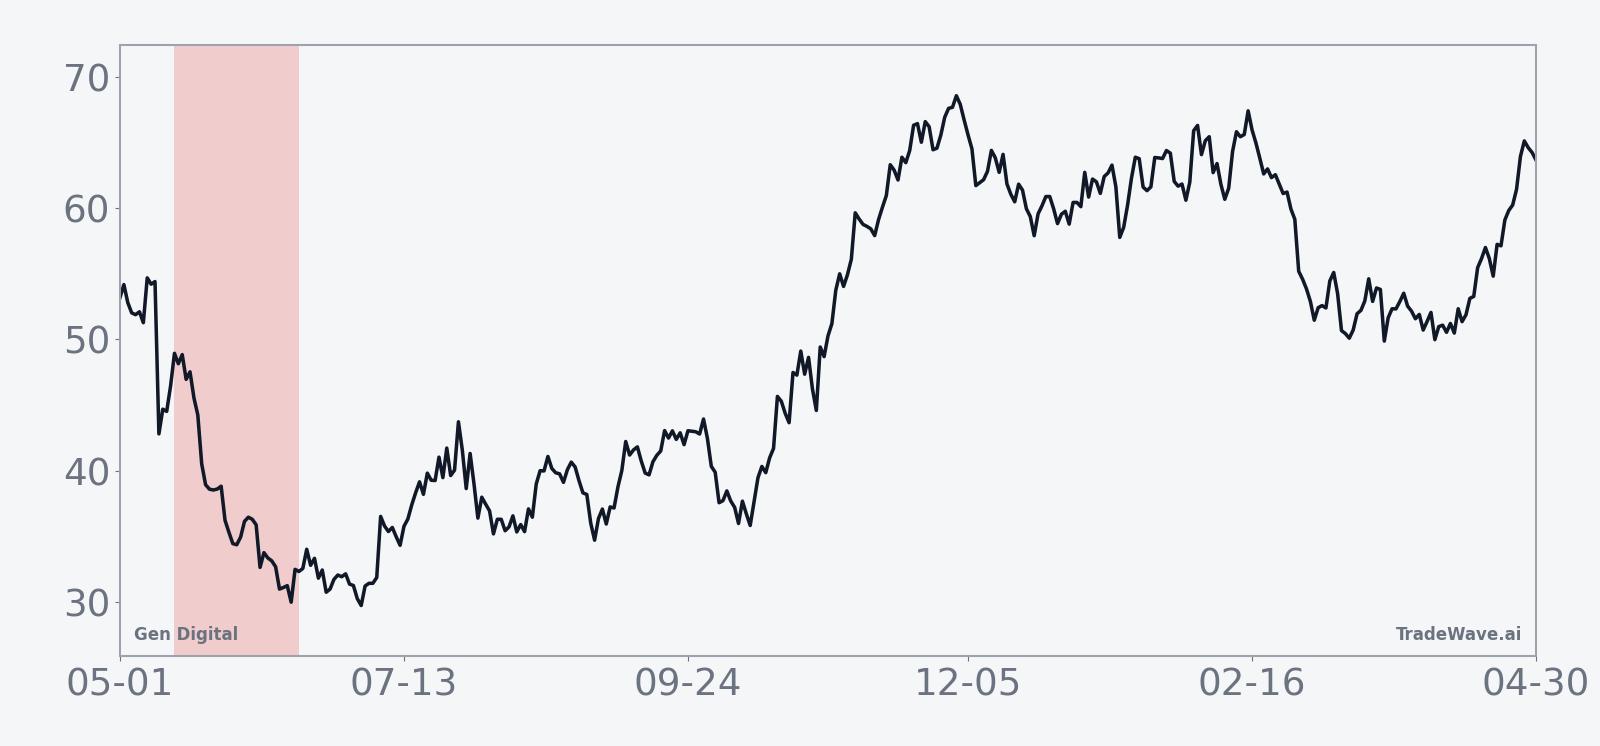
The chart below situates the latest move against the past year of trading and a 60-day seasonal projection.
What should traders watch in this Gen Digital (GEN) window?
The first test is whether Gen Digital respects the 50-day moving average near 20.13 if the stock starts to fade from current levels; in prior midterm-election windows, weakness has often accelerated once short-term support gave way.[1] Traders watching this GEN seasonal trend will also focus on how the stock behaves around any follow-up commentary from management or sector peers, since negative read-throughs have historically lined up with the middle of the 33-day window.
Second, intraperiod volatility matters as much as direction. Past windows have seen maximum adverse moves for shorts reach double digits, so a sharp squeeze higher would not automatically break the pattern as long as the stock ultimately rolls over before the window closes. Price action that stays firm or grinds higher into late June would contradict the historical stock pattern analysis and suggest that the post-earnings narrative is overpowering the usual midterm-year seasonal drag.
Finally, keep an eye on broader tech and cybersecurity sector flows, since this Gen Digital trading window sits in the mid part of the midterm election year when policy noise and budget debates can shift investor appetite quickly. If sector risk-off episodes cluster inside this 33-day stretch, they would line up with how this May seasonal pattern has played out in the last eight midterm cycles.
Sources
About this seasonal analysis
Seasonal pattern data is sourced from TradeWave.ai, which analyzes historical price behavior across annual calendar windows going back up to 30 years. Read the full data methodology or the book The 100-Year Pattern by Afshin Moshrefi (2026 edition). Past performance of seasonal patterns does not guarantee future results. This article is for informational purposes only and does not constitute investment advice.