Corning Inc. (GLW) Has Rallied in 9 of 9 Midterm June Windows, Averaging 18.75% Gains
Corning Inc. is heading toward a historically powerful midterm-year seasonal window just as its AI-fueled rally cools after earnings, setting up a clash between pullback and pattern.
What is the seasonal pattern for Corning Inc. (GLW)?
Corning Inc. has risen in 9 of 9 midterm-election-year windows starting in mid-June, with an average gain of 18.75% in winning years.
- 9 for 9 in this window, with average winning-year gains of 18.75% across the last nine midterm election years.
- The upcoming 248-day trading window begins on Jun 12, 2026 and runs deep into the following pre-election year.
- Percent Profitable is 100%, with 9 winners and 0 losers in the historical sample for this GLW seasonal trend.
- Average profit across all years matches the winners-only figure at 18.75%, reflecting the absence of losing seasons in this pattern.
- The TradeWave Ratio of 2.04 signals that price has typically traveled meaningfully in the long direction within the window, even before final outcomes.
- Individual years have still seen sharp drawdowns inside the window, underscoring that intraperiod risk can be large despite the perfect win record.
According to historical data from TradeWave.ai, this mid-June start date has marked a distinct seasonal regime for Corning in past midterm election years, and the next iteration is now less than a month away.
How has Corning Inc. (GLW) traded in this midterm-year seasonal window?
Corning Inc. has posted gains in all 9 midterm-election-year windows that began around mid-June, averaging 18.75% returns over a 248-day stretch. The next window opens on Jun 12, 2026, with the stock last changing hands at about $199.60, roughly 4.5% below its 52-week high of $208.92.[1] That combination of a strong historical season and a modest pullback from the highs gives this upcoming Corning Inc. trading window unusual weight for investors watching the AI infrastructure story.
The pattern is built on the last nine midterm election years, a phase where policy uncertainty and rate debates often weigh on cyclicals before giving way to a more supportive pre-election backdrop. Grouping by the presidential cycle matters here because Corning’s end markets, from data centers to solar, are sensitive to fiscal incentives and infrastructure spending that tend to ramp as Washington moves closer to the next presidential race.
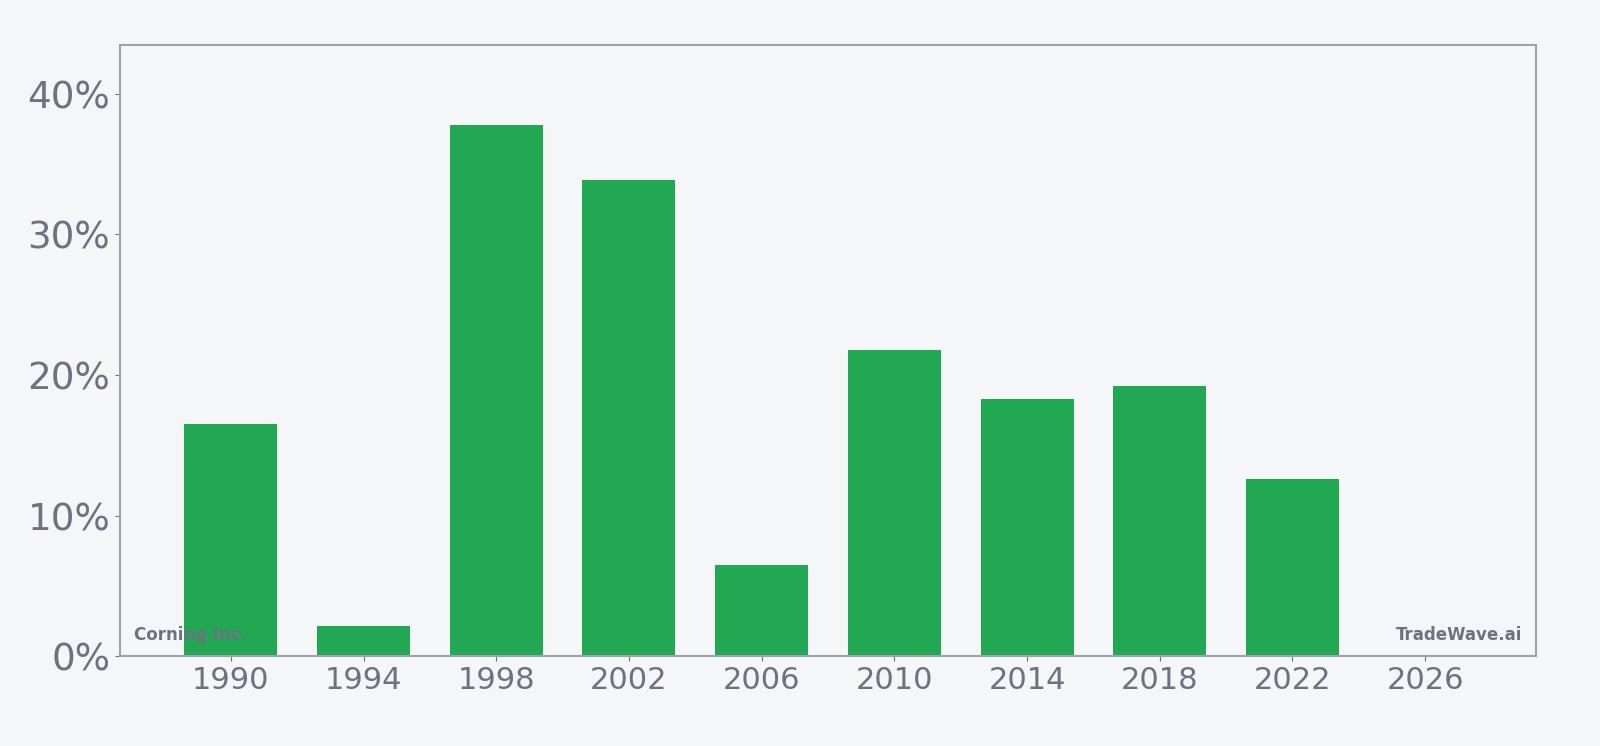
Across those nine midterm-year slices, the GLW seasonal trend has been consistently positive for long exposure. Percent Profitable sits at 100%, with 9 winners and 0 losers, and the median profit of 18.28% is almost identical to the average, which suggests the gains have not been skewed by a single outlier year. Add it up: the cumulative return across these windows is 352%, with an annualized return of 18.25% for this specific seasonal regime.
The per-year table shows how that plays out in practice. The weakest outcome was 1994, when Corning still finished the window up 2.15%, while the strongest was 1998, with a 37.8% net return from entry to exit. More recent midterm years such as 2018 and 2022 delivered gains of 19.25% and 12.59% respectively, suggesting the pattern has persisted into the modern AI and data-center era rather than being a relic of the 1990s.
The historical seasonal average trend for this window slopes higher for most of the 248 trading days, with the steepest part of the curve typically occurring in the middle third of the period. That suggests prior cycles often saw Corning grind higher through late summer and autumn, then consolidate gains into the early part of the following pre-election year rather than spiking only at the end.
A closer look at yearly net returns and intraperiod swings shows how much room GLW has historically had to run, and how deep the drawdowns have been along the way.
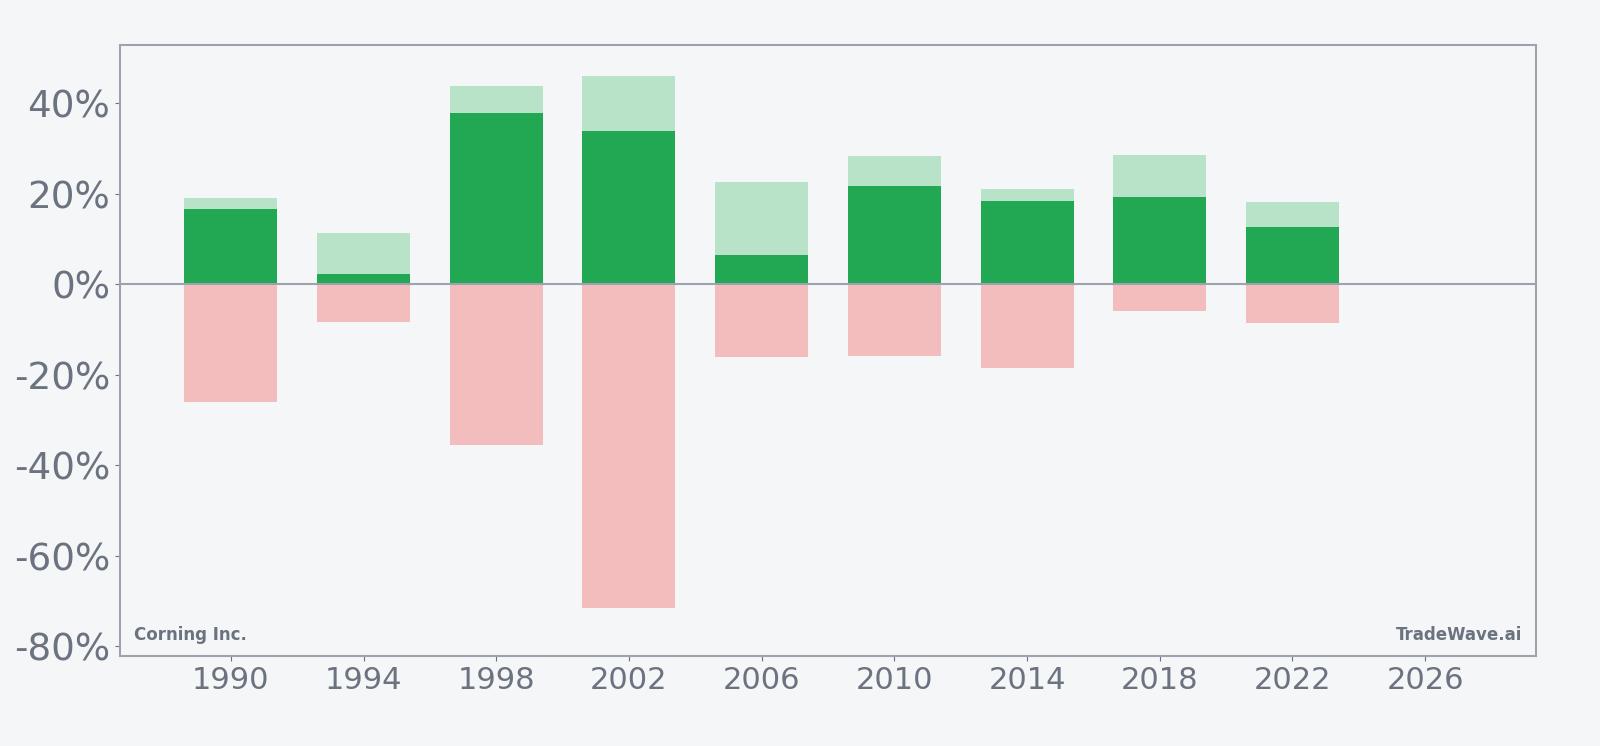
The stacked net/MFE/MAE bars show that while every year finished positive, the ride was often rough. In 2002, for example, Corning ended the window up 33.85% with a maximum favorable move of 46.0%, but it also suffered a maximum adverse excursion of -71.58% from the entry point at one stage. Even in more orderly years like 2018, the stock saw a -6.05% worst drawdown against a 28.52% peak run-up. That mix of large MFE and sometimes very large MAE is what the 2.04 TradeWave Ratio is flagging: historically, this has been a high-energy window where the stock can travel far in the long direction but not without meaningful air pockets.
History does not guarantee future results; adverse excursions can be large even in winning windows, and past seasonal strength does not ensure similar outcomes in 2026–2027.
Why does Corning Inc. (GLW) follow this seasonal pattern?
This pattern may reflect how Corning’s earnings calendar and capital spending cycles line up with the political calendar. One likely driver is that midterm years often bring policy noise and delayed infrastructure decisions early on, followed by clearer funding signals and data-center build-outs as the cycle shifts toward the pre-election year, which benefits AI and optical-fiber suppliers like Corning.[3][5] Institutional portfolio rebalancing into secular growth themes ahead of the typically stronger pre-election year may also amplify flows into GLW during this specific stretch.
What is driving Corning Inc. (GLW) today?
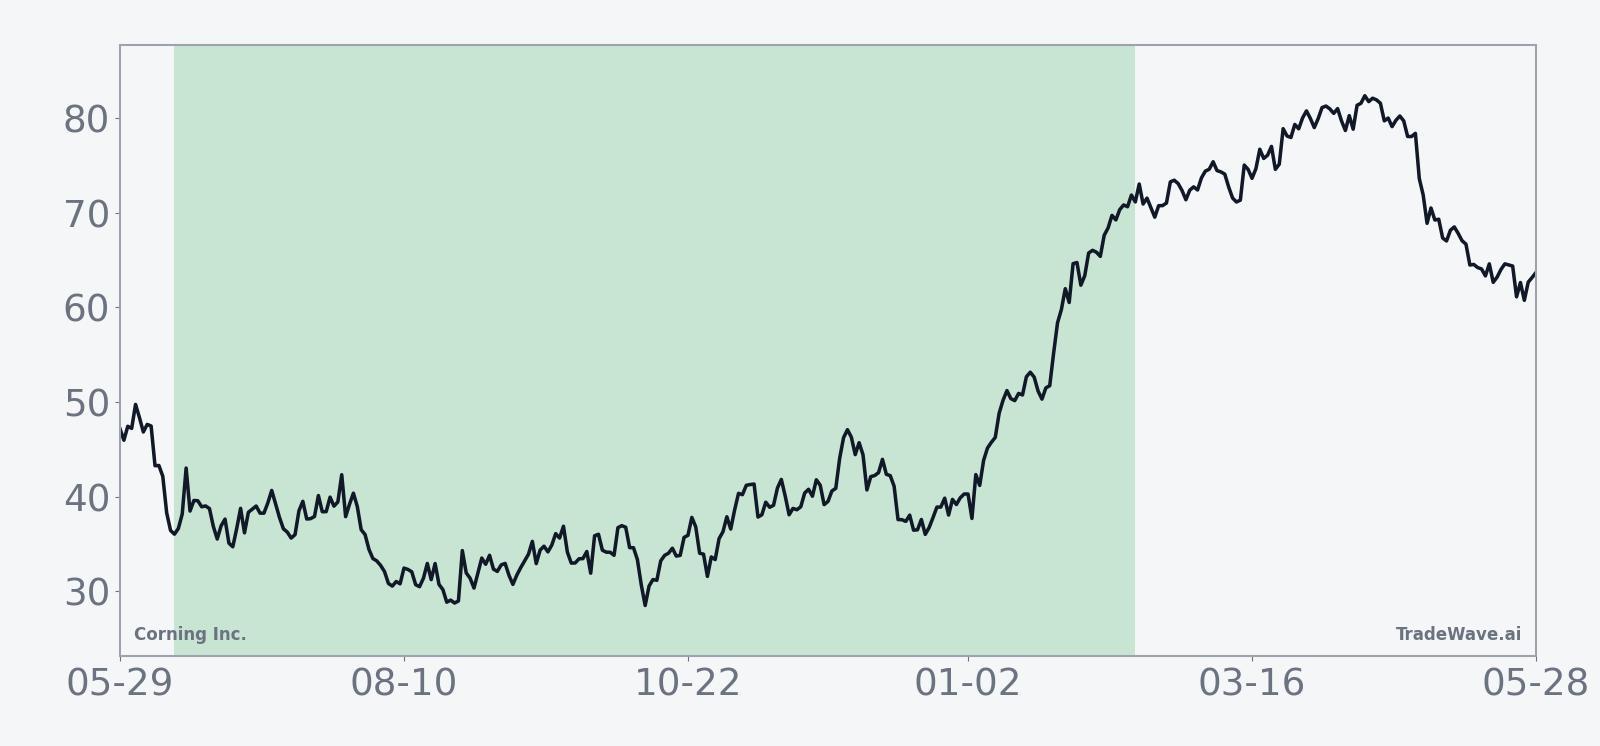
Corning shares last closed at $199.60, down 3.8% on the day and about 4.5% below their 52-week high of $208.92, after a month in which the stock still logged a 14.71% gain.[1] The pullback follows an earnings report on Apr 28, 2026 that beat expectations on both revenue and earnings but triggered a more than 7% drop on heavy volume as investors digested how much of the AI and solar growth story was already priced in.[1]
For the quarter ended Mar 31, 2026, Corning reported core revenue of $4.35 billion, up 18% and ahead of estimates, with adjusted EPS rising 30% to $0.70, helped by demand from AI data centers and solar customers.[1] Management guided to about 14% core sales growth for the current quarter, implying roughly $4.6 billion in revenue and core EPS between $0.73 and $0.77, reinforcing the view that the AI infrastructure boom is still in its early innings for the company.[4]
The macro backdrop has been supportive. AI infrastructure demand is driving a surge in optical fiber needs as hyperscale data centers race to add bandwidth, a trend that has turned a 175-year-old glassmaker into a key enabler of the AI build-out.[3] Corning’s positioning alongside large technology customers has been further validated by a multiyear optical fiber deal with Nvidia announced on May 6, 2026, which includes plans for three new manufacturing plants and underscores how central GLW has become to the AI supply chain.[5]
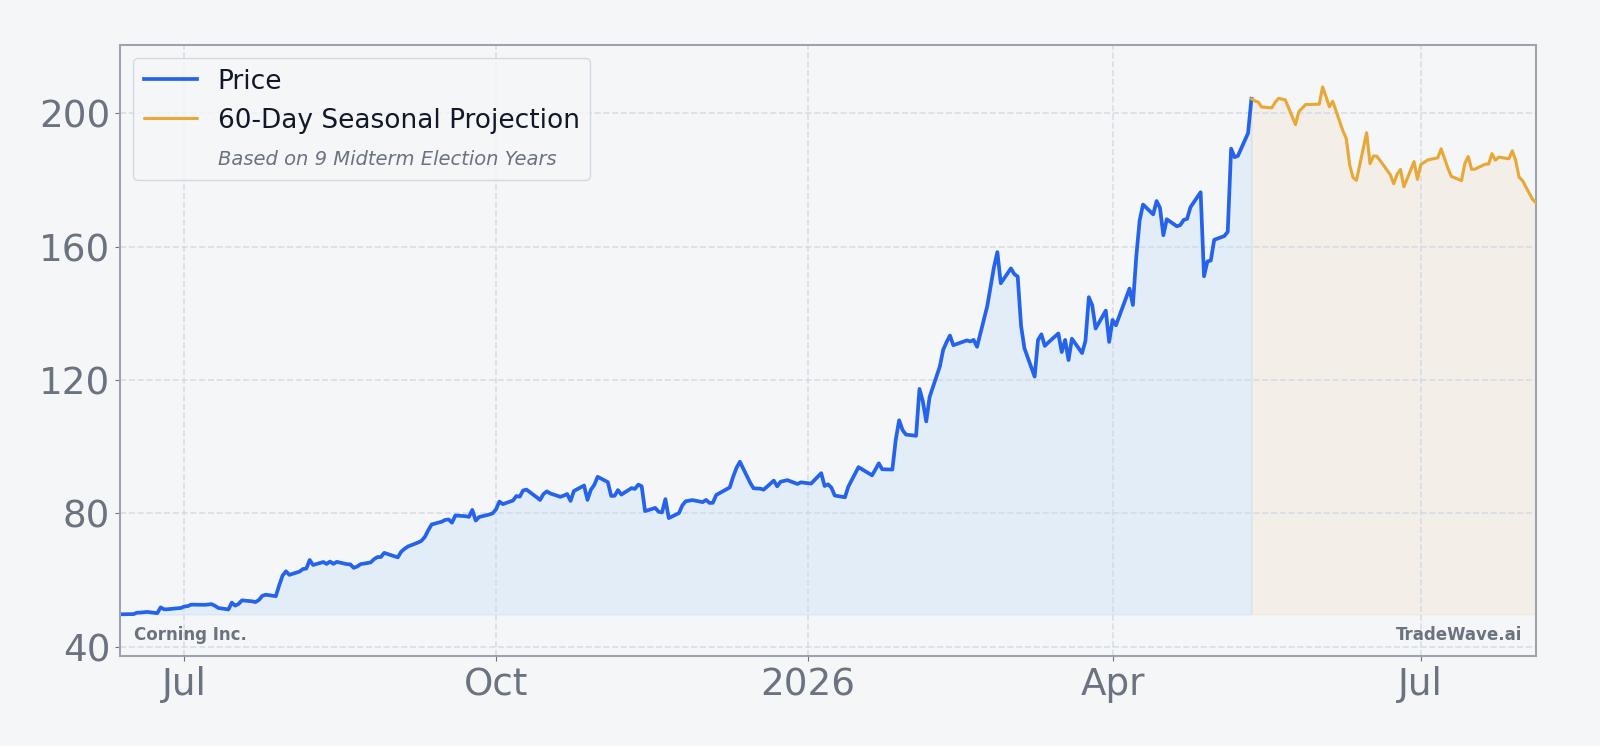
The chart below situates the latest pullback against Corning’s strong run over the past year and overlays a short-term seasonal projection.
What should traders watch as this seasonal window approaches?
First, the calendar. The 248-day window begins on Jun 12, 2026, so the next four weeks are about watching whether GLW stabilizes after the earnings shakeout or continues to bleed lower into the seasonal start. A firm base above the 50-day moving average, which currently sits near $153.38, would keep the longer-term uptrend intact even if volatility remains elevated.[1]
Second, the policy and spending backdrop into the heart of the midterm election year. Any fresh signals on U.S. infrastructure funding, data-center incentives, or clean-energy tax credits could reinforce the historical pattern of stronger performance as the cycle transitions toward the pre-election year, when risk appetite has often improved for growth and industrial names tied to capital spending.[3][5]
Third, the AI infrastructure pipeline itself. Follow-through on the Nvidia partnership, additional design wins with large cloud providers, or commentary from management about capacity additions will help confirm whether the demand curve that powered the last few quarters is still steepening.[1][3][5] If those catalysts line up with the opening weeks of the seasonal window, history suggests GLW has room for sizable upside moves, albeit with the kind of drawdowns that have marked prior cycles.
Finally, behavior inside the window will be the real test of this GLW seasonal trend. A pattern of higher highs and higher lows through late 2026, even with occasional 10% to 20% air pockets, would rhyme with the last nine midterm-year windows. A sustained break of recent lows or a failure to respond to positive AI and policy news would be the clearest sign that this cycle is diverging from the historical script.
Sources
- [1] CNBC, "Red-hot Corning shares slide on earnings. Why that's a gift to investors" (Apr 28, 2026).
- [2] Reuters, "Corning results hit by weakness in optical fiber unit, shares fall" (Oct 28, 2025).
- [3] The Wall Street Journal, "Why a 175-Year-Old Glassmaker Is Suddenly an AI Superstar" (Feb 7, 2026).
- [4] Reuters, "Corning forecasts first-quarter sales above estimates on strong optical fiber demand" (Jan 28, 2026).
- [5] MarketWatch, "Nvidia’s new deal with Corning validates one of the hottest AI trends out there" (May 6, 2026).
About this seasonal analysis
Seasonal pattern data is sourced from TradeWave.ai, which analyzes historical price behavior across annual calendar windows going back up to 30 years. Read the full data methodology or the book The 100-Year Pattern by Afshin Moshrefi (2026 edition). Past performance of seasonal patterns does not guarantee future results. This article is for informational purposes only and does not constitute investment advice.