Qualcomm (QCOM) Earnings Beat Meets a 22-Day Window With Short-Side Bias
Qualcomm is approaching a 22-day midterm-year trading window that has leaned modestly bearish in the past, just weeks after a sharp pullback from record highs.

What is the seasonal pattern for Qualcomm (QCOM)?
Qualcomm has fallen in 5 of 8 midterm-year windows during this late-May 22-day stretch, with an average 4.91% gain in winning years.
- 5 wins and 3 losses in this window, with winning years averaging 4.91% moves in Qualcomm’s favor.
- The upcoming 22-trading-day window starts on May 25 and historically aligns with a short trade direction in midterm election years.
- Percent Profitable is 62%, with 5 winners and 3 losers across the last eight midterm-year samples.
- Including all years, the average outcome is a 3% move in the trade direction, showing that losses have been relatively contained.
- Intraperiod swings have been meaningful, with several years showing double-digit peak moves before reversing, underscoring the need to respect drawdowns.
- The pattern sits inside a broader midterm-year environment where policy uncertainty and sector rotation often amplify semiconductor volatility.
According to historical data from TradeWave.ai, this late-May window for Qualcomm behaves differently in midterm election years than in a typical month, with a defined short-side bias that traders often overlook.
How has Qualcomm (QCOM) traded in this late-May midterm-year window?
In the last eight midterm election years, this 22-day window starting May 25 has tilted in favor of short setups in Qualcomm, with 5 winners and 3 losers for the pattern. Shares finished Tuesday at $210.31 after an 11.46% single-session drop, leaving the stock about 15.2% below its 52-week high of $247.90 and still well above its 50-day moving average of $144.91.[1][5][6]
Because this pattern is grouped by the presidential election cycle, it only looks at Qualcomm’s behavior in the last eight midterm election years, not in every calendar year. That matters in 2026, which is itself a midterm election year, since policy debates around regulation, industrial policy and AI infrastructure spending can change how large-cap chip names trade compared with pre-election or presidential years.
Historically, the trade direction for this window has been short, meaning the pattern is defined around Qualcomm drifting lower or at least failing to hold rallies during the 22-day stretch. The Percent Profitable figure of 62% reflects 5 years where that short bias worked and 3 where it did not, so this is not a “layup” but a modest edge. In winning years, the average move in the trade direction was 4.91%, while including all eight years, winners and losers together, the average outcome was a 3% move in favor of the short side.
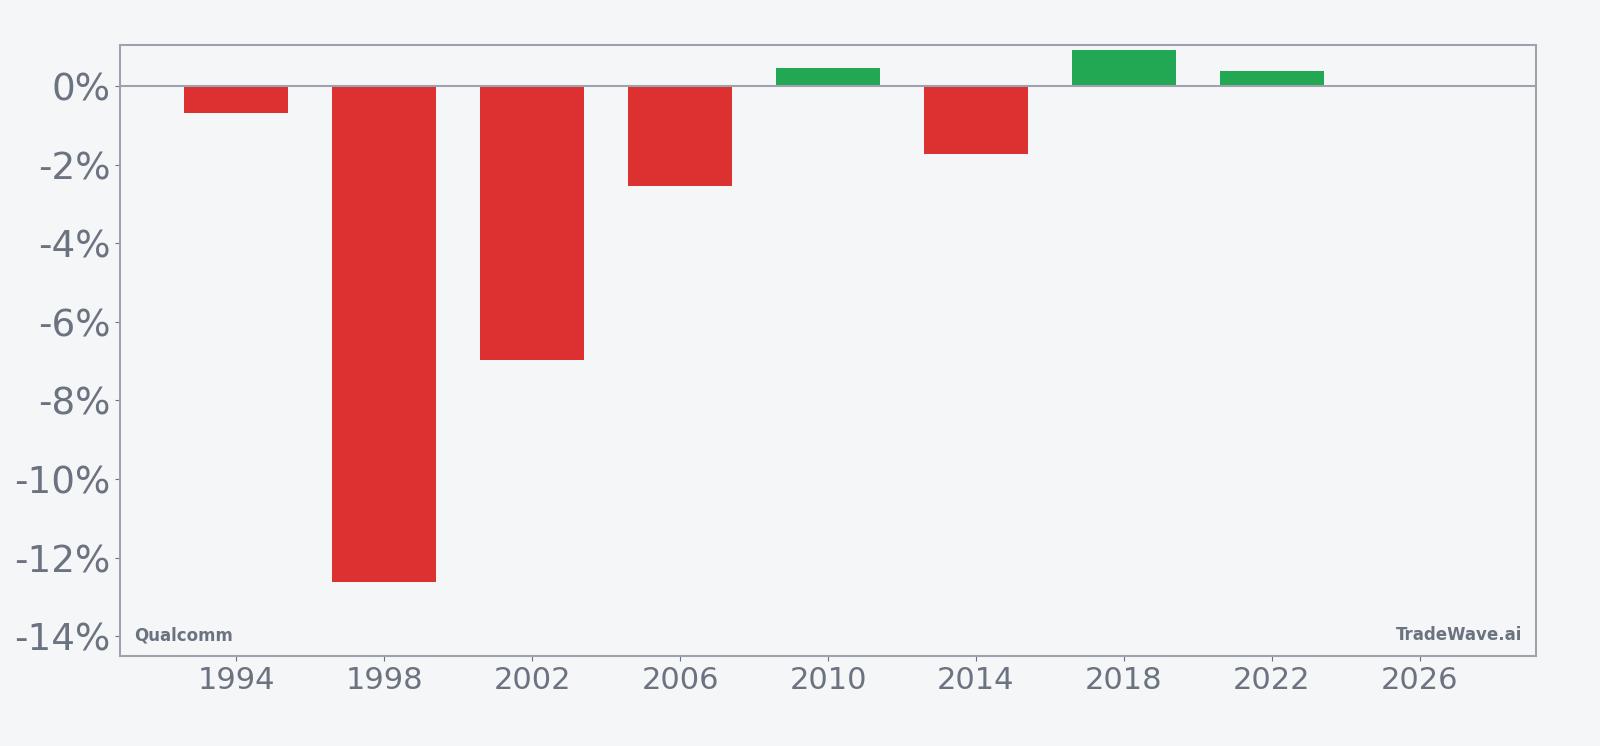
The per-year table shows how uneven those outcomes have been. In 1998, the pattern’s strongest year, Qualcomm delivered a net return of -12.62% in the window, which was favorable for a short, with the worst intraperiod drawdown from entry at -12.85% and only a small 1.17% favorable move against the short before the decline took hold. By contrast, 2010 was one of the softer years, with a 0.45% net gain for the stock and a relatively shallow -3.08% worst drawdown from entry, which translated into a small loss for the short setup.
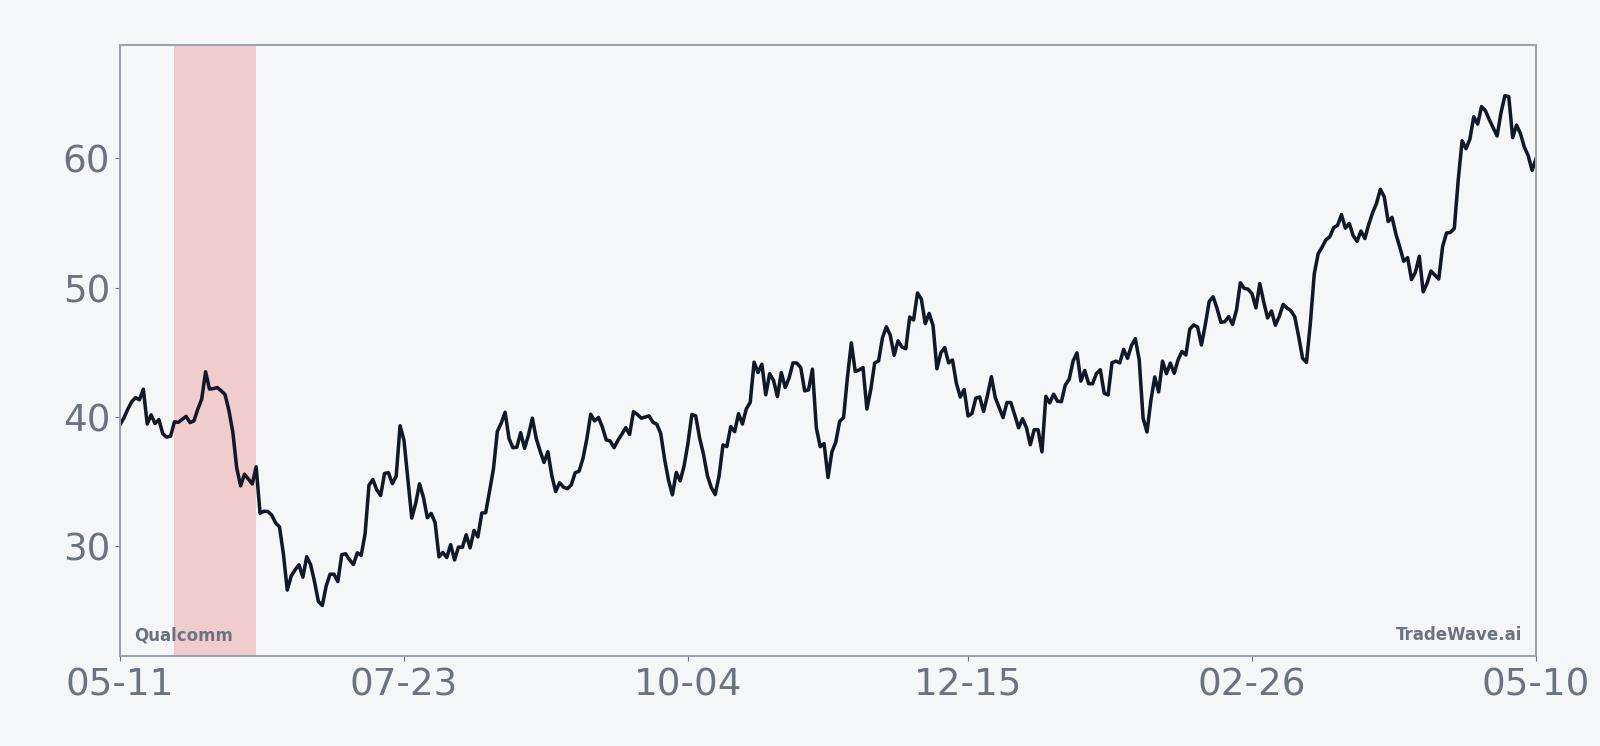
The historical seasonal trend line for this Qualcomm trading window shows a choppy path rather than a smooth slide, with weakness often clustering in the middle of the period. That fits a pattern where early rallies can fade and intraperiod volatility matters as much as the final close.
The next chart combines net results with the best and worst intraperiod swings to show how far Qualcomm has tended to move inside the window.
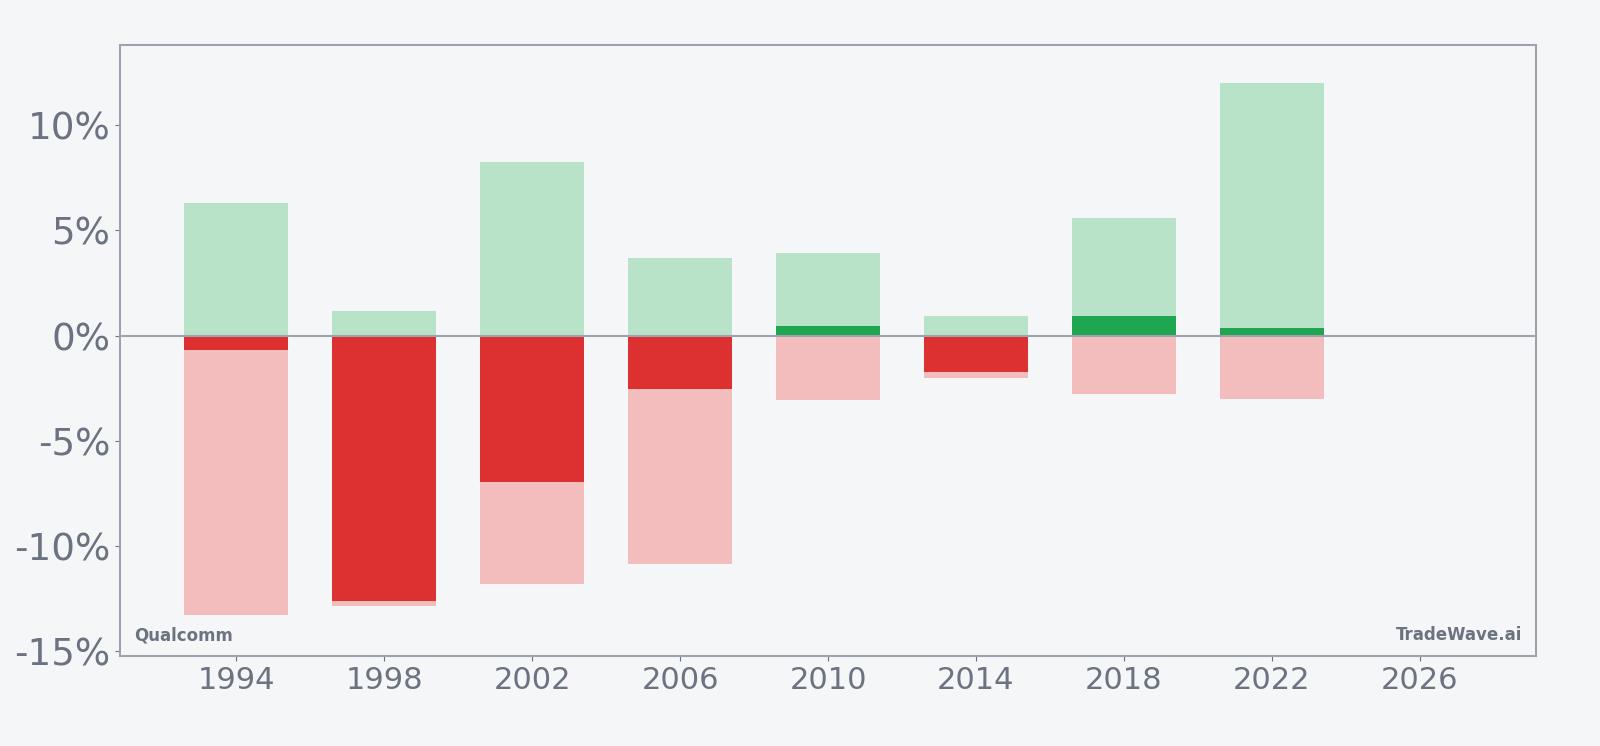
The stacked net/MFE/MAE profile highlights how much Qualcomm can swing inside this 22-day stretch even when the final result looks modest. In 1994 and 2002, for example, the stock saw maximum favorable moves of 6.29% and 8.25% against the short before ultimately finishing lower, while maximum adverse excursions reached -13.28% and -11.81% in the trade direction, underscoring how quickly the pattern can accelerate once it breaks. More recent years such as 2018 and 2022 show smaller net outcomes but still feature 5% to 12% peak moves, which is consistent with a TradeWave Ratio of 1.41 that signals meaningful travel in the trade direction inside the window.
The cumulative return line for this pattern, which aggregates all eight midterm-year windows, sits at 24% with an annualized return of 2.76%, a modest but persistent edge for the short side. The Sharpe ratio of 0.56 is not spectacular but confirms that, on a risk-adjusted basis, this Qualcomm seasonal trend has been more than random noise.
History does not guarantee future results, and maximum adverse excursions have reached double digits in some years, so even “winning” windows have carried sizable drawdown risk.
Why does Qualcomm (QCOM) follow this seasonal pattern?
One likely driver is the way Qualcomm’s fiscal calendar and product launches cluster around the middle of the year, which can leave late May and June as a digestion phase after big guidance updates. Analysts have also pointed to institutional portfolio repositioning in midterm election years, when policy uncertainty around technology regulation and industrial subsidies can trigger short-term de-risking in high-beta chip names. This Qualcomm seasonal pattern may reflect that combination of post-earnings consolidation and mid-cycle sector rotation rather than any single recurring headline.
What is driving Qualcomm (QCOM) today?
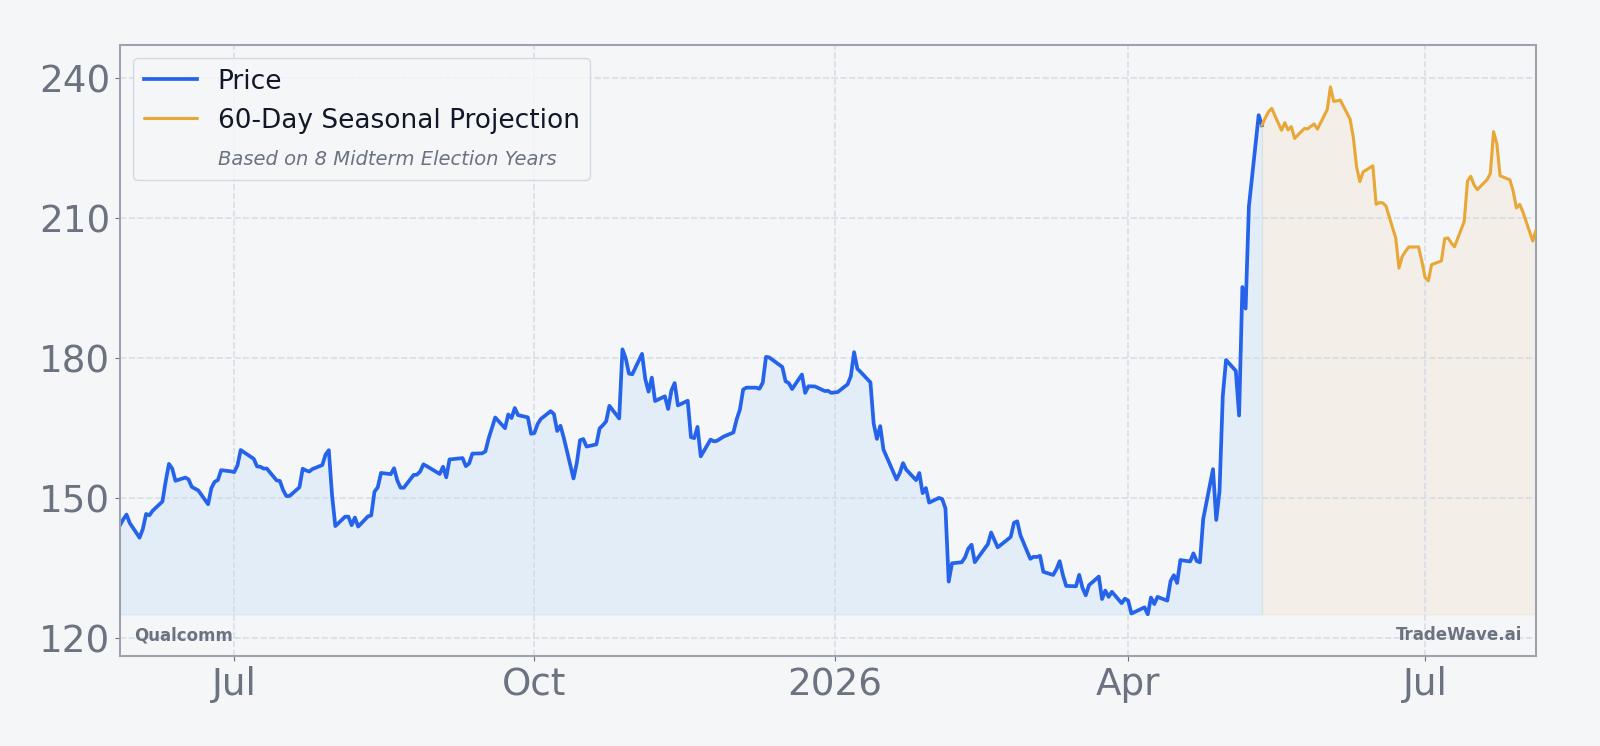
Qualcomm closed at $210.31 after sliding 11.46% in heavy trading, a sharp reversal that comes just two weeks after shares jumped more than 13% on a Q2 earnings beat and only months after a powerful run tied to AI and automotive growth.[1][5][6] The stock is still up strongly over the past month, with a 58.32% one-month return, but it has pulled back from a 52-week high of $247.90 and remains well above its 50-day moving average of $144.91, leaving bulls with gains to protect and shorts with fresh levels to lean against.[1][6]
On Apr 29, Qualcomm’s Q2 results topped expectations and highlighted strong demand across smartphones, automotive and IoT, sparking that double-digit surge as investors leaned into the company’s AI and edge-computing story.[5] Earlier in the year, coverage from Forbes framed Qualcomm as a key beneficiary of AI wearables and data center chips, with record automotive and IoT revenues and a growing pipeline of Snapdragon partnerships, while another March analysis flagged that some “big money” accounts were stepping back after the rally, hinting at positioning risk around elevated levels.[1][6] Add in the memory supply concerns that surfaced around the Q1 FY2026 report and the stock’s recent volatility looks less like a one-off shock and more like a tug-of-war between long-term AI optimism and near-term supply and positioning constraints.[1][2]
The chart below situates the latest move in its recent multi-month context, alongside a 60-day seasonal projection.
From a macro and policy standpoint, this all plays out in the middle of the 2026 midterm election year, a phase that often brings more headline risk for large-cap technology. Debates over AI regulation, export controls and industrial policy can swing sentiment quickly for chipmakers, especially those like Qualcomm that sit at the intersection of smartphones, automotive and data center infrastructure. For traders watching the QCOM seasonal trend, that backdrop means the historical short-side bias in this late-May window is colliding with a stock that has already seen big moves on both the upside and downside in recent months.
What should traders watch in this Qualcomm seasonal window?
First, the calendar: the 22-day window begins on May 25 and runs into late June, so any renewed weakness or failed rallies in that span would be consistent with the historical short-side tilt. Second, levels: the recent high near $248 and the post-selloff zone around $200 are the key bands that will show whether buyers are still willing to defend the AI and automotive story after the latest drawdown. Third, volatility: intraperiod swings have historically been large in this window, with several years showing 8% to 12% peak moves, so how Qualcomm trades around intraday spikes and gap openings will matter as much as where it finishes the month.
Finally, watch the flow of news and positioning around AI chips, automotive design wins and any fresh commentary on memory supply or macro demand. If strong fundamental headlines reappear and institutional money that “steered clear” in March starts to re-engage, a historically bearish midterm-year window could still see squeezes against shorts before any trend reasserts itself.[1][5][6] If, instead, rallies keep stalling below the recent highs and volume spikes skew toward down days, that would look more like the classic Qualcomm trading window that has favored short exposure in 5 of the last 8 midterm election years.
Sources
- Forbes: "Is Qualcomm Stock Undervalued?" (Mar 16, 2026)
- The Wall Street Journal: "Qualcomm First-Quarter Sales Rise, But Memory Shortage Dents Outlook" (Feb 4, 2026)
- Reuters: "Qualcomm forecasts first-quarter results above estimates as smartphone demand bounces back" (Nov 5, 2025)
- Forbes: "Qualcomm Stock Dominance At A Discount - Investment Opportunity?" (Oct 13, 2025)
- CNBC: "Qualcomm shares jump more than 13% on Q2 earnings beat" (Apr 29, 2026)
- Forbes: "Why Big Money Is Steering Clear Of Qualcomm Stock This Week" (Mar 17, 2026)
- Yahoo Finance: "Qualcomm stock jumps after unveiling new AI chips to challenge Nvidia" (Oct 27, 2025)
About this seasonal analysis
Seasonal pattern data is sourced from TradeWave.ai, which analyzes historical price behavior across annual calendar windows going back up to 30 years. Read the full data methodology or the book The 100-Year Pattern by Afshin Moshrefi (2026 edition). Past performance of seasonal patterns does not guarantee future results. This article is for informational purposes only and does not constitute investment advice.