IBM Enters Historically Strong 67-Day Midterm-Year Seasonal Window
IBM is entering a historically strong 67-day midterm-year seasonal window just as the stock cools from a sharp rally and options traders crowd into bullish bets.

What is the seasonal pattern for IBM (IBM)?
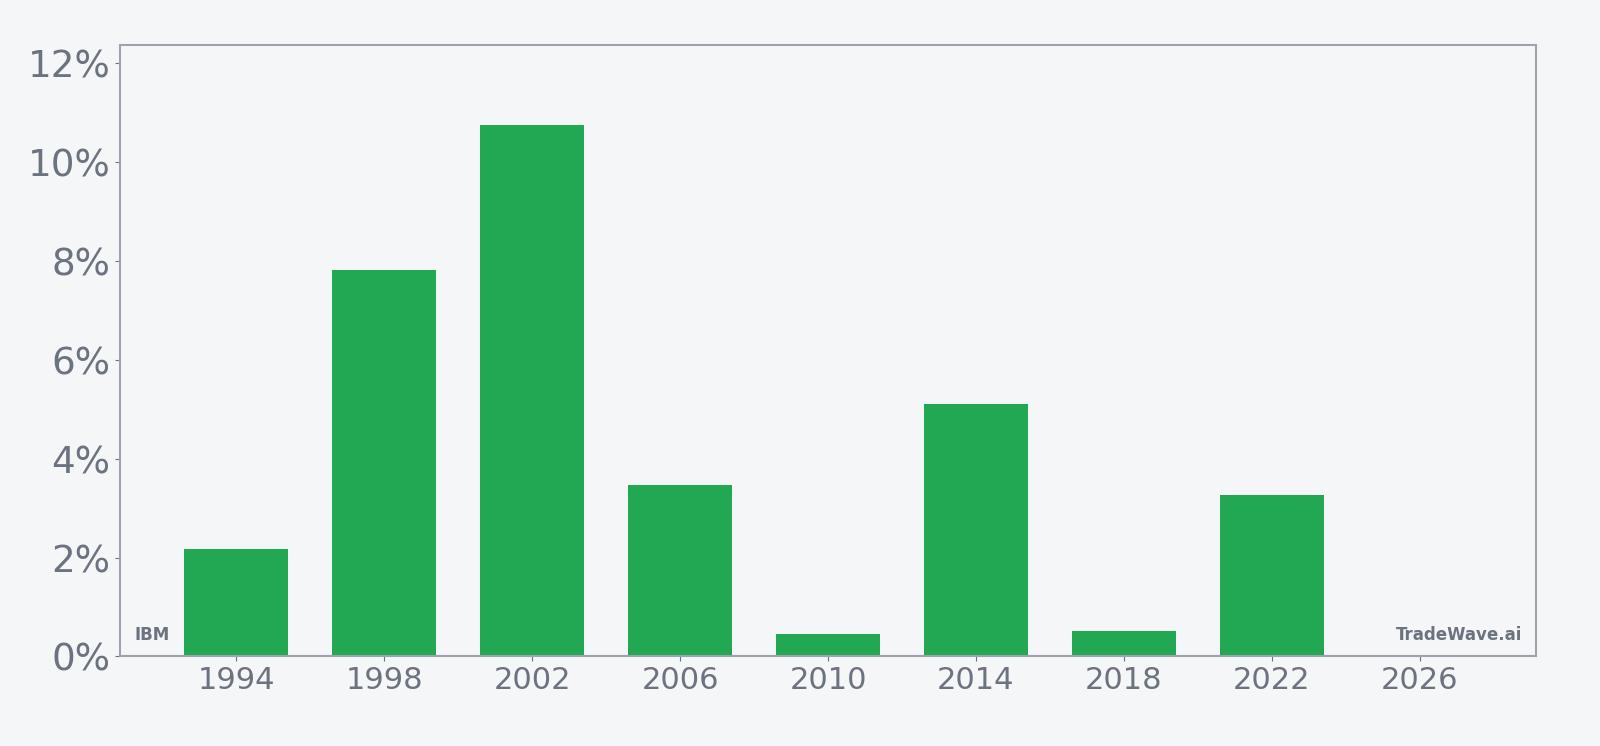
IBM has risen in 8 of 8 midterm-election-year summer windows during this 67-day stretch, with an average gain of 4.2% in winning years.
- 8 for 8 in this window, with IBM averaging 4.2% gains across all winning years in the sample.
- The 67-day trading window begins Jun 12 and covers the heart of the midterm-election-year summer.
- Percent Profitable is 100%, with 8 winners and 0 losers across the last eight midterm-election-year cycles.
- Individual winning years have ranged from modest 0.46% gains to a 10.75% advance, showing varied but consistently positive outcomes.
- Intraperiod swings have been meaningful, with some years seeing double-digit drawdowns before finishing higher.
- The pattern aligns with IBM’s role as an enterprise software and AI bellwether during a policy-heavy midterm year.
According to historical data from TradeWave.ai, this midterm-year summer stretch has behaved differently from a typical calendar month for IBM, with a clear directional bias that many investors overlook.
How has IBM (IBM) traded in this midterm-year summer window?
IBM has risen in all eight midterm-election-year summer windows that start on Jun 12 and run for 67 trading days, averaging a 4.2% gain for long positions. Shares finished Thursday at $275.65, up 1.2% on the day and about 17.0% below the 52-week high of $332.46, after a 28.05% surge over the past month that has pulled the stock well above its 50-day moving average of $246.76.[7] Heavy call buying and nearly 200,000 options contracts tied to a potential $1 billion U.S. Commerce Department quantum-computing grant have added a speculative layer to that move, with traders leaning into long-dated upside exposure.[10]
Grouping by the presidential election cycle matters here because IBM’s strongest seasonal windows often line up with policy-heavy phases, and this pattern specifically looks at the last eight midterm-election-year summers rather than consecutive calendar years. In midterm years, Washington tends to front-load regulatory and spending decisions before the pre-election year, which can shape enterprise IT budgets and government contracts in ways that show up in IBM’s stock pattern analysis.
Across those eight midterm-year samples, the IBM seasonal trend has been consistently bullish for long exposure. Percent Profitable sits at 100%, with 8 winners and 0 losers, and the average profit of 4.2% reflects all years in the window, not just the best ones. The median gain of 3.36% suggests that while there have been standout years, the typical outcome has still been a solid single-digit advance rather than a one-off outlier regime.
Individual years show how this IBM trading window can behave. The strongest outcome came in 2002, when IBM gained 10.75% over the 67 days, while 1998 delivered a 7.82% rise and 2014 added 5.11%. Even the softest years in the sample, such as 2010’s 0.46% gain and 2018’s 0.52% move, still finished positive, which is unusual for a single stock across eight separate midterm cycles.
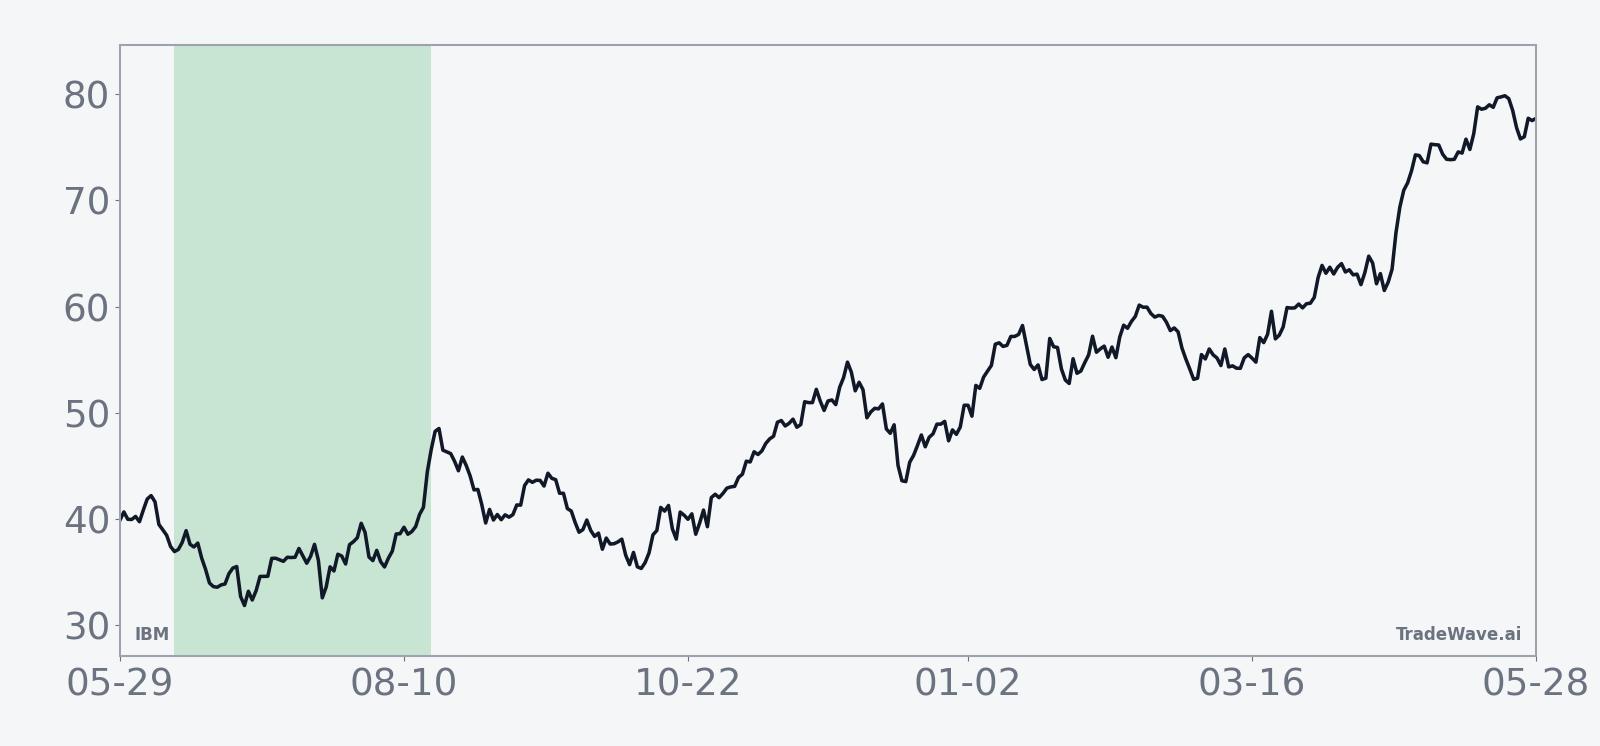
The historical seasonal average curve for this window slopes higher rather than chopping sideways, indicating that gains have tended to accrue gradually over the 67 days instead of hinging on a single event. The trend statistics show more “Trend Long” than “Trend Short” days, which lines up with a pattern where pullbacks have been bought and rallies have had follow-through rather than immediate reversals.
A stacked view of yearly net returns alongside peak rallies and worst drawdowns shows how much room IBM has historically had to run, and how deep it has sometimes dipped, inside this window.
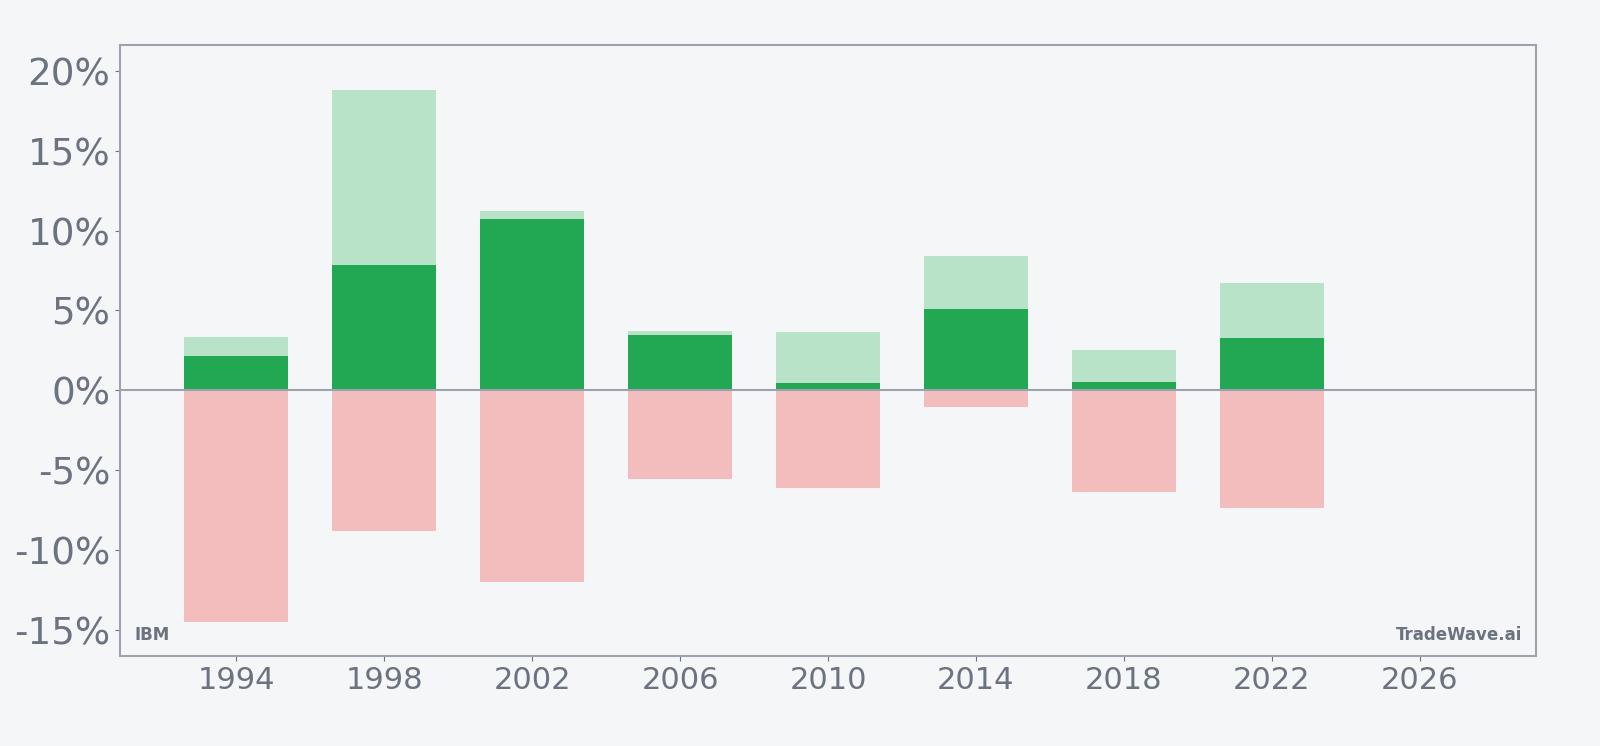
The per-year bars with maximum favorable and adverse excursions underline that this has been a high-variance but ultimately positive stretch. In 1998, for example, IBM’s best intraperiod rally reached 18.82% even though the final gain was 7.82%, while 1994 saw a modest 2.17% net rise despite a worst drawdown of 14.51% from the entry. That combination of sizable MFE and sometimes sharp MAE means the IBM seasonal trend has rewarded patience in this window, but only for traders able to sit through double-digit swings.
History does not guarantee future results; adverse excursions can be large even in winning windows, and past IBM seasonal patterns may not repeat in this or any future cycle.
Why does IBM (IBM) follow this seasonal pattern?
One likely driver is the way IBM’s enterprise customers set budgets and sign multi-year contracts around midyear, especially in a midterm election year when public-sector IT and defense spending decisions often accelerate. Analysts have also pointed to IBM’s earnings calendar, with Q2 and Q3 updates frequently landing inside or just after this window, which can reinforce positive momentum when AI, hybrid cloud and mainframe demand are strong.[3] The pattern may also reflect institutional portfolio repositioning into perceived “quality tech” as policy uncertainty peaks in midterm years and investors seek steadier cash-flow stories.
What is driving IBM (IBM) today?
IBM’s seasonal setup arrives after a volatile stretch in the stock. Shares closed Thursday at $275.65, up 1.2% on the day, after a 28.05% one-month rally that has taken the stock well above its 50-day moving average of $246.76 and left it about 17.0% below the 52-week high of $332.46.[7] That rebound followed a period in April when IBM beat Q1 2026 estimates but sold off as investors focused on an unchanged full-year outlook and questions about the pace of software growth.[3][7]
More recently, the narrative has flipped from disappointment to enthusiasm. On Jun 1, 2026, IBM shares surged after a resurfaced video featuring former President Donald Trump and a bullish Barclays forecast that framed the company as a beneficiary of quantum computing and resilient enterprise software demand.[9][10] Barclays initiated coverage with an overweight rating and a $350 price target, arguing that fears of a “SaaSpocalypse” were overdone and that IBM’s mix of AI, hybrid cloud and mainframe exposure was underappreciated.[10] The same day, reports that IBM stands to receive roughly $1 billion in U.S. Commerce Department grants for quantum computing helped ignite nearly 200,000 options contracts, with call buyers dominating the tape.[10]
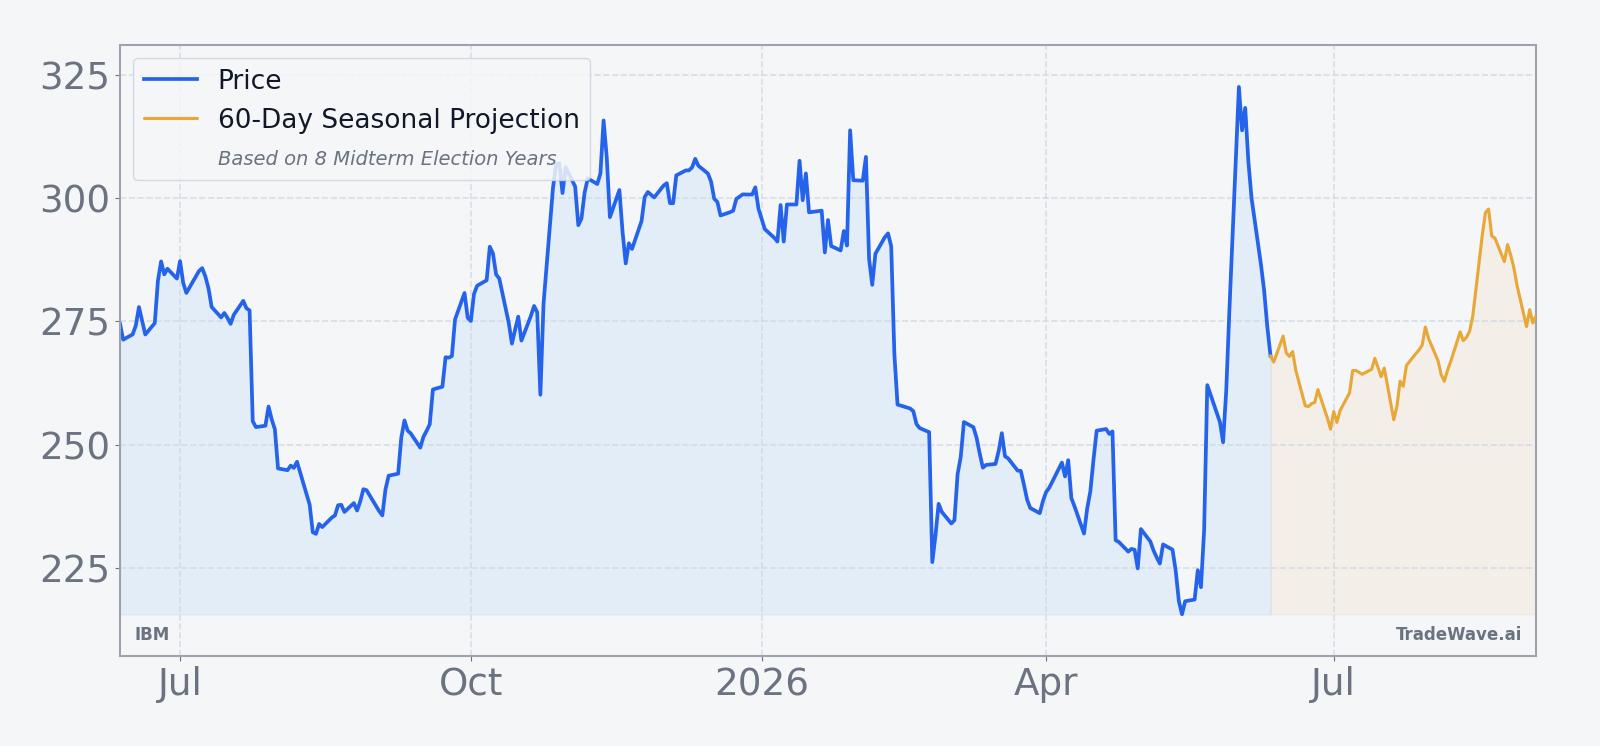
That options surge is the clearest Special Insight around this window. Large, long-dated call purchases suggest some traders are positioning for a sustained move higher rather than a quick headline spike, which lines up with the historical seasonality that has favored longs in this midterm-year summer stretch.[10] At the same time, the stock’s sharp run and distance from its 52-week high leave room for both profit-taking and fresh money flows as investors weigh AI and quantum tailwinds against a still-cautious revenue outlook.[3][7][10]
The chart below situates the latest move against IBM’s past year of trading and a 60-day seasonal projection overlay.
What should traders watch in this IBM seasonal window?
For this 67-day IBM trading window, the first watchpoint is how the stock behaves around the $260 to $280 band that has defined the latest surge. Historically, winning years have tolerated sizable pullbacks early in the window before grinding higher, so a dip that holds above the 50-day moving average near $246.76 would still fit the established IBM seasonal trend.[7] A swift break below that level, especially on heavy volume, would be an early sign that this cycle is diverging from the prior eight midterm-year samples.
Second, the policy and earnings calendar matters. Any concrete confirmation of the Commerce Department’s quantum-computing grant, or additional AI-related contract wins, could reinforce the historical pattern by extending the current risk-on stance toward IBM.[3][8][10] Conversely, a softer tone on software or consulting growth in the next earnings update, or signs that AI budgets are slipping, would test how durable the midterm-year seasonal tailwind really is.[3]
Third, options and positioning deserve close attention. If call volume and open interest continue to build at higher strikes and longer maturities, it would signal that the bullish Special Insight is still in play and that traders are leaning into the historical seasonality rather than fading it.[10] A sharp reversal in options flow, with put buying or call unwinds dominating, would suggest that fast money is stepping back even if the IBM seasonal pattern remains statistically strong.
Finally, watch how IBM trades relative to other large-cap tech and enterprise software names. In prior midterm-election years, quality tech has often become a defensive growth haven as macro and policy noise pick up, and IBM’s historical seasonality in this window fits that script. If the stock can hold its recent gains while peers wobble, it would be one more sign that this midterm-year summer window is behaving a lot like the last eight.
Sources
- [1] CNBC, "IBM is trying to rebound after results disappointed initially. What analysts and investors are saying" (Oct 23, 2025).
- [2] MarketWatch, "IBM’s stock is sliding. Here’s why these analysts see an opportunity to buy." (Jul 24, 2025).
- [3] Yahoo Finance (GuruFocus), "IBM Stock Tumbles. Solid Quarter Can't Offset Tepid Forecast" (Apr 23, 2026).
- [4] CNBC, "IBM tops third-quarter estimates and lifts guidance, but stock drops" (Oct 22, 2025).
- [5] Forbes, "What’s Happening With IBM Stock?" (Oct 7, 2025).
- [6] MarketWatch, "Why is IBM’s stock down after an earnings beat? Here’s one quibble." (Jul 23, 2025).
- [7] Barron's, "IBM Earnings Beat Estimates. The Stock Is Still Falling." (Apr 22, 2026).
- [8] CNBC, "IBM tops Q3 estimates and lifts guidance" (Oct 22, 2025).
- [9] Yahoo Finance, "IBM shares surge 15% after Trump video resurfaces" (Jun 1, 2026).
- [10] Business Insider, "IBM stock shoots higher after bullish Barclays forecast hits back at SaaSpocalypse fears" (Jun 1, 2026).
- [11] Forbes, "IBM Stock Isn't Dying. It's On Sale" (Feb 24, 2026).
About this seasonal analysis
Seasonal pattern data is sourced from TradeWave.ai, which analyzes historical price behavior across annual calendar windows going back up to 30 years. Read the full data methodology or the book The 100-Year Pattern by Afshin Moshrefi (2026 edition). Past performance of seasonal patterns does not guarantee future results. This article is for informational purposes only and does not constitute investment advice.