8-for-8 Midterm Streak: Amphenol (APH) Enters a 273-Day Window With 100% Profitable Years
Amphenol is heading toward a long midterm-election seasonal window that has never been negative in the last eight cycles, even as the stock trades near its 52-week high.
What is the seasonal pattern for Amphenol (APH)?
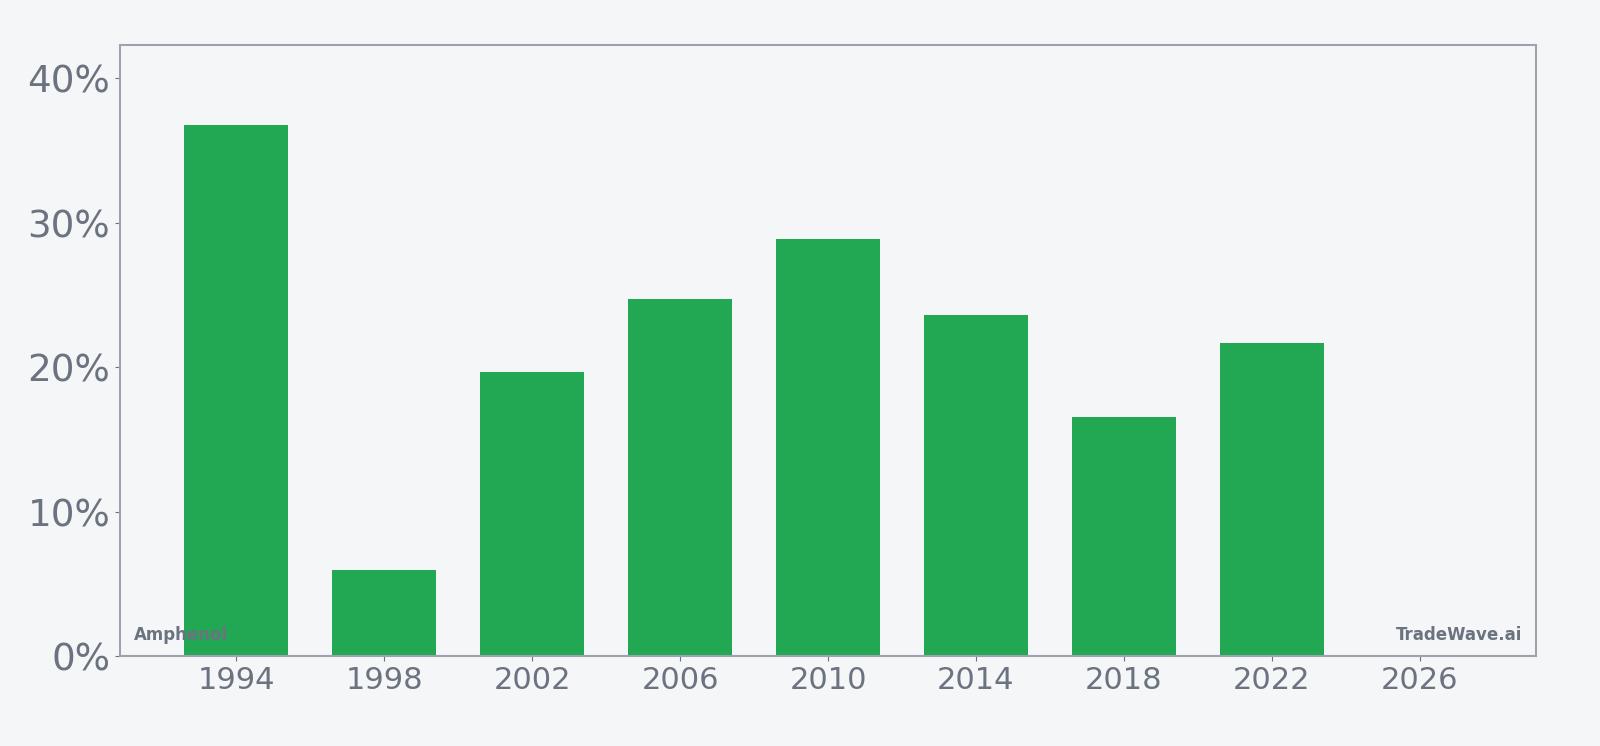
Amphenol has risen in 8 of 8 midterm-election-year windows starting in mid-July, with an average gain of 22.24% in winning years.
- 8 for 8 in this window, with Amphenol averaging 22.24% gains across all winning years.
- The upcoming window begins Jul 11, 2026 and runs for 273 trading days, spanning late midterm year into the year before the presidential election.
- Percent Profitable is 100%, with 8 winners and 0 losers in the historical sample.
- Median profit of 22.67% shows that typical outcomes have been solidly positive, not just skewed by outliers.
- A TradeWave Ratio of 2.3 indicates that price has historically traveled meaningfully in the long direction within the window.
- A Sharpe ratio of 2.14 points to strong risk-adjusted returns for this specific Amphenol trading window.
According to historical data from TradeWave.ai, this stretch of the calendar has behaved very differently for Amphenol than an average year. The next section walks through how that pattern has played out across past midterm-election cycles.
How has Amphenol (APH) traded in this midterm-year seasonal window?
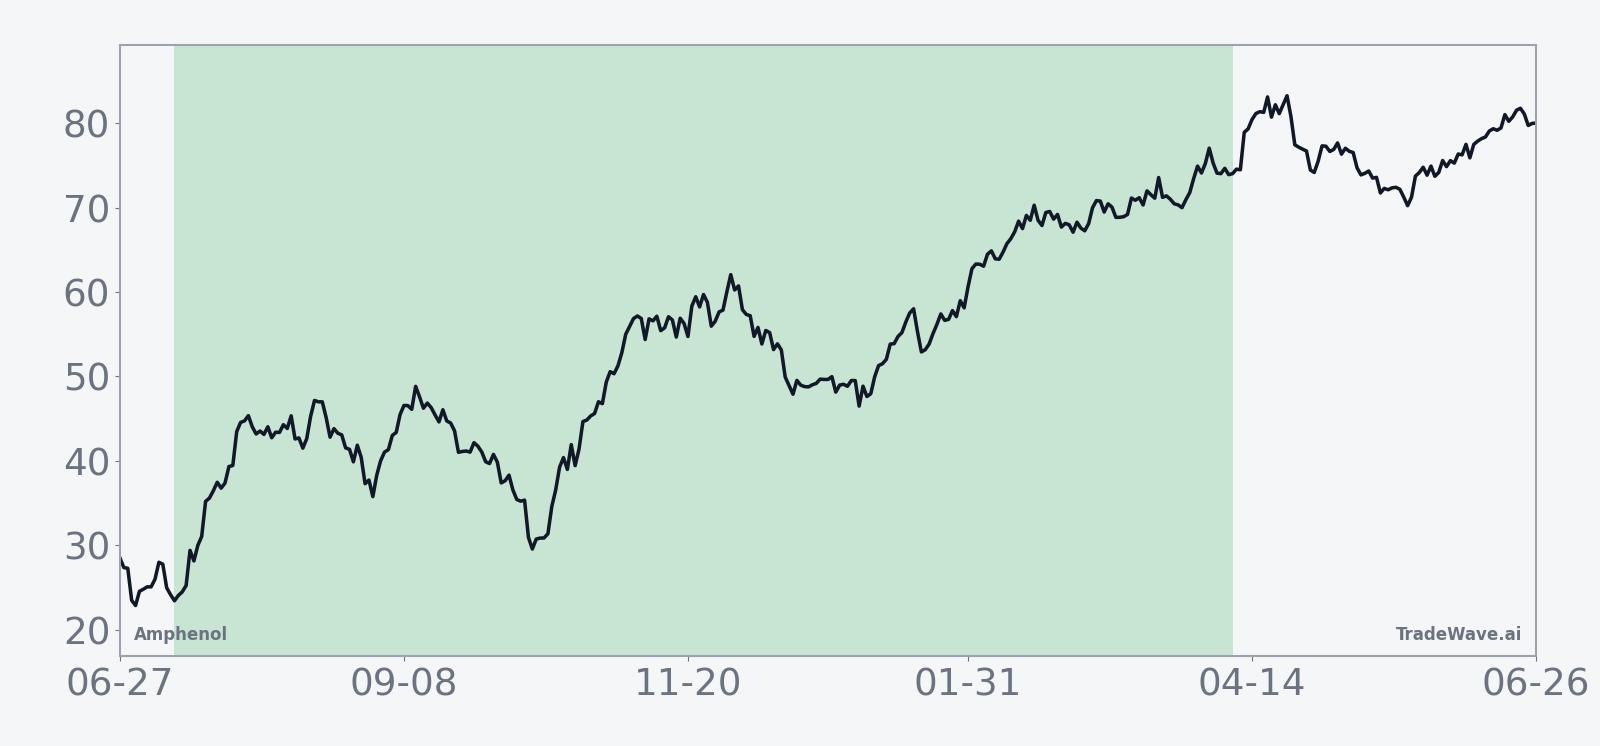
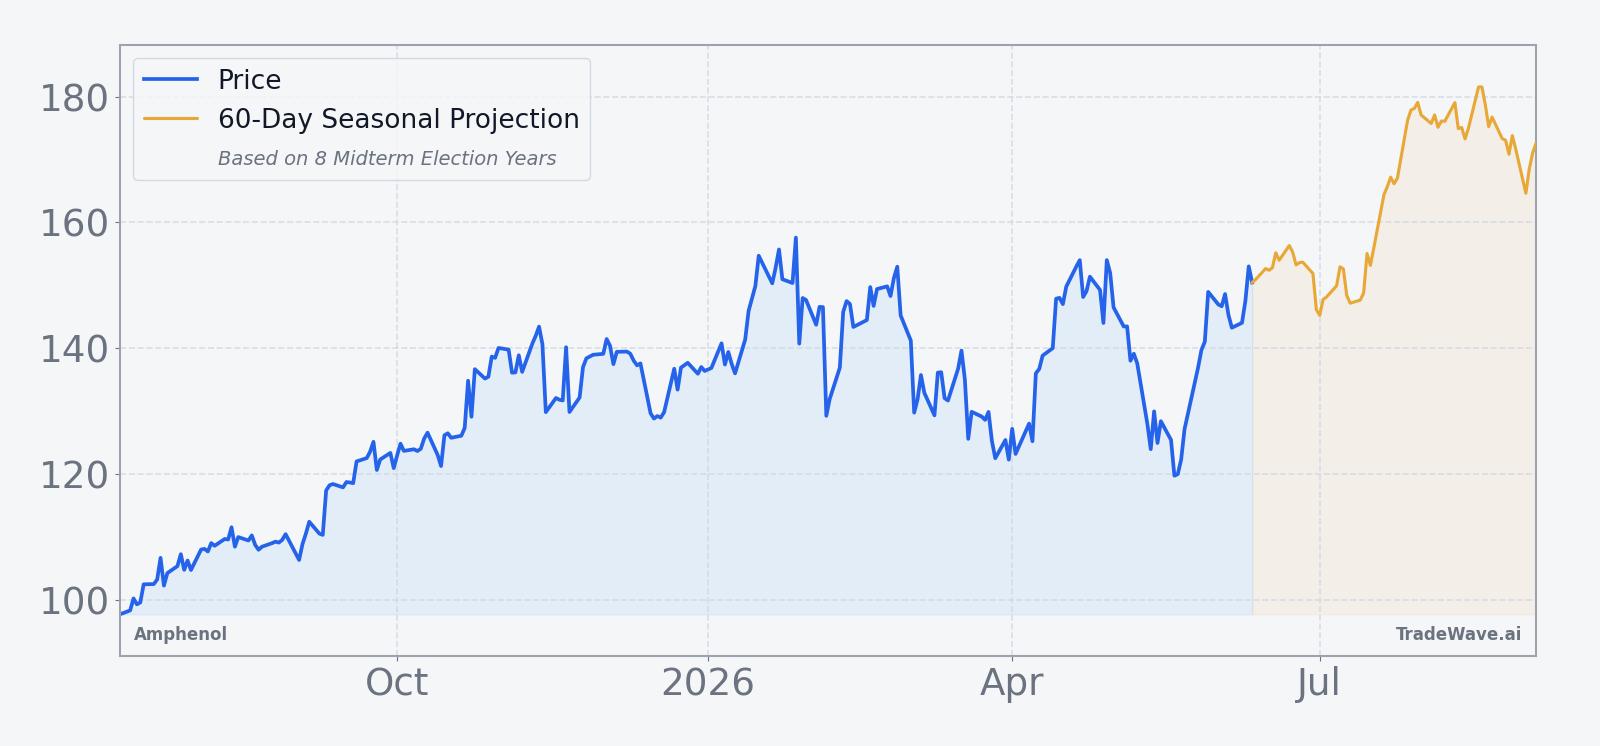
Amphenol has posted gains in all eight midterm-election-year windows that start around Jul 11 and run for roughly 273 trading days, averaging a 22.24% profit for long positions. Today the stock closed at 152.50, up 2.2% on the session and about 8.3% below its 52-week high of 166.38, leaving it elevated but not stretched on a one-year view. That combination of a strong historical seasonal trend and a stock sitting closer to its highs than its lows is what makes this upcoming window stand out for traders watching the APH seasonal trend.
Because this pattern is grouped by the presidential election cycle, it reflects how Amphenol has behaved specifically in the late part of midterm years as policy uncertainty peaks and then into the year before the presidential election, when risk appetite has often improved. For a communications and defense interconnect supplier tied into data centers and broadband buildouts, that timing lines up with budget cycles and capex decisions that tend to cluster around election calendars.
A second view layers in the best and worst intraperiod swings to show how far Amphenol has tended to travel inside the window.
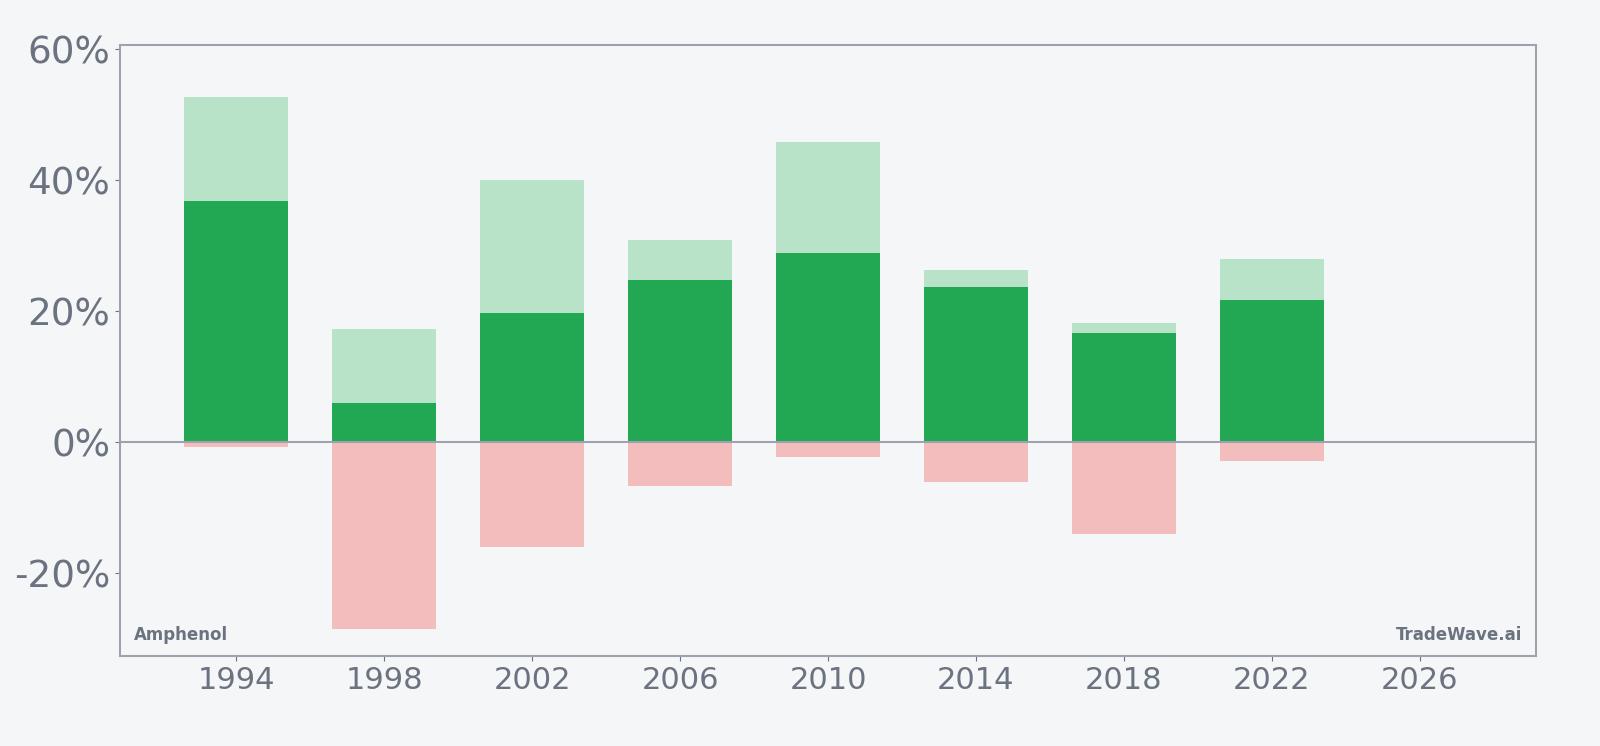
Across the eight historical midterm-year windows, the strongest year was 1994, when Amphenol gained 36.78% with a maximum favorable move of 52.75% from entry and only a shallow 0.7% worst drawdown. The softest outcome was 1998, which still finished up 5.96% but saw a maximum adverse excursion of 28.47%, showing that even winning years have included sharp pullbacks before recovering. More recent cycles such as 2010 and 2014 delivered gains of 28.87% and 23.64% respectively, with maximum favorable moves in the mid-20% to mid-40% range and single-digit to mid-teens drawdowns, consistent with a long pattern that has tended to reward patience but still tests conviction.
The cumulative return profile for this Amphenol trading window adds another layer. When you stack the eight cycles together, the average path trends higher in a relatively steady fashion rather than relying on one or two explosive years. That is consistent with the 21.95% annualized return and 389% cumulative return figure for the pattern, which point to a long-term seasonal bias rather than a one-off anomaly.
On a risk-adjusted basis, the Sharpe ratio of 2.14 is high for a single stock pattern, suggesting that the historical reward has been large relative to the volatility of end-of-window outcomes. The TradeWave Ratio of 2.3 indicates that, within the window, Amphenol has typically traveled meaningfully in the trade direction, which lines up with the sizable maximum favorable excursions seen in years like 1994, 2010 and 2014. At the same time, the presence of double-digit maximum adverse moves in several years shows that the ride has not been smooth, even if the final results have been positive.
History does not guarantee future results, and the maximum adverse excursions in prior cycles show that drawdowns inside the window can be large even when the final outcome is a gain.
Why does Amphenol (APH) follow this seasonal pattern?
One likely driver is the way Amphenol’s end markets line up with the political and fiscal calendar, with communications, broadband and defense customers often finalizing budgets and capex plans around midterm elections and into the following year.[2] Analysts have also pointed to AI-related data center buildouts and higher content per rack as multi-year themes, which can create waves of orders that cluster in specific parts of the cycle rather than arriving evenly through the year.[1] The pattern may also reflect institutional portfolio repositioning into quality industrial and electronics names as visibility on regulation and spending improves heading into the year before a presidential election.
What is driving Amphenol (APH) today?
Amphenol closed Friday at 152.50, up 2.2% on the day, after a strong month that has seen the stock gain 22.32% and push to within about 8.3% of its 52-week high. Trading volume of roughly 6.7 million shares came in below the 20-day average of about 11.0 million, suggesting the move was driven more by steady buying than a sudden surge in activity. The stock also sits comfortably above its 50-day moving average of 139.66, underscoring a firm uptrend heading into the heart of the midterm election year.
Fundamentally, the story investors are trading is still about connectivity and content growth in AI data centers. In October 2025, Bank of America upgraded Amphenol to Buy and lifted its price target, citing higher AI-related content per rack and expectations for sustained AI revenue growth into 2026, alongside a strong mergers-and-acquisitions cadence that has expanded the company’s footprint.[1] Earlier in 2025, Amphenol agreed to acquire CommScope’s broadband connectivity and cable unit for about $10.5 billion including debt and separately struck a roughly $1 billion deal for Trexon, moves that broadened its exposure to fiber, broadband and defense interconnects.[2][3] Those deals are part of a longer-term sector story in which Amphenol is positioning itself as a key supplier across communications and defense interconnects rather than a narrow niche player.[3]
The chart below situates the latest move in its recent multi-month context and overlays a short seasonal projection.
What should traders watch as this Amphenol seasonal window approaches?
First, the calendar: the next iteration of this 273-day Amphenol trading window begins on Jul 11, 2026, so the stock is still in the pre-window setup phase. Traders watching historical seasonality will be focused on how APH behaves if it retests the 166 area near its 52-week high before or just after that date, and whether pullbacks stay shallow relative to the double-digit maximum adverse moves seen in some past cycles. A firm hold above the 50-day moving average into July would be consistent with prior strong midterm-year starts, while a break back toward that line would echo the choppier years in the sample.
Second, the policy and spending backdrop matters for this particular election-cycle grouping. As the midterm election year progresses and the market looks ahead to the year before the presidential election, investors will be watching for signals on broadband funding, defense budgets and AI infrastructure capex that could reinforce or undercut the historical pattern.[2][3] If AI-related data center demand and higher content per rack continue to show up in orders and commentary, that would align with the strong average gains Amphenol has posted in prior iterations of this window.[1] Conversely, any signs of delayed projects or tighter budgets could make the next cycle look more like the lower-return years in the history, even if they still finished positive.
Finally, behavior inside the window will be the real test of the pattern. Historically, Amphenol has seen sizable intraperiod swings, with some years experiencing drawdowns of more than 20% before finishing higher, so traders will be watching whether any early weakness is bought or whether selling pressure persists. If the stock can navigate those swings while maintaining its long-term uptrend, it would extend a rare 8-for-8 seasonal record into a ninth midterm-election cycle.
Sources
- [1] Bank of America upgrades Amphenol to Buy and raises price target to $150 (LSEG / CNBC via articles, Oct 15, 2025).
- [2] Amphenol set to acquire CommScope unit in $10.5B deal - report (Seeking Alpha, Aug 4, 2025).
- [3] Amphenol to Buy Trexon From Audax Private Equity for $1 Billion (The Wall Street Journal, Aug 18, 2025).
About this seasonal analysis
Seasonal pattern data is sourced from TradeWave.ai, which analyzes historical price behavior across annual calendar windows going back up to 30 years. Read the full data methodology or the book The 100-Year Pattern by Afshin Moshrefi (2026 edition). Past performance of seasonal patterns does not guarantee future results. This article is for informational purposes only and does not constitute investment advice.