Less Than 2% From Highs, Altria (MO) Enters 90% Profitable Midterm-Year Summer Stretch
Altria is trading just below a fresh 52-week high as it heads into a historically strong 58-day midterm-year seasonal window that has often rewarded long positions.

What is the seasonal pattern for Altria (MO)?
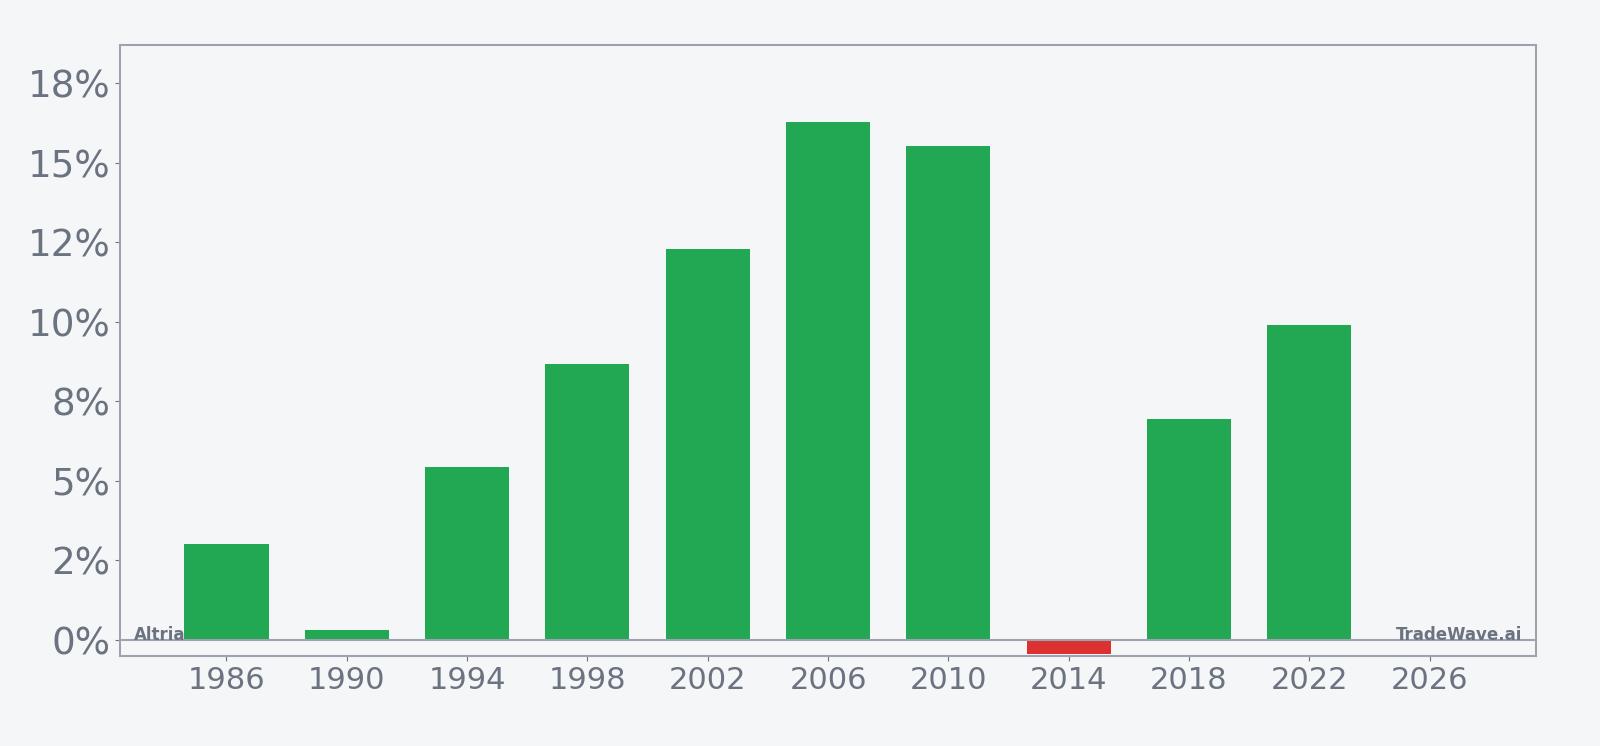
Altria has risen in 9 of 10 years during this midterm-year summer window, with an average gain of 8.88% in winning years.
- 9 for 10 in this window, averaging 8.88% gains in winning years across the last 10 midterm election cycles.
- Seasonal window begins Jun 22, 2026 and runs for 58 trading days, with a long trade direction bias.
- Percent Profitable is 90%, with 9 winners and 1 loser over the historical sample.
- Average profit across all years, including the lone losing year, is 8%, pointing to a strong bullish seasonal trend.
- Maximum favorable moves have often reached double digits, while adverse moves have typically stayed in the low- to mid-single digits.
- Altria is approaching this historically strong Altria trading window while sitting less than 2% below its 52-week high.
According to historical data from TradeWave.ai, this upcoming stretch has behaved very differently from an average summer for Altria. The next section walks through how that midterm-year seasonal pattern has played out in prior cycles.
How has Altria (MO) traded in this midterm-year summer window?
Altria has risen in 9 of the last 10 midterm election years during this 58-day summer window, averaging 8.88% gains in the winning years. The next iteration of that window begins on Jun 22, 2026, with the stock currently around $73.13, about 1.9% below its 52-week high of $74.56.[4]
Because this pattern is grouped by the presidential election cycle, it reflects how Altria has behaved in the last 10 midterm election years rather than in 10 consecutive calendar years. That matters for a regulated consumer staple like tobacco, where tax policy, FDA actions and investor positioning often follow a four-year rhythm tied to Washington’s agenda.
Historically, this 58-day window has been a bullish seasonal stretch for a long bias in Altria. Percent Profitable sits at 90%, with 9 winners and just 1 losing year, and the average outcome across all years is an 8% gain, only slightly below the 8.88% average for winners alone. That small gap between winner-only and all-years averages tells you the lone losing year, 2014, was modest at about a 0.45% decline, while the stronger years such as 2006 and 2010 posted mid-teens gains.
The per-year table shows how those returns have clustered. In 2006 Altria gained 16.27% in the window, with a maximum favorable move of 16.93% and a shallow maximum adverse move of about 1.39%. In 2010 the stock added 15.52%, again with a maximum favorable excursion near 15.82% and only a 1.61% worst drawdown from entry. Even in more volatile backdrops like 2002, the stock finished up 12.29% despite a double-digit intraperiod drawdown, underscoring that some years required sitting through meaningful swings before the pattern paid off.
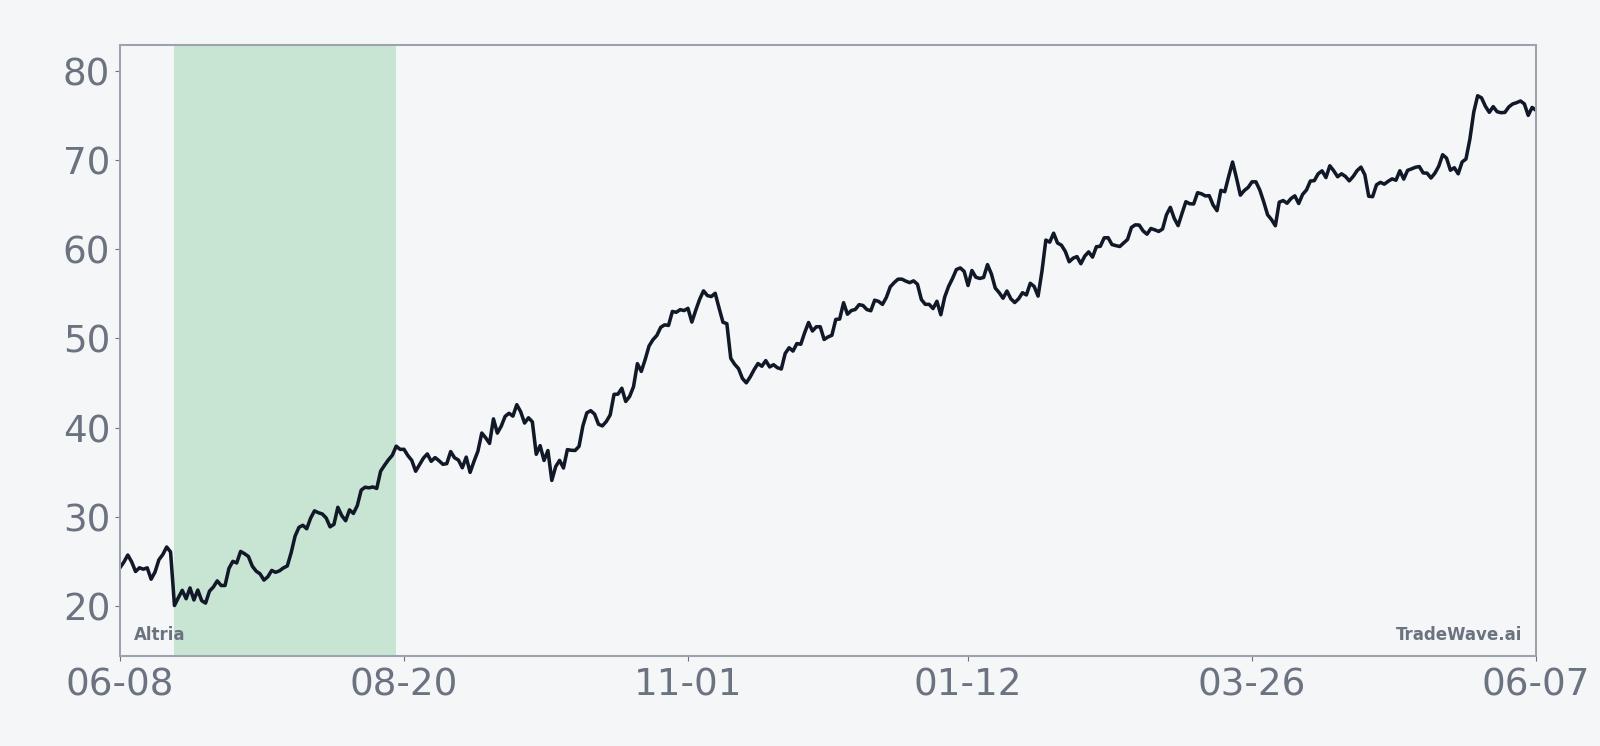
The historical seasonal average trend for this window slopes higher in a relatively steady fashion, with gains tending to build through the middle of the period rather than spiking only at the start or end. That profile suggests a grind-up pattern where pullbacks have historically been bought, consistent with a long trade direction that has worked in most midterm years.
A combined view of net returns with peak run-ups and worst drawdowns shows how much room Altria has typically had to move inside this window.
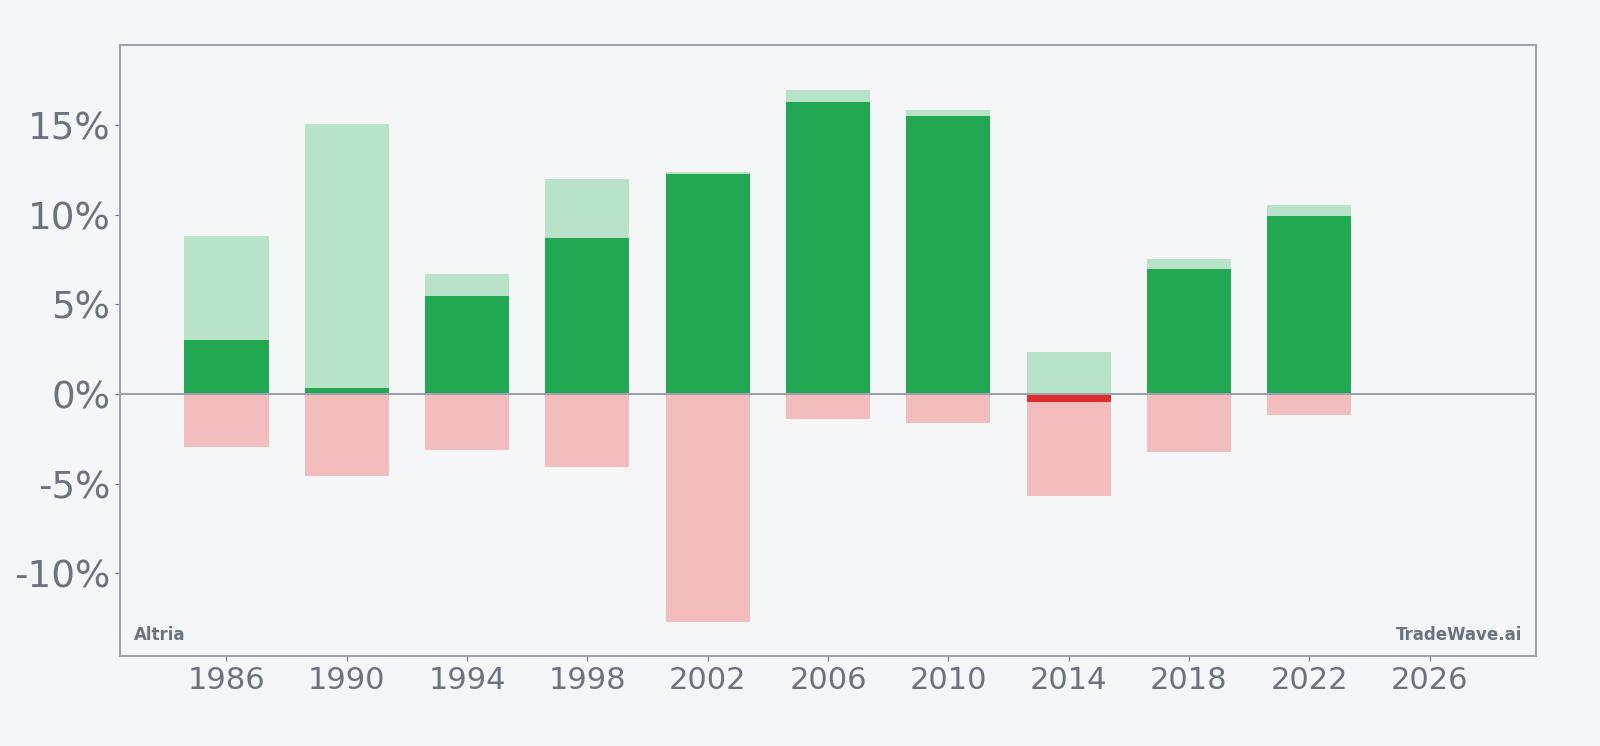
The combined net/MFE/MAE bars show that in most years Altria’s maximum favorable excursion has pushed into high single or low double digits, while maximum adverse excursions have usually stayed in the low- to mid-single digits. The outlier is 2002, where the worst drawdown reached about 12.72% even though the trade finished positive, a reminder that this historically strong MO seasonal trend has still involved real volatility at times. Add it up: 9 winners out of 10, mid- to high-single-digit typical gains, and a track record of intraperiod swings that long holders have had to tolerate.
History does not guarantee future results, and even in winning windows the worst intraperiod drawdown (MAE) can be large enough to challenge risk limits.
Why does Altria (MO) follow this seasonal pattern?
One likely driver is the way midterm-year policy risk and tax debates cluster in the first half of the year, leaving late-summer windows like this one to trade more on fundamentals and income demand. Analysts have pointed to steady dividend growth and defensive cash flows as reasons income-focused investors often rotate into tobacco stocks during calmer stretches of the political calendar.[1] This pattern may also reflect portfolio rebalancing by institutions that top up high-yield consumer staples as they look ahead to year-end distributions in the second half of midterm years.
What is driving Altria (MO) today?
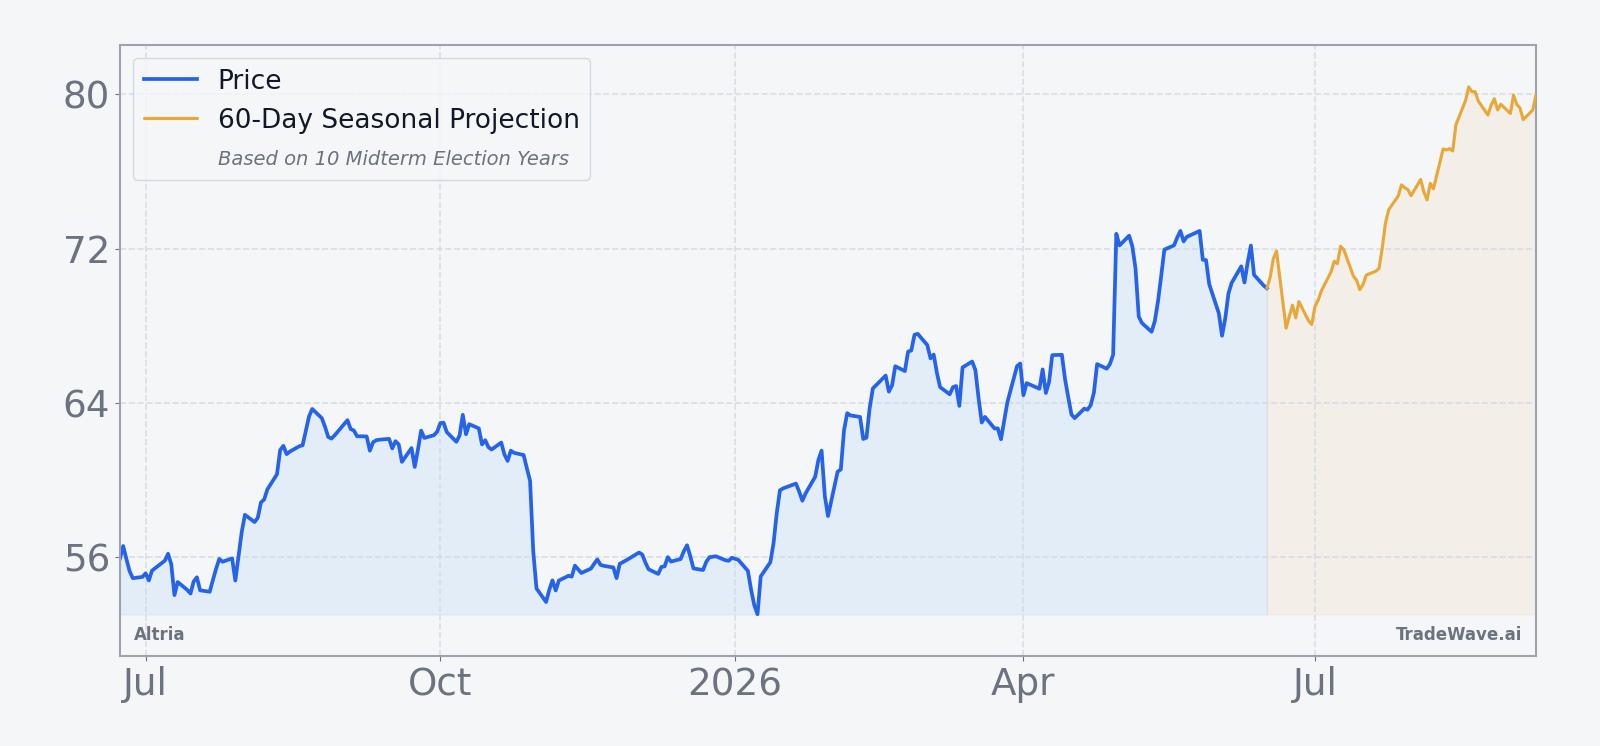
Altria shares last traded around $73.13, up about 2% on the day and sitting roughly 1.9% below their 52-week high of $74.56, after a steady climb that has pushed the stock well above its 50-day moving average of $69.32 and left it with a 4.64% gain over the past month.[4] The latest leg higher followed a strong first-quarter report on Apr 30, 2026, when the company posted $5.43 billion in revenue and adjusted earnings of $1.32 per share, topping consensus estimates and sparking a sharp rally as traders responded to easing Marlboro share losses and firm pricing power.[4]
On that earnings day, Altria’s stock jumped as investors focused on how higher cigarette prices and growing demand for oral nicotine pouches were offsetting volume declines in traditional smokable products.[4] The company framed the results as evidence that its strategy of leaning into smoke-free products while defending its core cigarette franchise can still deliver mid-single-digit earnings growth, even as U.S. cigarette shipment volumes trend lower over time.[4] That narrative has helped keep the stock near multi-year highs despite a regulatory backdrop that remains challenging for the broader tobacco sector.
In the background, U.S. cigarette volumes have been sliding for years, pressuring revenue across the industry and forcing incumbents like Altria to rely more on pricing and product mix to sustain earnings.[2] The company has highlighted the FDA’s authorization of additional on! PLUS oral nicotine pouch variants as a key plank in its smoke-free transition, though those products still represent a relatively small share of total sales.[2] For investors, the tension between secular volume decline and resilient cash generation is central to any stock pattern analysis of Altria, especially as the stock trades near its 52-week high heading into a historically strong seasonal window.
The chart below situates the latest move in its recent multi-month context alongside a 60-day seasonal projection.
What should traders watch as this Altria seasonal window opens?
First, watch how Altria behaves around the Jun 22 start date relative to its 52-week high zone near $74.56.[4] A firm hold above the 50-day moving average and continued respect for that resistance band would be consistent with prior midterm-year windows where the stock ground higher rather than breaking sharply.
Second, monitor upcoming headlines around regulation and smoke-free products, since any surprise FDA actions or tax proposals could disrupt the usual midterm-year seasonal pattern.[2] Historically, this 58-day window has delivered gains even in years with policy noise, but the 2002 example shows that intraperiod drawdowns can be deep when macro or regulatory shocks hit.
Third, pay attention to volume and price reaction on any follow-up commentary from management about the Q1 beat and the trajectory of Marlboro share losses.[4] If the stock continues to attract buyers on dips and holds its recent breakout levels through the heart of the window, that would align with the 9-for-10 historical record for longs. A failure back below the 50-day moving average with heavy selling would be an early sign that this cycle might rhyme more with the lone losing year in the sample than with the typical midterm-year summer rally.
Sources
- [1] Seeking Alpha, "Altria aims for 'progressive' dividend rate growth" (Jan 29, 2026).
- [2] Forbes, "Is Altria Stock A Value Play Or A Yield Trap At $60?" (Jan 30, 2026).
- [3] The Wall Street Journal, "Altria Stock at 6-Year High After Outlook Lift" (Jul 30, 2025).
- [4] Reuters, "Cigarette maker Altria gets a boost as Marlboro losses ease" (Apr 30, 2026).
- [5] The Wall Street Journal, "Altria Sales Rise, Boosted by Higher Cigarette Prices" (Apr 30, 2026).
About this seasonal analysis
Seasonal pattern data is sourced from TradeWave.ai, which analyzes historical price behavior across annual calendar windows going back up to 30 years. Read the full data methodology or the book The 100-Year Pattern by Afshin Moshrefi (2026 edition). Past performance of seasonal patterns does not guarantee future results. This article is for informational purposes only and does not constitute investment advice.