ConocoPhillips (COP) Has Fallen in All 8 Jul 29-Aug 3 Windows, Averaging 4.28% Short Profit
ConocoPhillips is trading in the upper half of its 52-week range as it heads into a late-July window that has reliably tilted lower just as earnings hit.
Price as of Jul 22, 2026: $118.79 (last close).

What is the seasonal pattern for ConocoPhillips (COP)?
ConocoPhillips has fallen in 8 of 8 years during the Jul 29 to Aug 3 window, with an average gain of 4.28% in winning years for a short trade.
- 8 for 8 in this window, with a short trade averaging 4.28% profit across winning years.
- The late-July COP seasonal window runs from Jul 29 to Aug 3 and has historically favored downside moves.
- Percent Profitable is 100%, with 8 winners and 0 losers for the short-direction pattern.
- Cumulative return from repeating this 6-day short window each year compounds to 39% over the past 8 years.
- The TradeWave Ratio of 2.48 signals that price has typically traveled meaningfully in the trade direction within the window.
- Intraperiod swings can be sharp, with several years showing multi-point drawdowns before the short ultimately worked.
According to historical data from TradeWave.ai, this late-July stretch has behaved very differently from an average week on the COP calendar. The next section walks through how that pattern has played out and where it sits against today’s setup.
How has ConocoPhillips (COP) traded in the late-July seasonal window?
ConocoPhillips has closed lower in every single Jul 29 to Aug 3 window for the past eight years, a perfect 8-for-8 record for short positions. The stock finished Thursday at $118.79, up 1.1% on the day and sitting about 11.3% below its 52-week high and 45.8% above its 52-week low, leaving plenty of room in both directions. That combination of a clean downside seasonal trend and a mid-range price zone makes this upcoming six-day COP trading window one of the more unusual patterns on the energy calendar.
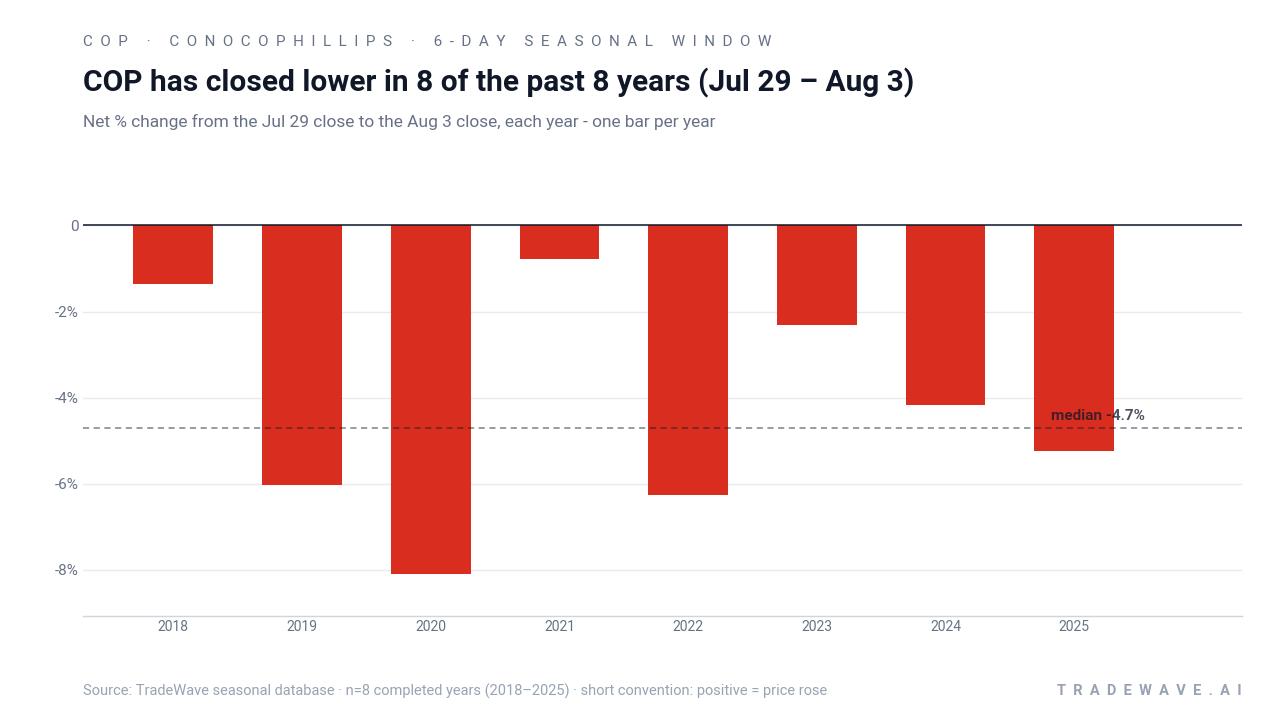
TradeWave’s stats frame this as a clean short-direction pattern. Percent Profitable sits at 100%, with 8 winners and 0 losers, and the average profit for those short trades is 4.28% over just six calendar days. The all-years average is essentially the same at 4%, since there have been no losing years in the sample. Median profit of 4.71% shows that the typical outcome has been a mid-single-digit slide rather than a one-off outlier.
The per-year table shows how that has played out in practice. In 2020, a short entered on Jul 29 and exited on Aug 3 would have captured an 8.09% drop, with the best intraperiod move (the maximum favorable excursion) reaching 3.68% and the worst drawdown (the maximum adverse excursion) stretching to 10.11%. In 2021, the same window delivered a smaller 0.77% gain for shorts, with a modest 1.19% best run and a 4.5% worst drawdown, underscoring that even “easy” windows can involve uncomfortable back-and-forth.
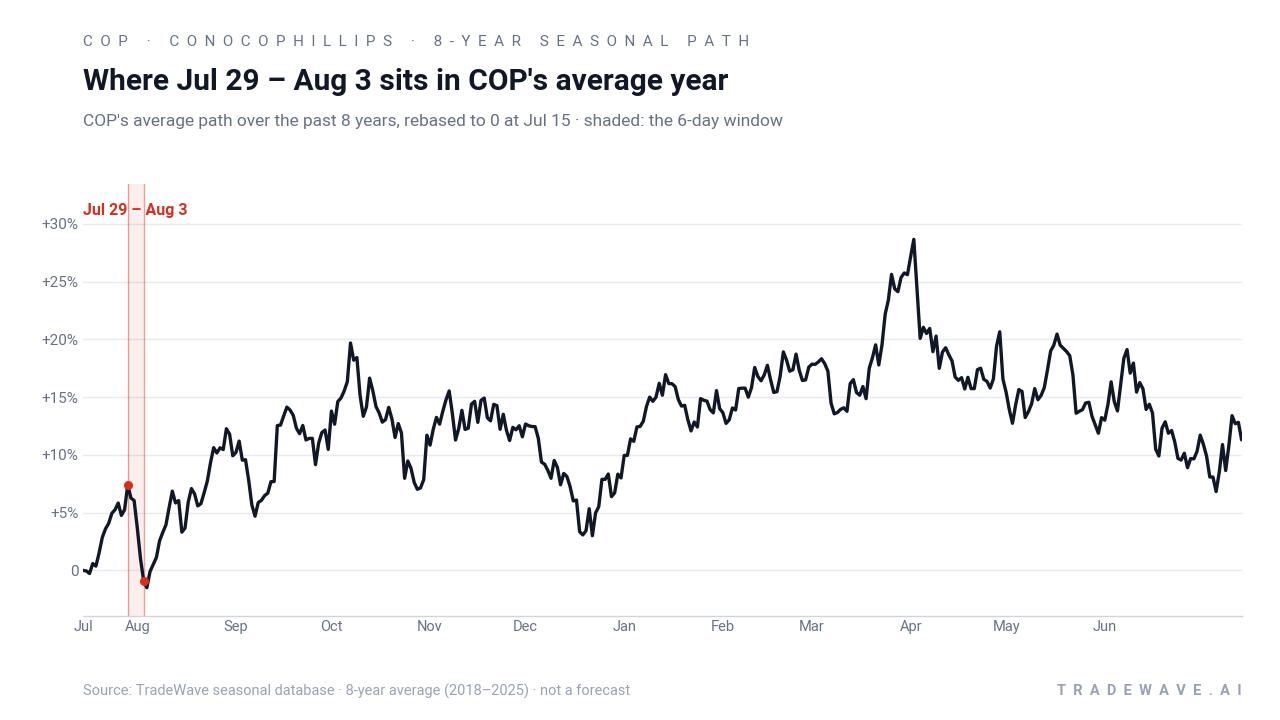
Year-by-year ranges highlight how far COP has tended to swing inside this six-day stretch.
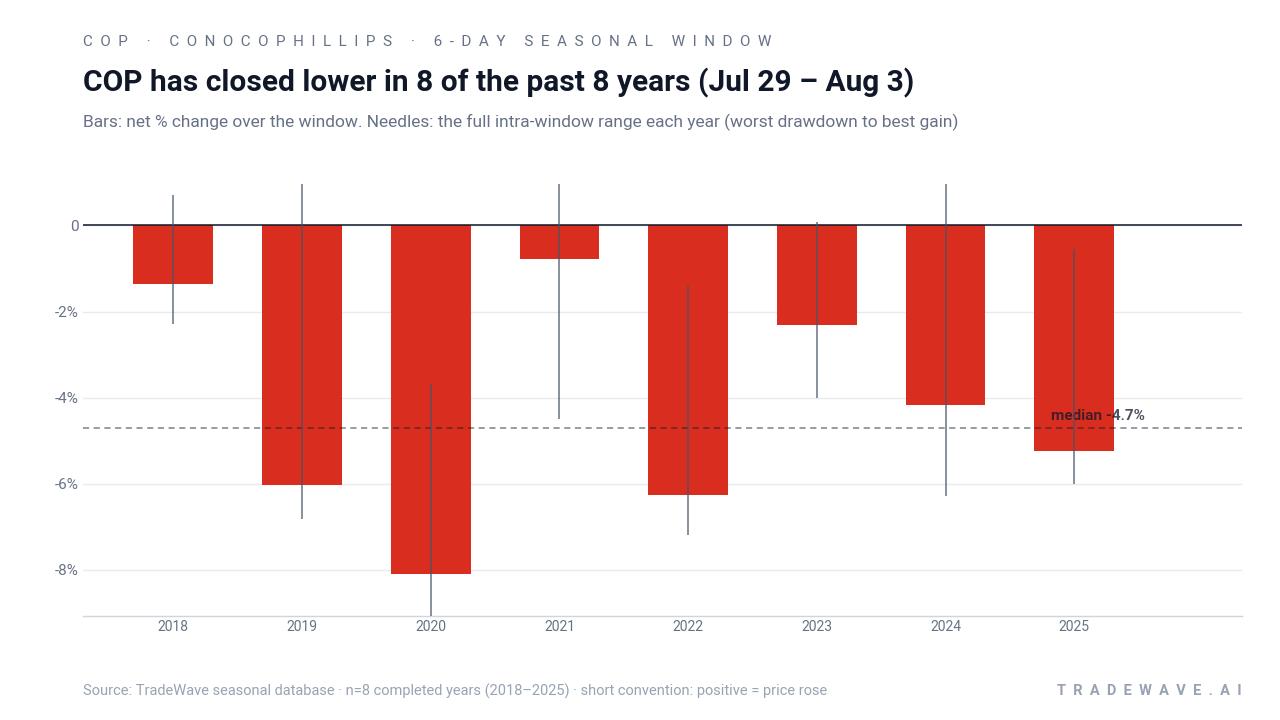
The bars-and-needles view makes the volatility profile clear. In several years, the full intraperiod range from worst drawdown to best gain has spanned more than 6%, even though the final net move still favored the short side. That is consistent with a TradeWave Ratio of 2.48, which signals that price has typically traveled meaningfully in the trade direction within the window, not just drifted lower by a fraction. Stacking the window year after year compounds to a 39% cumulative gain for the short strategy, which is a striking result for a six-day slice of the calendar.
History does not guarantee future results; adverse excursions (MAE) can be large even in winning windows.
Why does ConocoPhillips (COP) follow this seasonal pattern?
One likely driver is the way COP’s earnings calendar and guidance updates cluster around late July and early August, which can trigger position squaring in an already volatile energy tape. Analysts have also pointed to crude price seasonality and summer refinery runs, which can shift sentiment on exploration and production names in tight windows. This pattern may reflect a mix of traders fading pre-earnings optimism and institutions rebalancing energy exposure as new production and capital-spending guidance lands.
What is driving ConocoPhillips (COP) today?
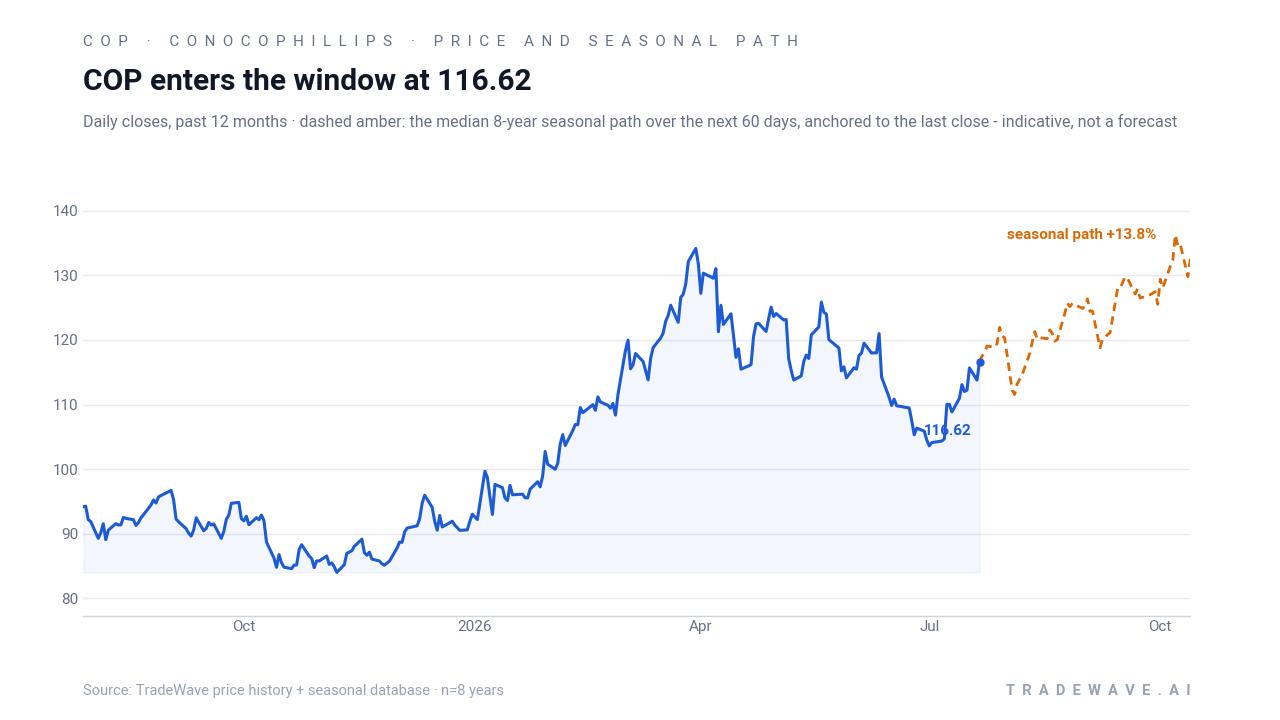
ConocoPhillips shares closed Thursday at $118.79, up 1.1% on the session, leaving the stock about 11.3% below its 52-week high of roughly $133.87 and 45.8% above its 52-week low near $81.50. The move comes ahead of the company’s next earnings report on Aug. 6, when management is expected to update investors on free cash flow, asset sales and the dividend path for the rest of the year.[1]
The near-term fundamental backdrop is constructive. In November 2025, ConocoPhillips beat quarterly profit estimates and raised its full-year 2025 production forecast, while lifting its ordinary dividend by 8% to $0.84 per share, reinforcing its income profile for investors.[1] Earlier that year, the company also announced deep layoffs and identified more than $2 billion in cost reductions and acquisition synergies, signaling a push for tighter capital discipline and potentially higher margins over time.[2] Separate reporting in February 2026 noted that ConocoPhillips was exploring a sale of some Permian Basin assets that could fetch about $2 billion, part of a broader plan to reach $5 billion in asset dispositions by the end of 2026 and streamline the portfolio.[3]
On the macro side, COP’s outlook remains tightly linked to crude benchmarks. Analysts have framed the company’s long-term free cash flow targets around scenarios such as $70 WTI and roughly $90 Brent, with major growth projects in areas like Qatar’s North Field and U.S. LNG expected to underpin returns if those price decks hold.[4] Sector commentary continues to cast ConocoPhillips as a high-quality, low-cost inventory story within exploration and production, with large-scale projects such as Willow and Port Arthur positioned as multi-year growth engines rather than short-term trading catalysts.[5]
Wall Street’s stance reflects that backdrop. Across several analyst roundups, ConocoPhillips screens as a Buy-rated name and a favored dividend-and-buyback play for investors seeking steady income from the energy patch.[6][7][8][9] Those pieces, published between late 2025 and mid-2026, highlight the company’s combination of shareholder distributions, project pipeline and balance-sheet flexibility as reasons it features on income-focused lists.
The chart below situates the latest move in its recent multi-month context and overlays the median seasonal path for the next two months.
Sources
- Reuters: ConocoPhillips lifts dividend, raises output forecast after profit beat (Nov 6, 2025)
- Reuters: ConocoPhillips' deep layoffs highlight need for capital discipline, analysts say (Sep 8, 2025)
- Reuters: ConocoPhillips considers selling Permian assets worth $2 billion, Bloomberg News reports (Feb 20, 2026)
- CNBC: Top Wall Street analysts recommend these stocks for consistent income (Feb 15, 2026)
- CNBC: Top analysts suggest these 3 dividend stocks for steady income (Jul 19, 2026)
- CNBC: Top Wall Street analysts recommend these dividend stocks for stable income (Nov 30, 2025)
- CNBC: Top Wall Street analysts pick these 3 stocks for reliable income (Apr 26, 2026)
About this seasonal analysis
Seasonal pattern data is sourced from TradeWave.ai, which analyzes historical price behavior across annual calendar windows going back up to 30 years. Read the full data methodology or the book The 100-Year Pattern by Afshin Moshrefi (2026 edition). Past performance of seasonal patterns does not guarantee future results. This article is for informational purposes only and does not constitute investment advice.