HP Inc. (HPQ) Earnings Beat Sparks Double-Digit Jump Ahead of Bullish Midterm Stretch
HP Inc. is heading toward a historically strong 194-day trading window even as the stock trades well below its 52-week high, setting up a notable test of its midterm-year seasonal trend.
Price as of Jul 16, 2026: $24.14 (last close).
What is the seasonal pattern for HP Inc. (HPQ)?
HP Inc. has risen in 8 of 10 midterm-election-year windows starting Aug. 12, with an average gain of 28.55% in winning years.
- 8 for 10 in this window, with winning years averaging 28.55% gains and a 21% average when all years are included.
- Seasonal window begins Aug. 12 and runs 194 trading days across the last 10 midterm election years.
- Percent Profitable is 80%, with 8 winners and 2 losers in the historical HPQ seasonal trend.
- Avg Profit reflects winners only, while Avg Profit - All shows how losses pull the overall average down.
- TradeWave Ratio of 1.54 suggests price has typically traveled meaningfully in the long direction during this HP Inc. trading window.
- Sharpe ratio of 1.03 points to a historically favorable risk-adjusted profile, but losing years have still seen sizable drawdowns.
According to historical data from TradeWave.ai, this upcoming stretch for HP Inc. has behaved very differently from an average half-year on the calendar. The next section walks through how that midterm-year pattern has played out in prior cycles.
How has HP Inc. (HPQ) traded in this midterm-year seasonal window?
HP Inc. has risen in 8 of the last 10 midterm-election-year windows that start on Aug. 12 and run for 194 trading days, with winning years averaging gains of 28.55%. Today the stock closed at 24.14, up 1.6% on the day and sitting about 16.6% below its 52-week high of 28.94, leaving room above if the historical pattern repeats.
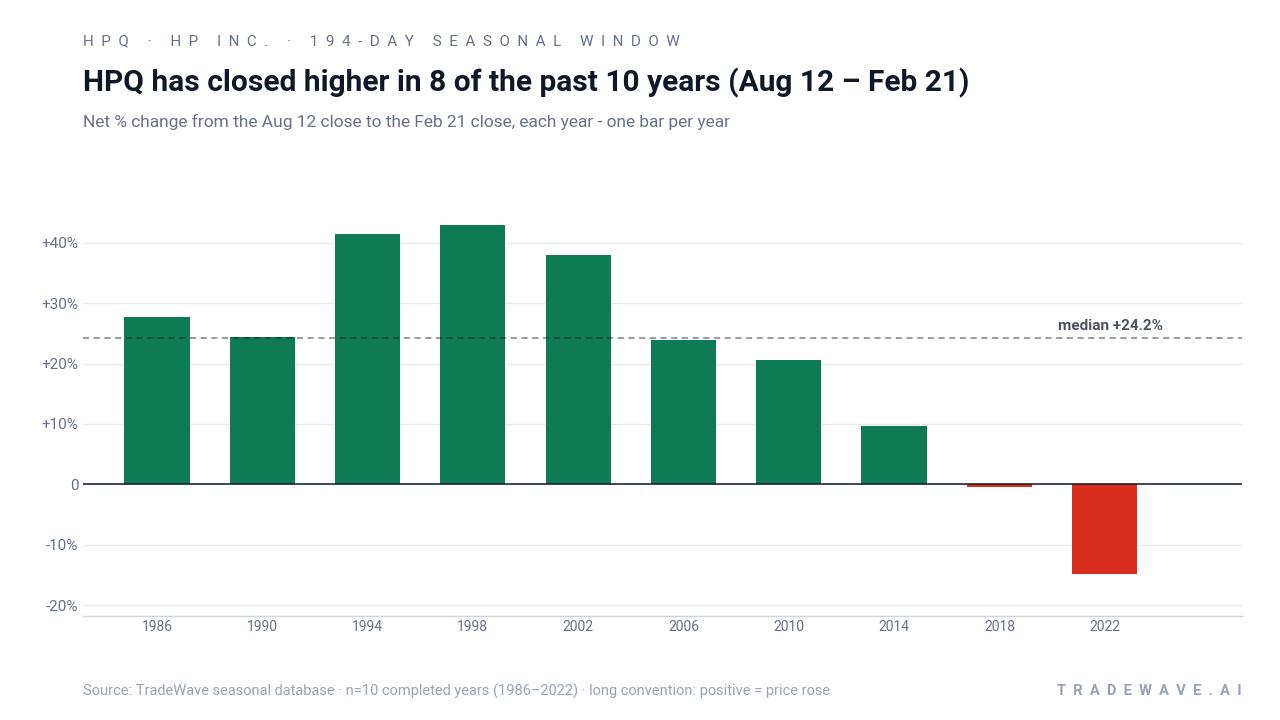
The grouping by presidential election cycle matters here because this window captures how HPQ has behaved in the midterm election year as policy risk peaks and markets start to look ahead to the pre-election year, which has often been friendlier for equities. In other words, this is the bridge between mid-cycle volatility and the historically stronger year before the presidential election.
Across those 10 midterm-year samples, the long trade direction has been rewarded more often than not. Percent Profitable sits at 80%, with 8 winners and 2 losers, and the all-years average gain of 21% shows that even after accounting for the down years, the HPQ seasonal trend in this window has skewed positive. The median profit of 24.16% is close to the average, which suggests the gains have not been driven by just one outlier year.
The per-year table shows some standout runs. In 1998 HPQ gained 42.86% in this window, with a maximum favorable move of 62.2% from the entry price before giving some of it back by the close. In 2002 the stock posted a 37.92% net return with a 60.92% peak run-up, while the worst drawdown from entry in that year was a 17.47% adverse move, a reminder that even strong years have not been straight lines.
The losing years underline the risk side of this midterm-year pattern. In 2018 HPQ finished the window down 0.46% after a 14.43% intraperiod rally and an 18.21% worst drawdown from entry. In 2022 the stock lost 14.79% in this same calendar slice, with only a 1.93% best run-up and a deep 29.89% adverse excursion, showing how a weak tape can overwhelm the usual seasonal tailwind.
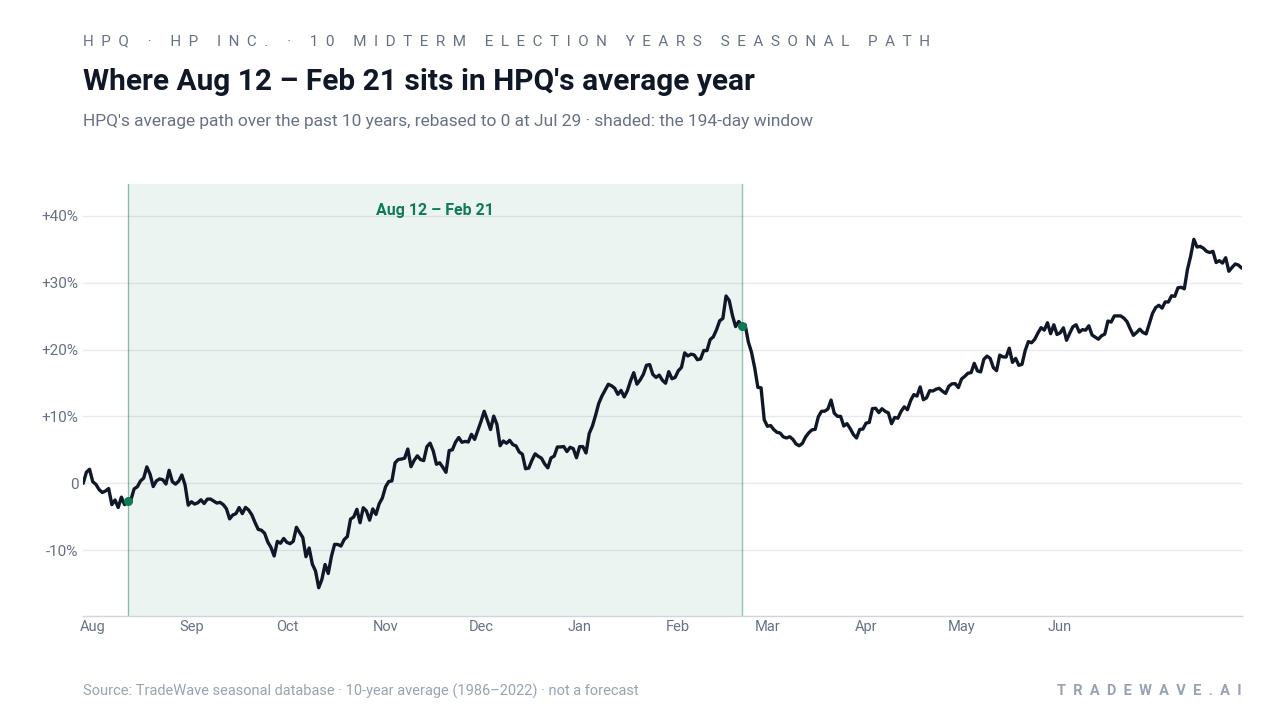
The historical seasonal average trend line slopes higher across most of the 194 trading days, with gains tending to build rather than spike and fade. The profile suggests that in prior midterm years, strength has often persisted into the later part of the window as markets transition toward the year before the presidential election.
A closer look at yearly net returns alongside peak rallies and worst drawdowns shows how much room there has been on both the upside and downside.
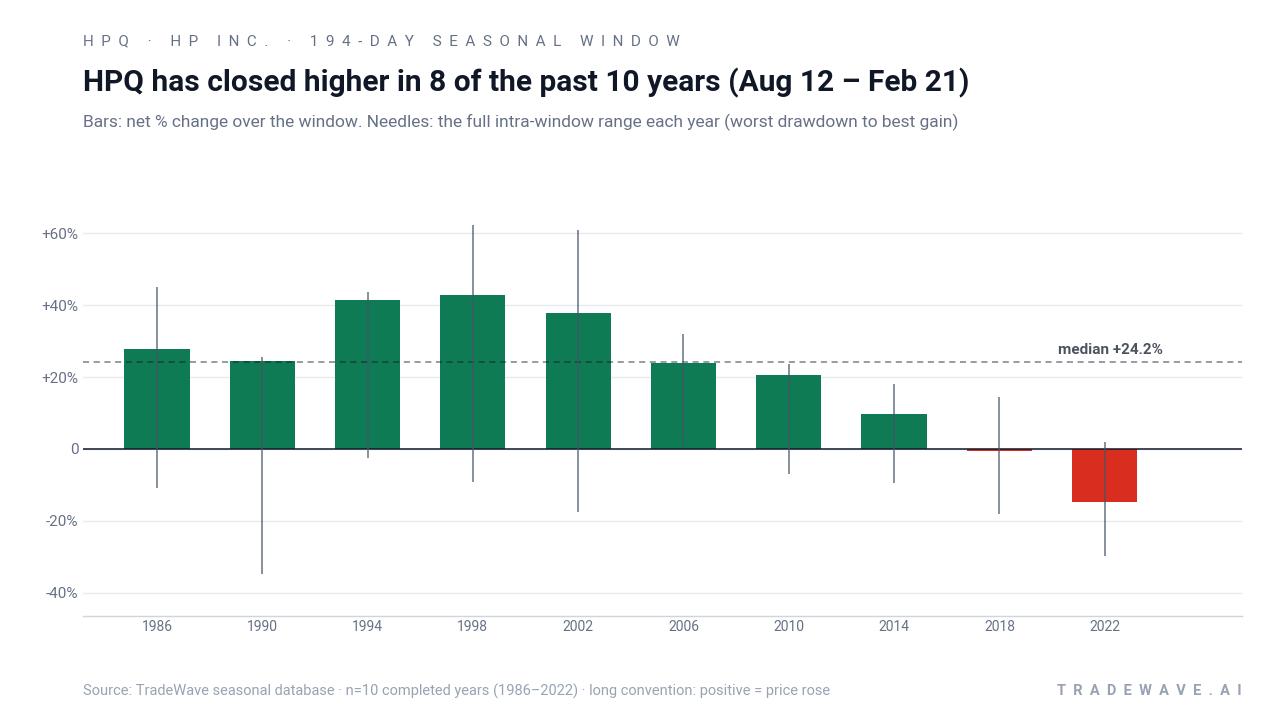
The stacked net, MFE and MAE bars show that in most winning years, HPQ has seen sizable peak rallies relative to its final gain, while adverse moves have usually been smaller but still meaningful. In the two losing years, the MAE bars dominate, especially in 2022, where the worst drawdown approached 30%, underscoring that this historically bullish window has still carried real downside risk when the broader backdrop turned against the stock.
History does not guarantee future results; adverse excursions (MAE) can be large even in winning windows.
Why does HP Inc. (HPQ) follow this seasonal pattern?
One likely driver is the clustering of HP’s fiscal-year reporting and guidance updates around the late-summer and winter period, which can reset expectations for PC and printing demand. This window also overlaps a stretch when institutional investors often rebalance tech and hardware exposure ahead of the year before the presidential election, a phase that has historically been more risk-on for equities. The combination of earnings catalysts and portfolio repositioning may help explain why HPQ has tended to trend higher across this specific midterm-year slice, even though individual years can still diverge sharply.
What is driving HP Inc. (HPQ) today?
HP Inc. shares closed Friday at 24.14, up 0.39 on the day for a 1.6% gain, after trading between 23.38 and 24.18 on volume of about 13.6 million shares. That leaves the stock about 16.6% below its 52-week high of 28.94 and roughly 45.4% above its 52-week low of 16.60, with the 50-day moving average near 23.22 and 20-day average volume around 16.3 million shares. The stock is still digesting a sharp move from May 27, when HP reported earnings and revenue that beat expectations and the shares jumped by double digits on the day, as highlighted in a CNBC segment covering the results.[1]
The chart below situates the latest move in its recent multi-month context alongside a short-term seasonal projection.
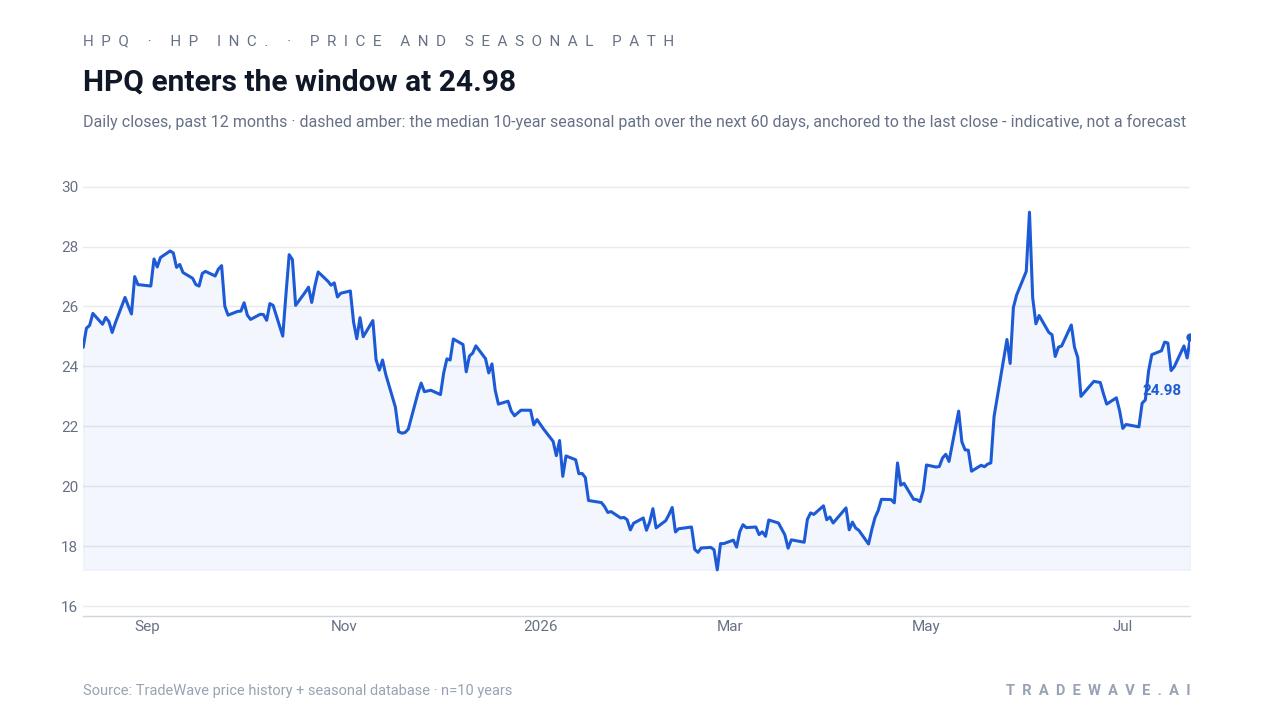
From here, the key question for traders is how HPQ behaves as the Aug. 12 midterm-year window approaches. If the stock can hold above its 50-day moving average and start to build higher lows into that date, it would be more in line with the historical pattern of strength. A failure back toward the low 20s, especially on rising volume, would signal that this cycle may be tracking closer to the weaker 2018 or 2022 playbook rather than the strong midterm-year rallies seen in the 1990s and early 2000s.
What should traders watch as this HPQ seasonal window approaches?
First, the calendar: the 194-day midterm-year window begins on Aug. 12, so price action in the next few weeks will set the starting point for any seasonal move. A firm base above the 50-day moving average would give the pattern more room to work, while a break back toward the mid-teens would compress the upside but also raise the risk of a repeat of the 2022-style drawdown.
Second, watch how HPQ trades around its next fundamental updates, including any follow-on commentary from management after the May earnings beat.[1] Stronger demand signals for PCs, printing and AI-adjacent workloads would align with the historical bullish bias in this window, while cautious guidance or margin pressure could tilt the setup toward one of the two losing years in the sample.
Third, monitor the broader tech and hardware tape as the midterm election year moves into its back half. If investors rotate back into value and cash-generative names while policy uncertainty begins to fade, HPQ’s historical midterm-year seasonal pattern suggests it has often participated meaningfully in that shift. If instead the market leans away from cyclical hardware and toward other themes, the stock’s path through this window could look much choppier than the average trend line implies.
Sources
About this seasonal analysis
Seasonal pattern data is sourced from TradeWave.ai, which analyzes historical price behavior across annual calendar windows going back up to 30 years. Read the full data methodology or the book The 100-Year Pattern by Afshin Moshrefi (2026 edition). Past performance of seasonal patterns does not guarantee future results. This article is for informational purposes only and does not constitute investment advice.