Abbott Laboratories (ABT) Has Rallied in 10 of 10 Midterm Windows Starting Jul. 20
Abbott Laboratories is hovering near $100 just as it enters a 275-day midterm-election-year seasonal window that has never been negative in the last 10 cycles, adding a powerful historical backdrop to its post-earnings momentum and diagnostics story.
Price as of Jul 20, 2026: $100.59 (intraday).

What is the seasonal pattern for Abbott Laboratories (ABT)?
Abbott Laboratories has risen in 10 of 10 midterm-election-year windows starting around Jul 20, with an average gain of 18.33% in winning years.
- 10 for 10 in this window, with winning years averaging 18.33% gains across a 275-day stretch.
- Percent Profitable is 100%, with 10 winners and 0 losers in the last 10 midterm-election-year cycles.
- The trade direction is long, aligning the historical ABT seasonal trend with bullish exposure during this window.
- The TradeWave Ratio (TWR) of 1.81 indicates that price has typically traveled meaningfully in the trade direction within the window, beyond just the final close.
- A Sharpe ratio of 1.64 points to strong risk-adjusted returns for this specific Abbott Laboratories trading window.
- Individual years have still seen sizable drawdowns inside the window, so intraperiod risk has been real even when the final result was positive.
According to historical data from TradeWave.ai, this is not just another earnings bounce for Abbott but the start of a midterm-year window that has behaved very differently from an average year. TradeWave.ai’s seasonal database flags this stretch as one of the most consistently positive patterns in Abbott’s election-cycle history, which makes the timing of the latest move hard to ignore.
How strong is Abbott Laboratories (ABT) in this midterm-year seasonal window?
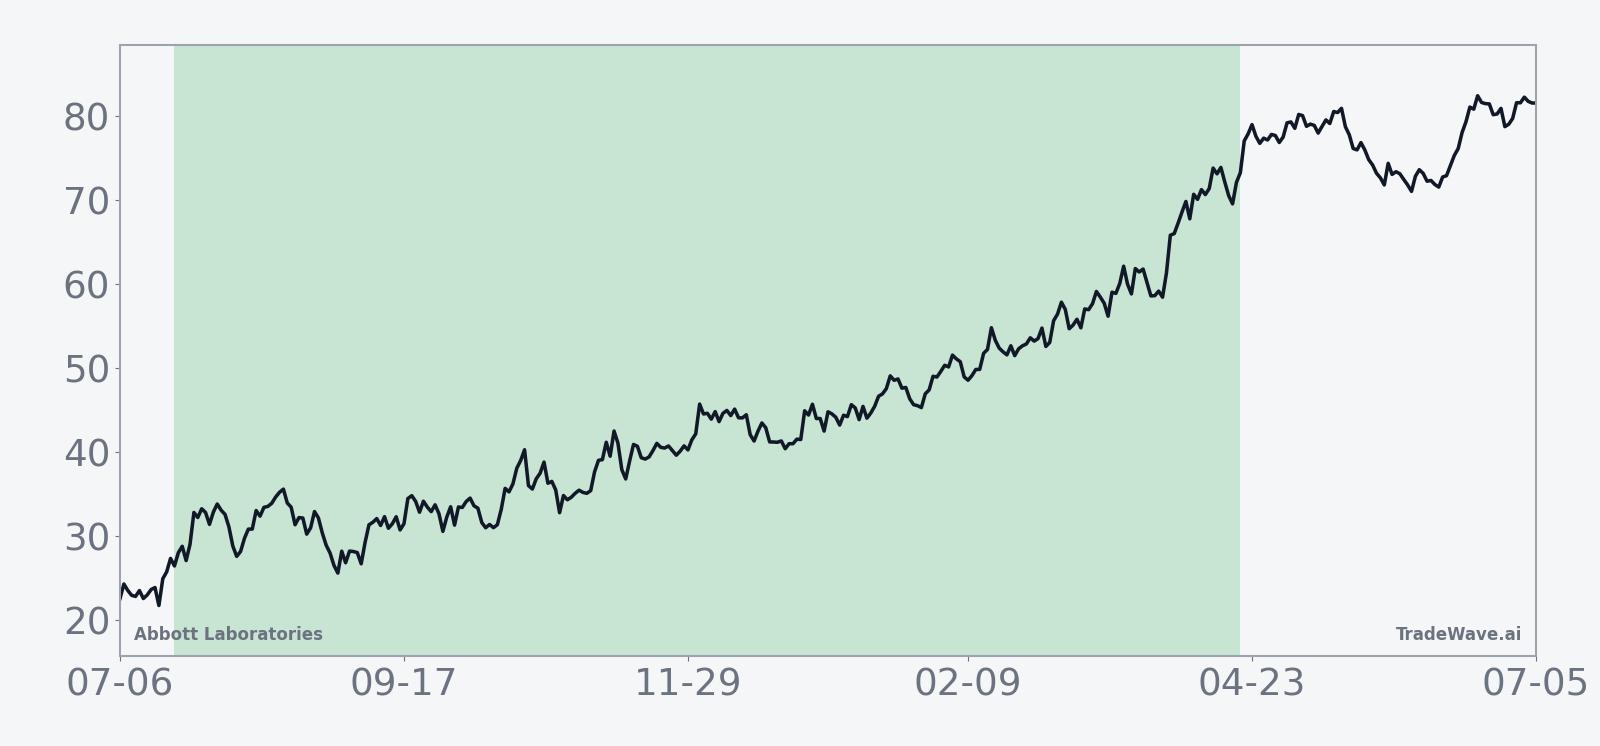
Abbott Laboratories has posted gains in every one of the last 10 midterm-election-year windows that begin around Jul 20 and run for 275 trading days, averaging 18.33% in those winning years. The stock opened Monday at $100.70 and last traded at $100.59, down slightly on the day after a sharp post-earnings surge, and sits well below its 52-week high of about $131.35 and above its 52-week low near $80.81. That combination of a long, undefeated seasonal stretch and a stock still trading roughly in the middle of its one-year range gives this ABT seasonal trend unusual weight for investors thinking about the next phase of the move.
Because this pattern is grouped by the presidential election cycle, it captures how Abbott has behaved specifically in midterm election years as markets transition into the year before the presidential election. That matters for a large healthcare name that sits in the crosshairs of policy, reimbursement and regulation, since midterm years often bring shifting expectations around healthcare spending and device approvals that can drive sector rotation.
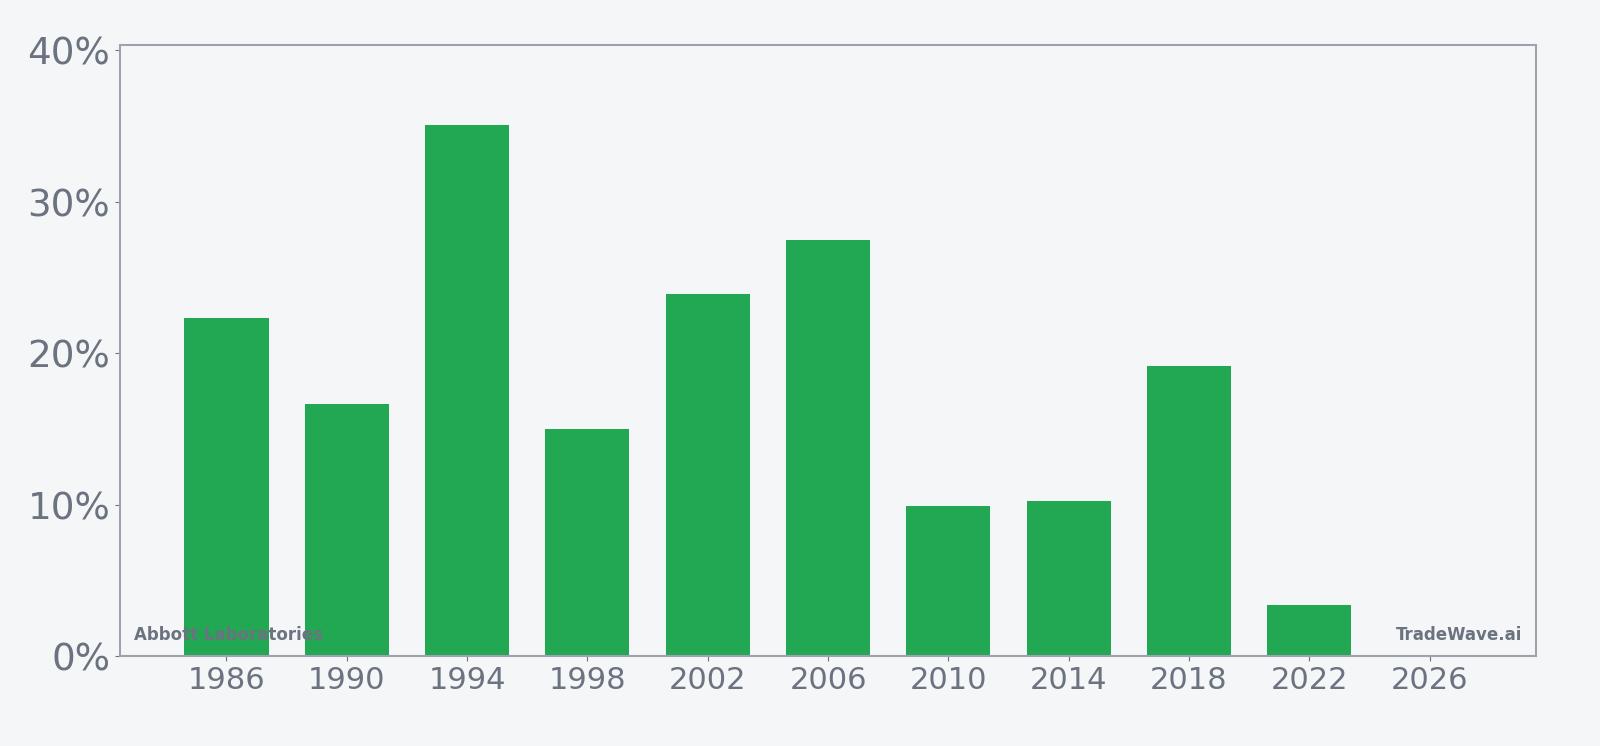
Across the last 10 midterm-election-year samples, the average net gain of 18.33% comes with a median outcome of 17.92%, which tells you the wins have been relatively clustered rather than driven by a single outlier year. The strongest year in this Abbott Laboratories trading window was 1994, when the stock gained 35.1% from entry to exit, while the weakest was 2022, which still finished up 3.42% despite a choppy broader market. Add it up and the cumulative return across these 10 windows is 423%, a hefty number for a single recurring slice of the calendar.
Intraperiod swings have been meaningful. In 2002, for example, Abbott’s best point-to-peak move inside the window reached 44.85%, while the worst drawdown from entry was 6.87%. In 1990, the stock ultimately gained 16.66% but at one point was down 22.47% from the starting level, showing how maximum adverse excursion can bite even in a year that ends positive. That is the flavor of risk embedded in this historical seasonality: the long side has won every time, but it has not always been a smooth ride.
The TradeWave Ratio of 1.81 suggests that, on average, Abbott has tended to travel significantly in the trade direction within the window, not just drift modestly higher. Combined with a Sharpe ratio of 1.64, the pattern has delivered strong risk-adjusted returns based on end-of-window outcomes, even after accounting for the volatility implied by those deep interim drawdowns. For traders who care about how far a move can run before it exhausts, this is a key distinction from a low-volatility grind.
Looking at the per-year table, the 1994 and 2006 windows stand out as clean, powerful trends, with net gains of 35.1% and 27.45% and relatively shallow worst drawdowns of 3.14% and 1.1% respectively. By contrast, 1986 and 1998 show that even solid net gains of 22.35% and 15.0% came with double-digit downside at some point, with worst intraperiod drops of 19.31% and 18.04%. The 2022 window, with a modest 3.42% net gain and a 13.43% worst drawdown, is a reminder that this ABT seasonal trend can still deliver a grind rather than a clean breakout when the macro tape is hostile.
Year-by-year net returns and intraperiod swings show how often Abbott has finished higher and how large both rallies and drawdowns have been inside the window.
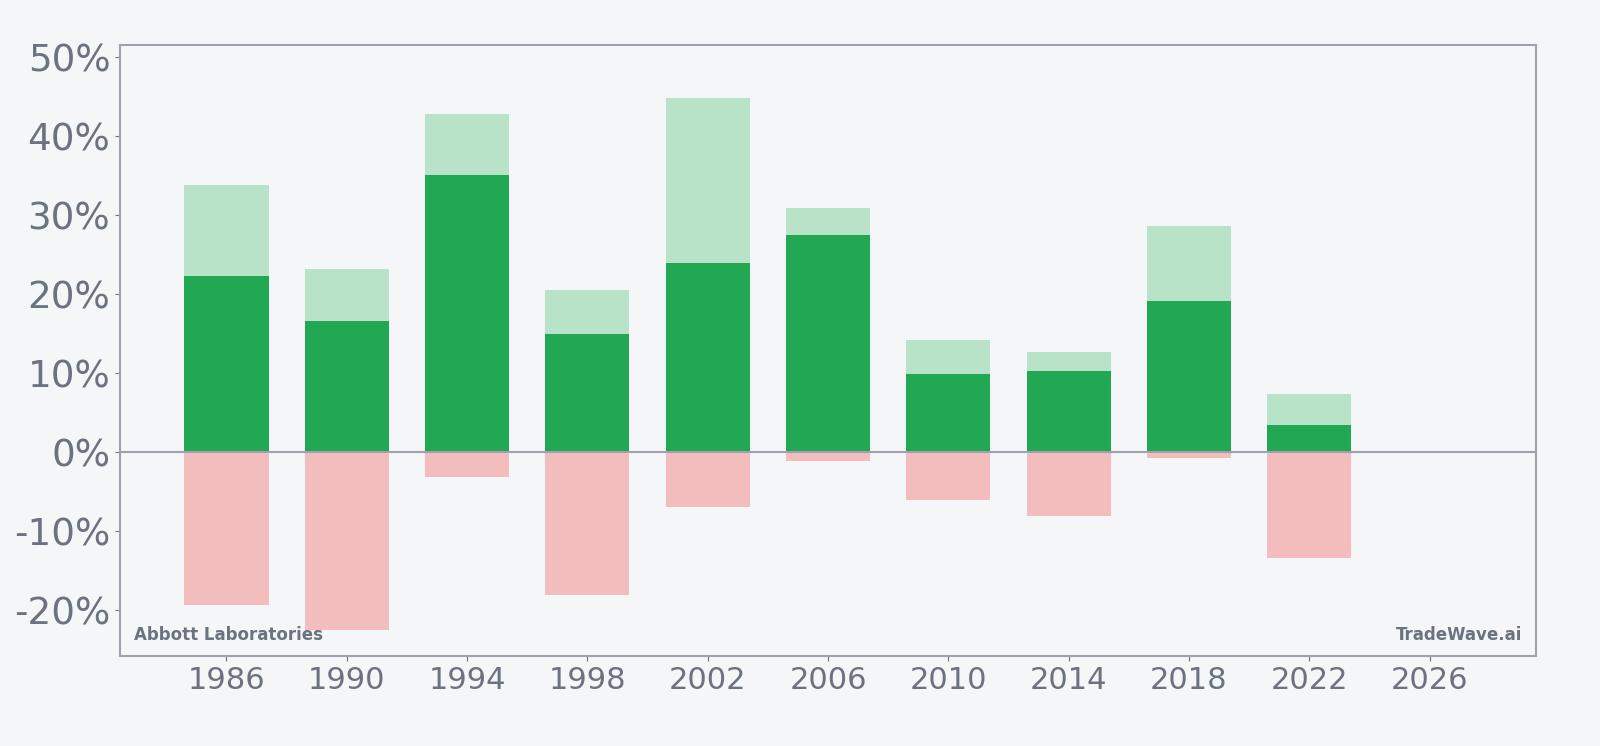
The bars with maximum favorable and adverse excursions make the pattern’s character clear: in most years, Abbott has seen double-digit upside at some point in the window, but several cycles also featured double-digit drawdowns before finishing higher. History does not guarantee future results; adverse excursions can be large even in winning windows.
Why does Abbott Laboratories (ABT) follow this seasonal pattern?
One likely driver is the way Abbott’s earnings calendar and product launches line up with the midterm-to-pre-election policy cycle, when healthcare regulation and reimbursement debates often heat up and then settle. Analysts have also pointed to institutional portfolio repositioning around midterm elections, which can favor defensive growth names like large medical device and diagnostics companies as political uncertainty peaks. This ABT seasonal trend may reflect that combination of policy noise, sector rotation and the company’s own cadence of device approvals and diagnostics demand.
What is driving Abbott Laboratories (ABT) today?
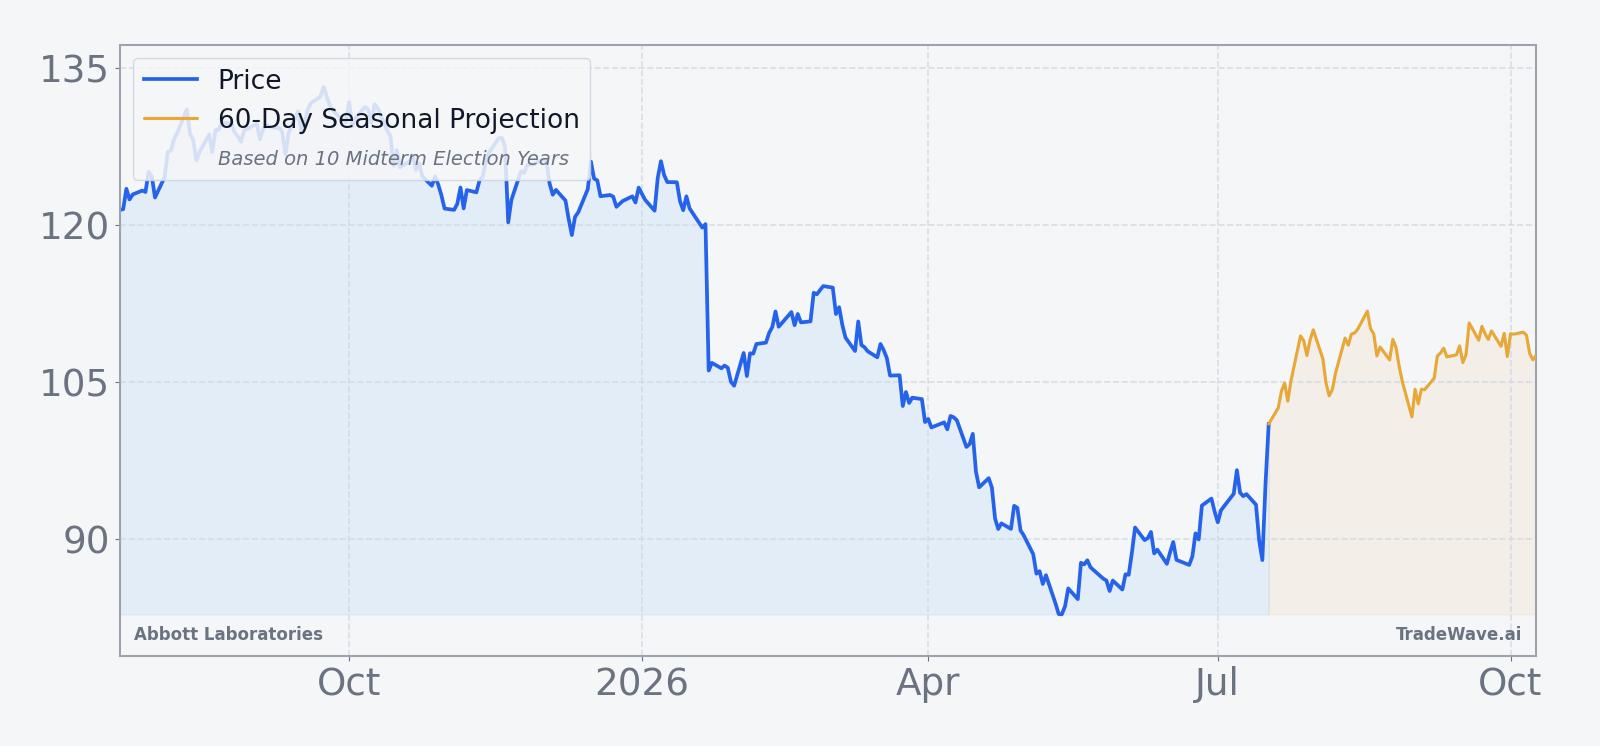
Abbott shares last changed hands at $100.48, down 0.2% on the day after a powerful one-month run of 15.39%, leaving the stock trading between its 52-week low near $80.81 and high around $131.35. The near-term driver is still the Q2 2026 earnings report on Jul 16, when Abbott beat expectations on both earnings and revenue, lifted its full-year adjusted profit forecast to $5.45–$5.60 per share, and saw diagnostics and medical devices lead the way with 42% and 9% sales growth respectively.[2] That print triggered a roughly 12% jump in the stock and delivered Abbott’s best single day in 24 years, briefly putting it at the top of the S&P 500 leaderboard.[1]
Behind the headline numbers, the story is about diagnostics and devices offsetting earlier headwinds from the Exact Sciences acquisition, which had knocked about $0.20 per share off the 2026 profit outlook when the deal closed in April.[3] Strong demand for cancer diagnostics and heart devices has since helped management restore confidence in the earnings trajectory, and the raised guidance signals that the integration drag is being absorbed faster than feared.[2] For a stock with a long history of steady execution, that shift from acquisition overhang to growth narrative is a key part of why traders are willing to lean into the current move.
There is also a security angle in the background. On Jul 17, Abbott disclosed that it was investigating two cyber incidents involving unauthorized access to systems at its cancer diagnostics business and its LabCentral portal, though the company said operations were not affected and testing continued as normal.[4] The market largely looked through the news, but in a world where healthcare data and lab connectivity are increasingly central to the business model, investors will be watching closely for any follow-up disclosures or regulatory responses.
The chart below situates the latest move in its recent multi-month context, alongside a 60-day seasonal projection based on the historical pattern.
What should traders watch in this Abbott Laboratories (ABT) seasonal window?
First, watch how Abbott trades around the raised 2026 profit guidance band of $5.45–$5.60 per share.[2] If the stock can hold above the post-earnings gap and build a base near or above the 50-day moving average, it would rhyme with prior midterm-year windows where strong fundamentals underpinned the historical seasonality. A quick round-trip back into the pre-earnings range would be an early sign that this cycle might behave more like 2022’s grind than 1994’s clean trend.
Second, keep an eye on diagnostics and medical devices growth in upcoming quarters. The current ABT seasonal trend has historically overlapped periods when those segments were gaining share and driving margin expansion, and the latest quarter’s 42% diagnostics growth and 9% device growth set a high bar to clear.[2] Any slowdown there, especially if tied to reimbursement or regulatory shifts in the midterm-election-year policy calendar, could test the durability of the pattern.
Third, monitor any further updates on the cyber incidents at Abbott’s diagnostics operations.[4] The company has said there was no operational impact, but if investigations uncover broader vulnerabilities or trigger additional compliance costs, that could inject volatility into a window that has historically rewarded patience on the long side. How the stock reacts to any such headlines will tell you whether investors are still willing to lean on the historical seasonality or are shifting back to a more cautious stance.
Finally, pay attention to how Abbott trades into the transition from the midterm election year into the year before the presidential election. Historically, that handoff has been a supportive backdrop for large healthcare names as policy uncertainty fades and risk appetite improves, and this 275-day window sits squarely across that shift. If ABT can maintain constructive price action through that phase, it would be one more data point in favor of a seasonal pattern that, so far, is 10 for 10.
Sources
- Barron's: Abbott Stock Is Leading the S&P 500 After Earnings for Its Best Day in 24 Years (Jul 16, 2026)
- Reuters: Abbott raises 2026 profit forecast on strength in diagnostics, medical devices (Jul 16, 2026)
- Reuters: Abbott trims 2026 profit forecast on Exact deal hit, shares fall (Apr 16, 2026)
- Reuters: Abbott investigates two separate cyber incidents, says no operations affected (Jul 17, 2026)
About this seasonal analysis
Seasonal pattern data is sourced from TradeWave.ai, which analyzes historical price behavior across annual calendar windows going back up to 30 years. Read the full data methodology or the book The 100-Year Pattern by Afshin Moshrefi (2026 edition). Past performance of seasonal patterns does not guarantee future results. This article is for informational purposes only and does not constitute investment advice.