IBM Enters Historically Strong 202-Day Midterm-Year Rally Window
IBM is heading into a historically powerful 202-day seasonal window just as the stock trades far below its 52-week high after a brutal earnings warning selloff.
Price as of Jul 21, 2026: $210.50 (last close).
What is the seasonal pattern for IBM (IBM)?
IBM has risen in 14 of 15 midterm-election-year windows starting around Aug 1, with an average gain of 21.62% in winning years.
- 14 wins and 1 loss in this window, with winning years averaging 21.62% gains across the last 15 midterm election years.
- The upcoming IBM trading window begins on Aug 1, 2026 and runs for 202 trading days, covering the late midterm year into the pre-election year.
- Percent Profitable is 93%, with 14 winners and just 1 loser across the historical sample.
- Including every year, Avg Profit - All is still a strong 19%, reflecting only one double-digit losing stretch.
- The worst losing year in this IBM seasonal pattern saw a 12.55% decline, showing that drawdowns can still bite even in a bullish window.
- TradeWave Ratio of 1.61 and a Sharpe ratio of 1.04 point to a historically favorable long setup with meaningful intraperiod swings.
According to historical data from TradeWave.ai, this specific midterm-election-year stretch has behaved very differently from an average calendar period for IBM. The next section walks through how that election-cycle seasonality lines up with today’s bruised price and shifting macro backdrop.
How has IBM (IBM) traded in this midterm-year seasonal window?
IBM has risen in 14 of the last 15 midterm-election-year windows that start around Aug 1 and run for 202 trading days, averaging 21.62% gains in winning years. The stock finished Tuesday at 210.50, about 36.7% below its 52-week high of 332.46 after a violent post-warning slide. Options traders have already been leaning into long-dated upside, with reports of nearly 200,000 contracts tied to quantum and other long-term call structures changing hands in recent months, including a single $2.7 million call purchase that underscored speculative interest in a rebound.[8] That mix of a historically strong IBM seasonal trend, a deep drawdown and aggressive upside positioning sets up a high-stakes window as the midterm year gives way to the pre-election year.
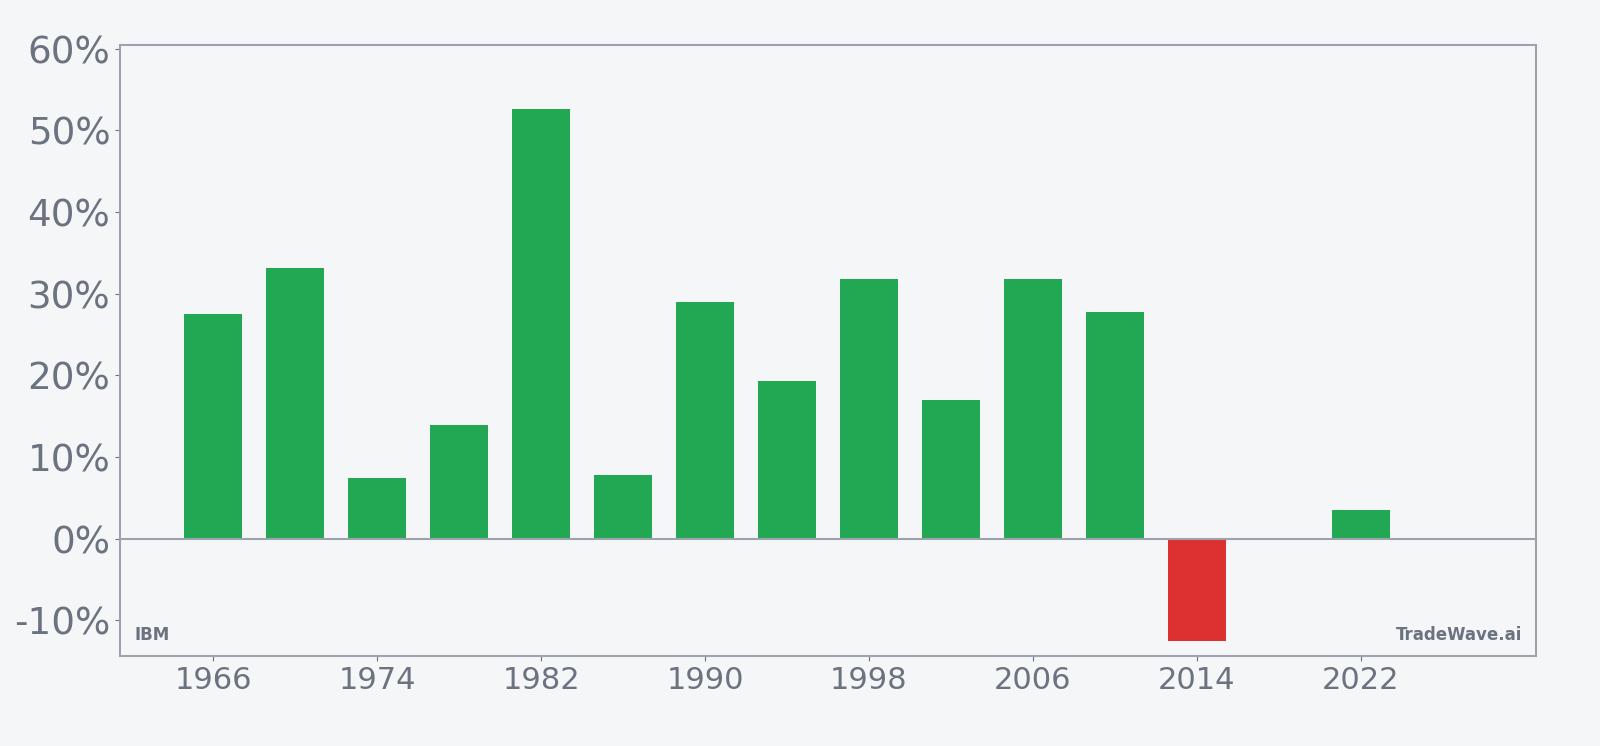
Grouping IBM’s seasonal behavior by the presidential election cycle matters here because this 202-day stretch sits in the late midterm election year and runs into the year before the presidential election, a phase that has often coincided with clearer policy visibility and more constructive risk appetite. In other words, the IBM seasonal trend in this window reflects how investors have historically repositioned around mid-cycle fiscal and regulatory signals rather than a generic “second-half of the year” pattern.
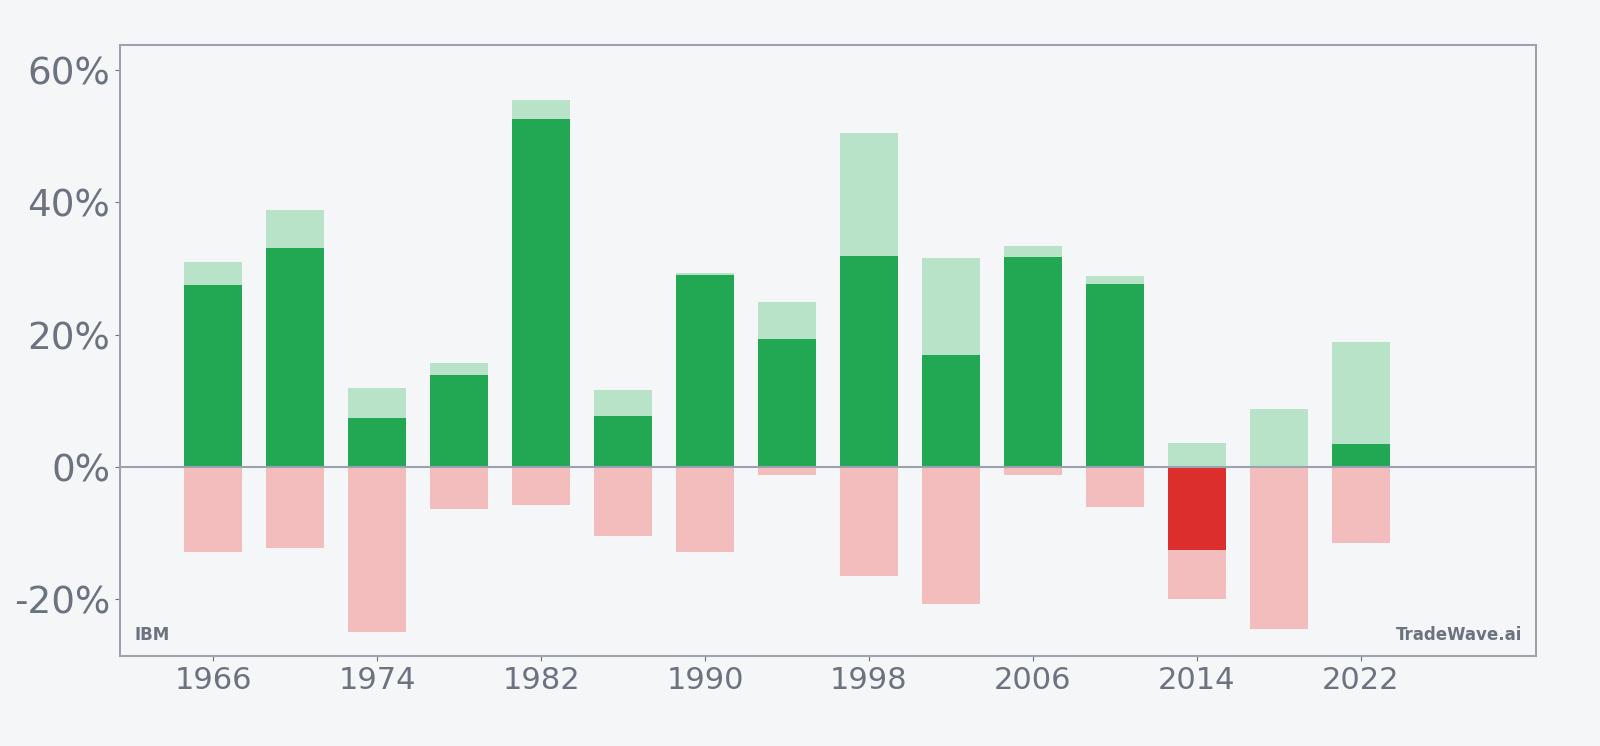
Year-by-year net, best-case and worst-case moves show how often IBM has trended higher while still experiencing sizable swings inside the window.
Across the last 15 midterm election years, this IBM trading window has been a clear long-biased pattern: 14 winners, 1 loser and a 93% success rate. Average gains in the up years clock in at 21.62%, while including the lone down year still leaves a robust 19% Avg Profit - All. The worst outcome in the sample was 2014, when IBM fell 12.55% during the window, while several cycles such as 1998, 2006 and 2010 posted gains north of 27%.
The per-year bars with maximum favorable and adverse excursions show that IBM has often traveled much further intraperiod than the final net result suggests. In 1998, for example, the stock’s best point-to-peak move inside the window reached 50.57% before settling at a 31.86% gain, while the worst drawdown from entry in that same year was 16.43%. By contrast, 2014 saw only a modest 3.7% best run-up but a 19.94% worst drawdown, ending as the single losing year in the sample.
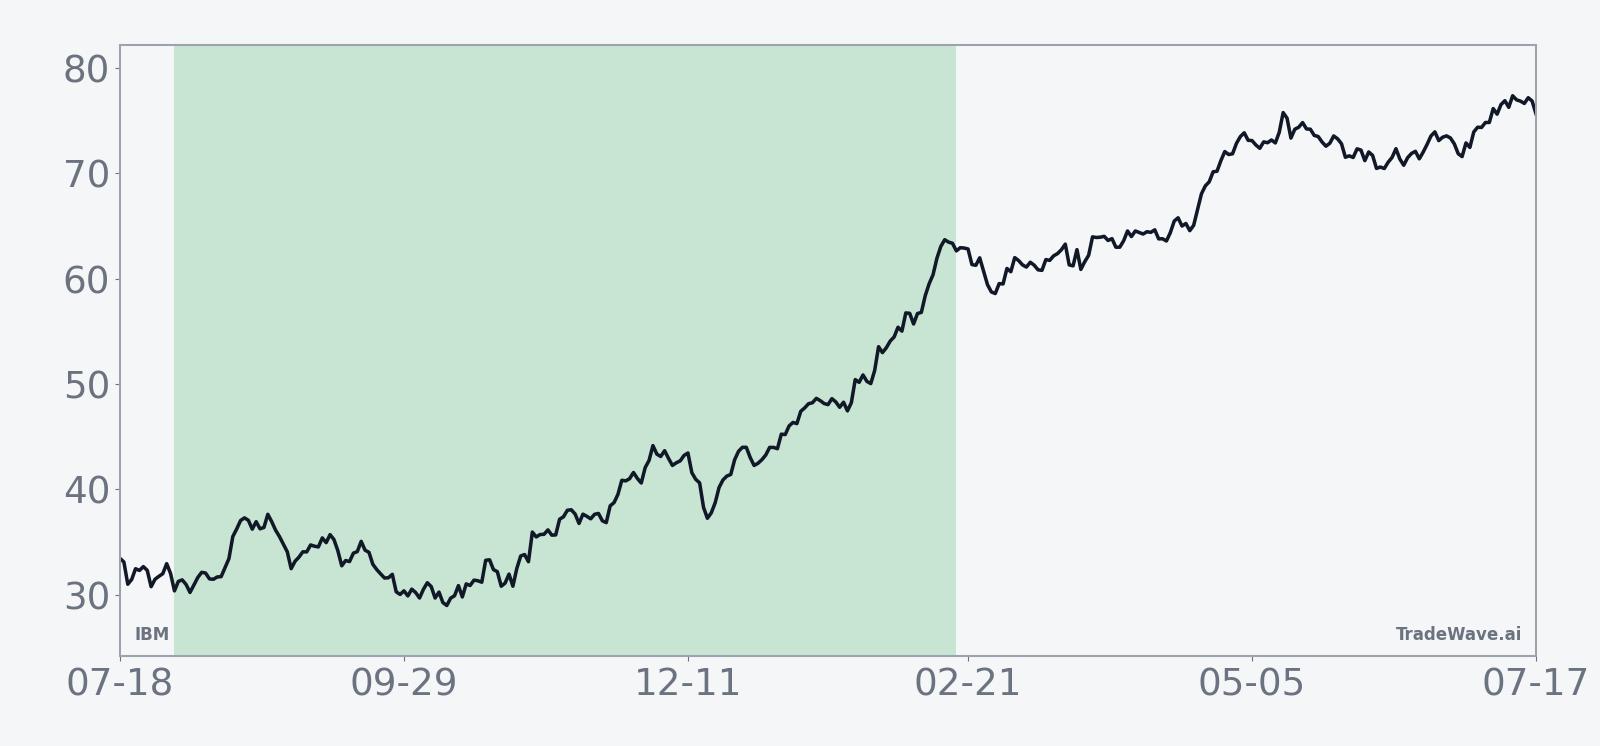
The TradeWave Ratio of 1.61 captures how far IBM has typically moved in the trade direction during this window, independent of where it finished, and a Sharpe ratio of 1.04 points to a historically attractive risk-adjusted profile for a long setup. The historical seasonal trend chart suggests that gains have tended to build over the life of the window rather than arriving in one short burst, with several cycles showing early choppiness followed by stronger performance as the calendar moves closer to the pre-election year.
Put together, the pattern is striking: in the last 15 midterm election years, this 202-day stretch has almost always rewarded IBM bulls, with only one clear failure and several very strong runs.
Why does IBM (IBM) follow this seasonal pattern?
One likely driver is the way IBM’s earnings calendar and large-enterprise deal cycle line up with the political calendar, as CIOs lock in multi-year infrastructure and software commitments once midterm policy risk is clearer. Analysts have also pointed to institutional portfolio repositioning into perceived “quality tech” and hybrid-cloud names as the pre-election year approaches, which can favor IBM relative to higher-multiple software peers.[1] The pattern may also reflect sector rotation into more defensive technology and services as investors balance AI-infrastructure enthusiasm with steadier cash-flow stories.
History does not guarantee future results; adverse excursions (MAE) can be large even in winning windows.
What is driving IBM (IBM) today?
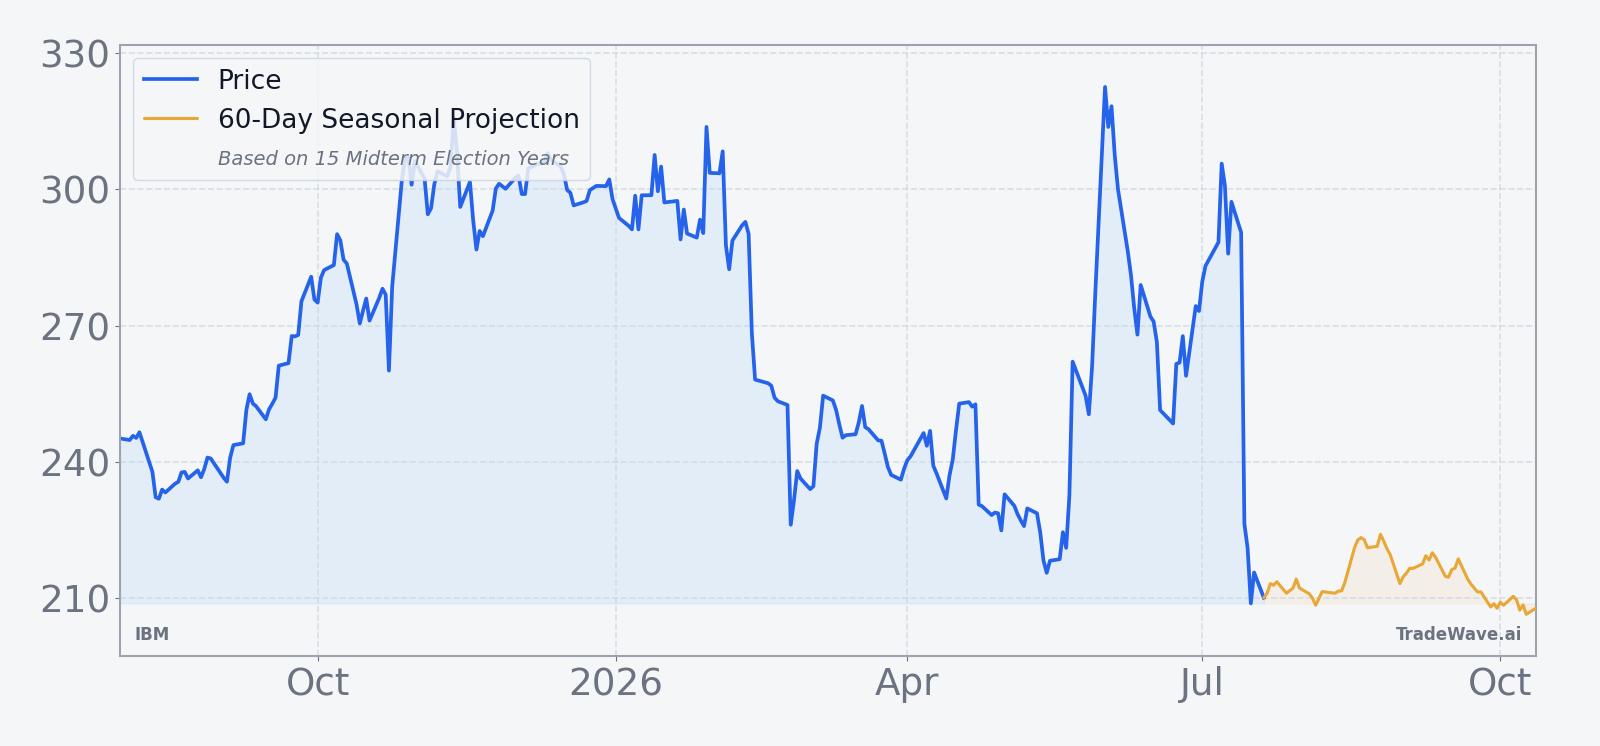
IBM closed at 210.50 on Tuesday, down 1.2% on the day and sitting just above its 52-week low of 204.44 after a July earnings warning that triggered a one-day collapse of more than 25%.[2][9] On Jul 14, IBM preannounced that second-quarter revenue and adjusted earnings would miss Wall Street estimates as customers shifted budgets toward AI infrastructure like servers, storage and memory, pressuring software and mainframe spending and sparking a sector-wide selloff.[2][3] The company’s CEO acknowledged that IBM “faltered” in closing several large deals in the quarter, reinforcing concerns about near-term execution even as longer-term AI and hybrid-cloud narratives remain intact.[3]
That warning came only weeks after IBM had been trading near record highs, helped by a $1 billion U.S. Commerce Department grant for its quantum efforts and a bullish initiation from Barclays that framed the stock as a relative winner in the AI and software shakeout.[5][7] In February, a Forbes analysis highlighted an average analyst price target around $327, reflecting a much higher price regime than today and underscoring how sharply sentiment and valuation have reset since the July shock.[8] Add in the heavy call buying tied to long-dated quantum and upside bets, and IBM’s tape shows a market that was crowded on the bullish side heading into the miss and is now trying to find a new equilibrium.[8]
The chart below situates the latest drop against IBM’s past year of trading and a 60-day seasonal projection.
What should traders watch as IBM enters this seasonal window?
First, the calendar: the 202-day IBM seasonal window tied to the last 15 midterm election years begins on Aug 1, only days after the company’s scheduled Jul 22 earnings release. How the stock trades around that report, and whether management can stabilize the narrative on AI-driven capex shifts, will shape how closely this cycle can track the historical pattern.[2][3]
Second, levels: with IBM hovering just above its 52-week low, traders will be watching whether the stock can hold the 204 to 210 zone and start building a base, or whether further disappointment pushes it into a new leg lower. A sustained move back toward the mid- to high-$200s over the coming months would rhyme with prior strong seasonal windows, while a failure to defend recent lows would look more like the rare losing year in 2014.
Third, positioning: the earlier wave of long-dated call buying and quantum-focused upside bets will be important to monitor from here.[8] If options flow and volume continue to skew toward bullish structures as the seasonal window opens, it would signal that investors are leaning into the historical IBM seasonal trend and betting that the July shock was a reset, not the start of a longer slide. If, instead, call activity fades or flips toward downside hedges, it would suggest that the crowd is fading the pattern and bracing for a more drawn-out repair process.
Finally, the policy and macro backdrop: this late midterm election year into pre-election year stretch often coincides with clearer fiscal and regulatory signals, which can support risk assets if growth and inflation cooperate. For IBM, that means watching not just its own earnings and AI-infrastructure narrative, but also how broader software and hybrid-cloud peers trade as investors recalibrate sector exposure around the policy calendar.[1][3][5]
Sources
- MarketWatch: IBM’s stock is sliding. Here’s why these analysts see an opportunity to buy. (Jul 24, 2025)
- Yahoo Finance: IBM stock plummets more than 25% on Q2 earnings warning (Jul 14, 2026)
- Reuters: IBM warns AI boom is squeezing software budgets; shares slump in sector rout (Jul 14, 2026)
- MarketWatch: Why is IBM’s stock down after an earnings beat? Here’s one quibble. (Jul 23, 2025)
- Barron’s: IBM Stock Notches Highest Close on Record. This Time It’s Not About Quantum. (Jun 1, 2026)
- Business Insider: IBM stock shoots higher after bullish Barclays forecast hits back at SaaSpocalypse fears (Jun 1, 2026)
- Forbes: IBM Stock Isn't Dying. It's On Sale (Feb 24, 2026)
- Barron’s: What’s Next for IBM Stock After 25% Collapse (Jul 15, 2026)
About this seasonal analysis
Seasonal pattern data is sourced from TradeWave.ai, which analyzes historical price behavior across annual calendar windows going back up to 30 years. Read the full data methodology or the book The 100-Year Pattern by Afshin Moshrefi (2026 edition). Past performance of seasonal patterns does not guarantee future results. This article is for informational purposes only and does not constitute investment advice.