JPMorgan Upgrade Sends BlackRock (BLK) Higher Ahead of Aug. 2 Midterm Rally Stretch
BlackRock is easing off record highs after blowout Q2 results as traders look toward an Aug. 2 seasonal window that has never produced a losing midterm-year run but has carried deep intraperiod drawdowns.
Price as of Jul 20, 2026: $1,054.11 (last close).

What is the seasonal pattern for BlackRock (BLK)?
BlackRock has risen in 6 of 6 midterm election-year windows starting Aug. 2, with an average gain of 15.22% in winning years.
- 6 for 6 in this window, with average gains of 15.22% across winning years over the last six midterm election cycles.
- The seasonal window begins on Aug. 2 and runs for 344 trading days, covering the heart of the midterm election year into the following pre-election phase.
- Percent Profitable is 100%, with 6 winners and 0 losers in the historical sample for this BLK seasonal trend.
- Median profit is 14.2%, and cumulative return across all six windows totals 130%, highlighting a strong long-side bias.
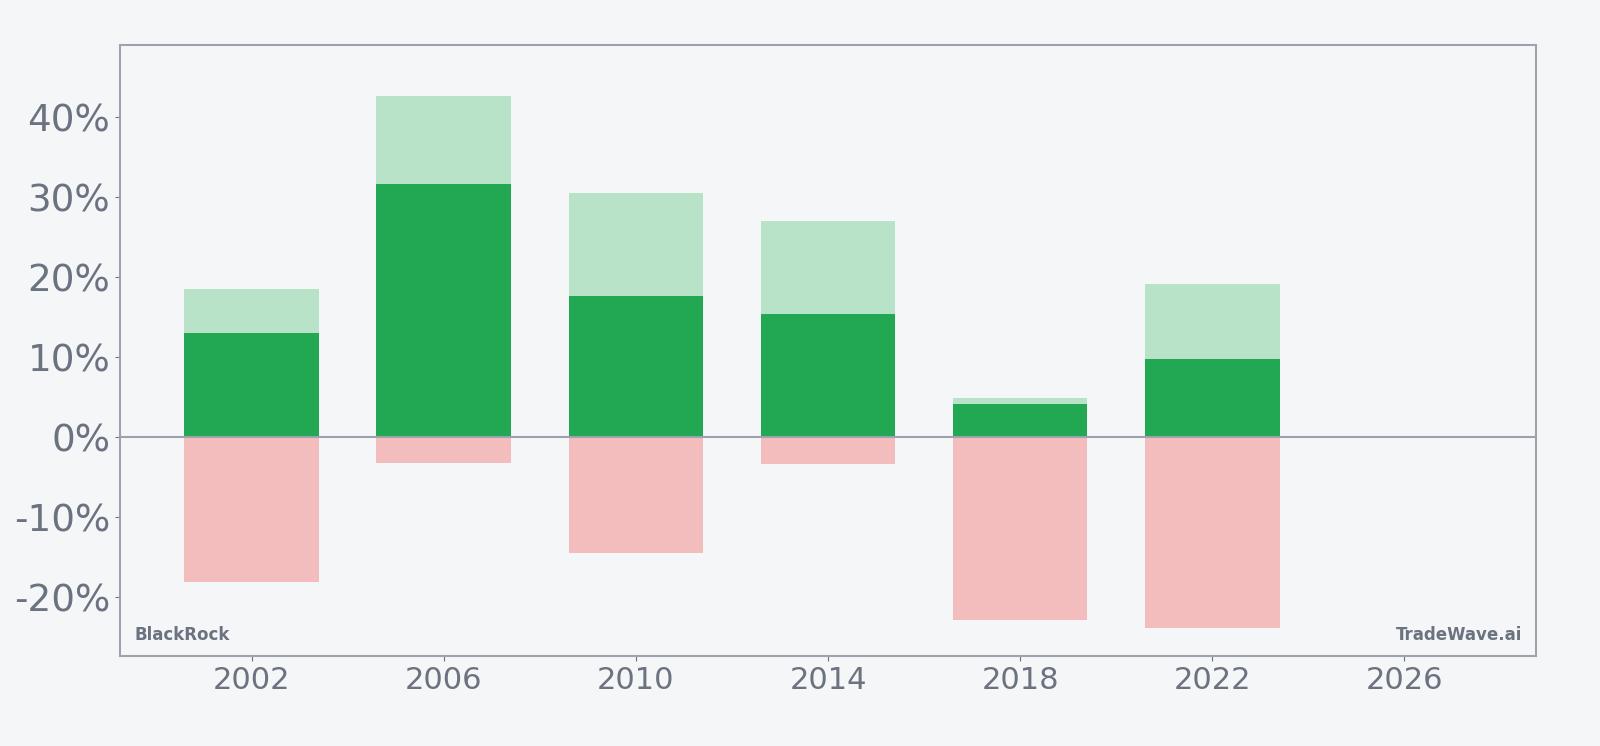
- Intraperiod swings have been large, with some years seeing adverse moves of more than 20% before finishing higher.
- The pattern aligns with BlackRock’s role as a macro bellwether, often benefiting from late-cycle risk-on flows and asset allocation shifts.
According to historical data from TradeWave.ai, this midterm-year stretch has behaved very differently from an average calendar year for BlackRock. The next section walks through how that election-cycle pattern has played out in prior decades and what it means for the upcoming window.
How has BlackRock (BLK) traded in past midterm-year windows starting Aug. 2?
BlackRock has posted gains in every single midterm election-year window starting Aug. 2 over the last six cycles, averaging 15.22% returns for long positions across a 344-day stretch. Shares finished the prior session at $1,054.11, down 1.7% on the day and about 10.8% below their 52-week high of $1,181.46.[2] That combination of a strong historical seasonal pattern and a stock consolidating below recent peaks is drawing fresh attention from traders who treat BLK as a proxy for global risk appetite.
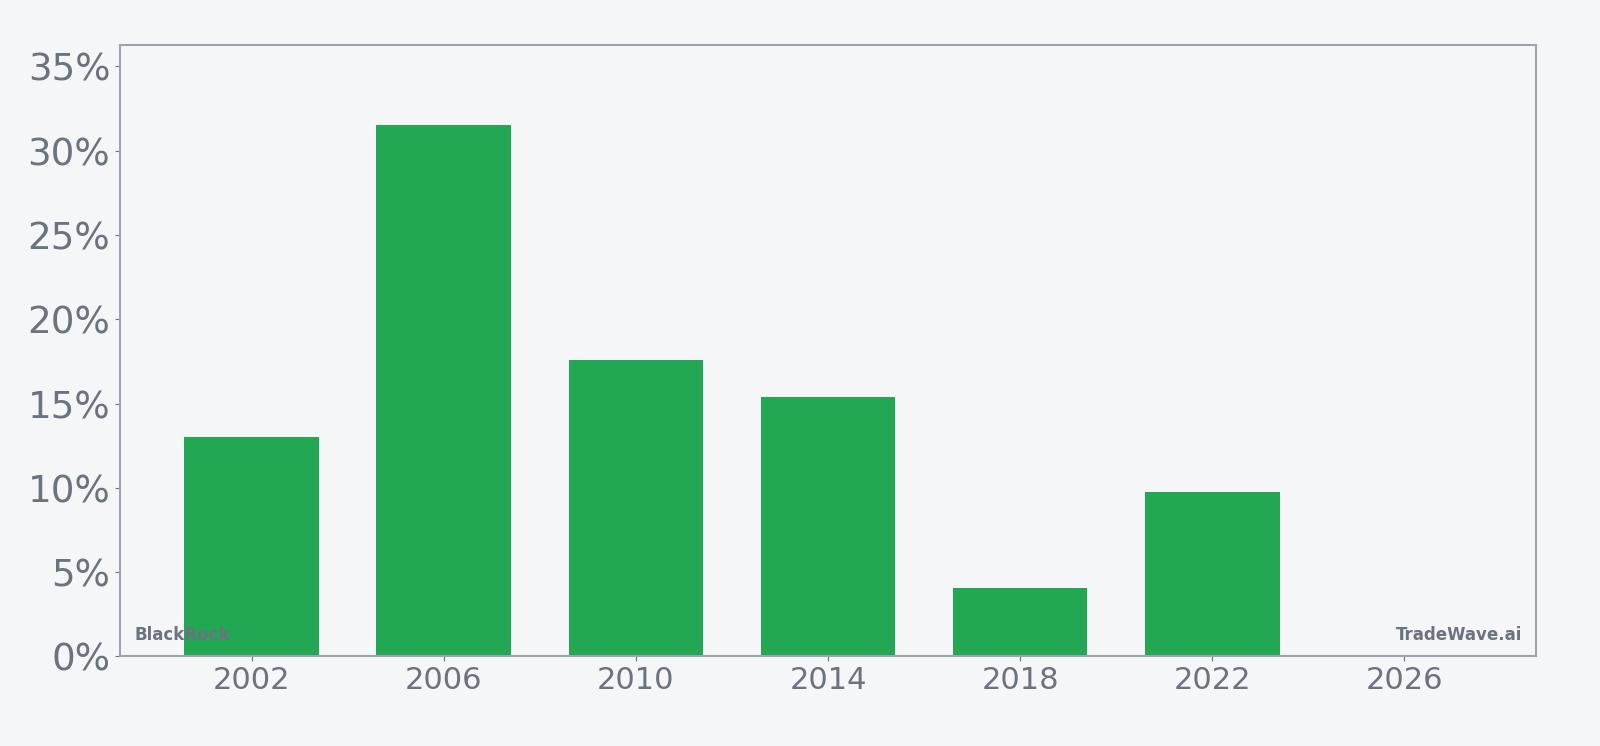
Grouping the data by the presidential election cycle matters here because this window always begins in a midterm election year and runs deep into the following pre-election year, a phase that has often coincided with easier financial conditions and stronger risk-taking. For a systemically important asset manager like BlackRock, that backdrop can translate into higher assets under management, richer fee pools and more leverage to global ETF flows.
Year-by-year bars with maximum favorable and adverse moves show how often BLK has swung sharply before finishing higher.
Across the six historical windows, the long-side bias is clear: Percent Profitable is 100%, with every midterm-year run finishing in the green and cumulative gains of 130%. Average profit of 15.22% and a median outcome of 14.2% suggest the BLK seasonal trend has been both strong and relatively consistent for longs.
The per-year table shows how that has played out in practice. The strongest run came in 2006, when BlackRock rallied 31.55% from entry to exit, with a maximum favorable move of 42.62% and only a 3.27% worst drawdown along the way. At the other end of the spectrum, 2018 delivered just a 4.04% net gain, but that modest finish masked a 4.83% peak run-up and a punishing 22.99% intraperiod drop from entry before the stock clawed back into positive territory.
Those swings underline the importance of the intraperiod profile. In 2002 and 2010, BlackRock logged net gains of 13.02% and 17.59% respectively, yet both windows saw double-digit adverse excursions, with worst drawdowns of 18.19% and 14.55% from the starting level. Even 2022, a year marked by broad market volatility, ended with a 9.73% gain for the pattern but included a 19.04% peak run-up and a 23.91% worst drawdown.
The TradeWave Ratio of 1.56 indicates that, on average, price has tended to travel meaningfully in the trade direction within the window, independent of where it ultimately closed. Combined with a Sharpe ratio of 1.23 based on end-of-window outcomes, the historical seasonality points to a regime where upside has outweighed downside over the full 344-day span, even if the path has been rough.
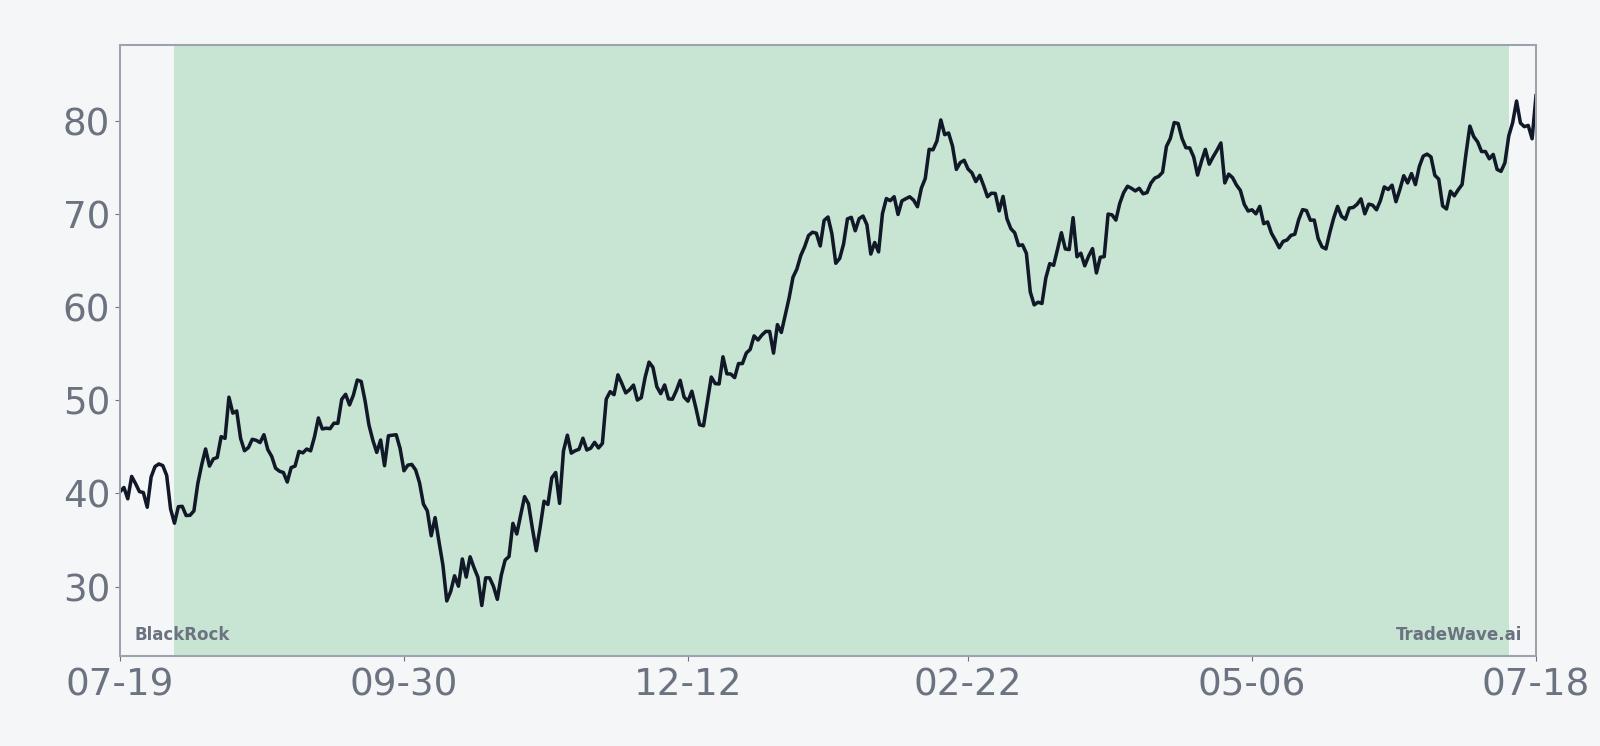
Looking at the average seasonal trend line, the typical pattern shows gains accruing in stages rather than in a straight line. Early in the window, returns have often been choppy as midterm-year policy uncertainty and rate debates play out, with stronger momentum building later as markets transition into the pre-election year, a phase that has historically favored risk assets.
The cumulative return chart reinforces that story. Gains tend to cluster in the back half of the window, suggesting that investors who focus only on early midterm-year volatility may miss how much of the historical upside has arrived as the policy calendar clears and liquidity conditions improve.
History does not guarantee future results; adverse excursions can be large even in winning windows, and past MAE readings above 20% show that drawdowns have been a recurring feature of this pattern.
Why does BlackRock (BLK) follow this seasonal pattern?
One likely driver is the way the presidential election cycle shapes risk appetite, with midterm-year uncertainty giving way to a more supportive pre-election backdrop that has often boosted equities and ETF flows. Analysts have also pointed to year-end and fiscal-year rebalancing by institutions, which can favor large asset managers as they capture inflows into index and fixed-income products.[4] The pattern may further reflect sector rotation into financials and asset managers when investors anticipate easier policy or stronger global growth heading into a pre-election year.
What is driving BlackRock (BLK) today?
BlackRock shares closed Monday at $1,054.11, down 1.7% on the day, as the stock cooled after a powerful post-earnings run that recently carried it to a 52-week high of $1,181.46.[2] The latest leg higher followed Q2 2026 results on Jul. 16, when the firm reported adjusted earnings of $13.91 per share versus a $12.69 consensus and revenue of $7.08 billion against $6.73 billion expected, with assets under management climbing to $15.345 trillion.[2] That blowout quarter prompted JPMorgan to upgrade the stock to overweight and helped extend a multi-quarter streak of upside surprises that began in late 2025.[2]
In January 2026, BlackRock’s Q4 2025 report showed adjusted EPS of $13.16 versus a $12.21 estimate and revenue of $7.0 billion versus $6.69 billion expected, with AUM reaching $14.04 trillion.[3] Back in October 2025, stronger-than-expected Q3 2025 results and record AUM of about $13.463 trillion had already pushed the stock to fresh highs, underscoring how earnings beats and asset growth have been central to the BLK story in this cycle.[1][5] Across these quarters, management has leaned on strong flows into iShares ETFs, private markets and performance-fee-heavy strategies, which Reuters reported were key contributors to profit growth in early 2026.[4]
Macro conditions have also been a tailwind. Fed rate cut expectations and a broad market rally in 2025 supported strong inflows into fixed-income ETFs, lifting fee income and helping BlackRock’s assets swell to successive records.[5] As 2026 progresses, investors are watching whether that backdrop persists or shifts as the midterm election year advances, since any change in the rate path or risk sentiment can quickly feed through to flows and performance fees for the world’s largest asset manager.
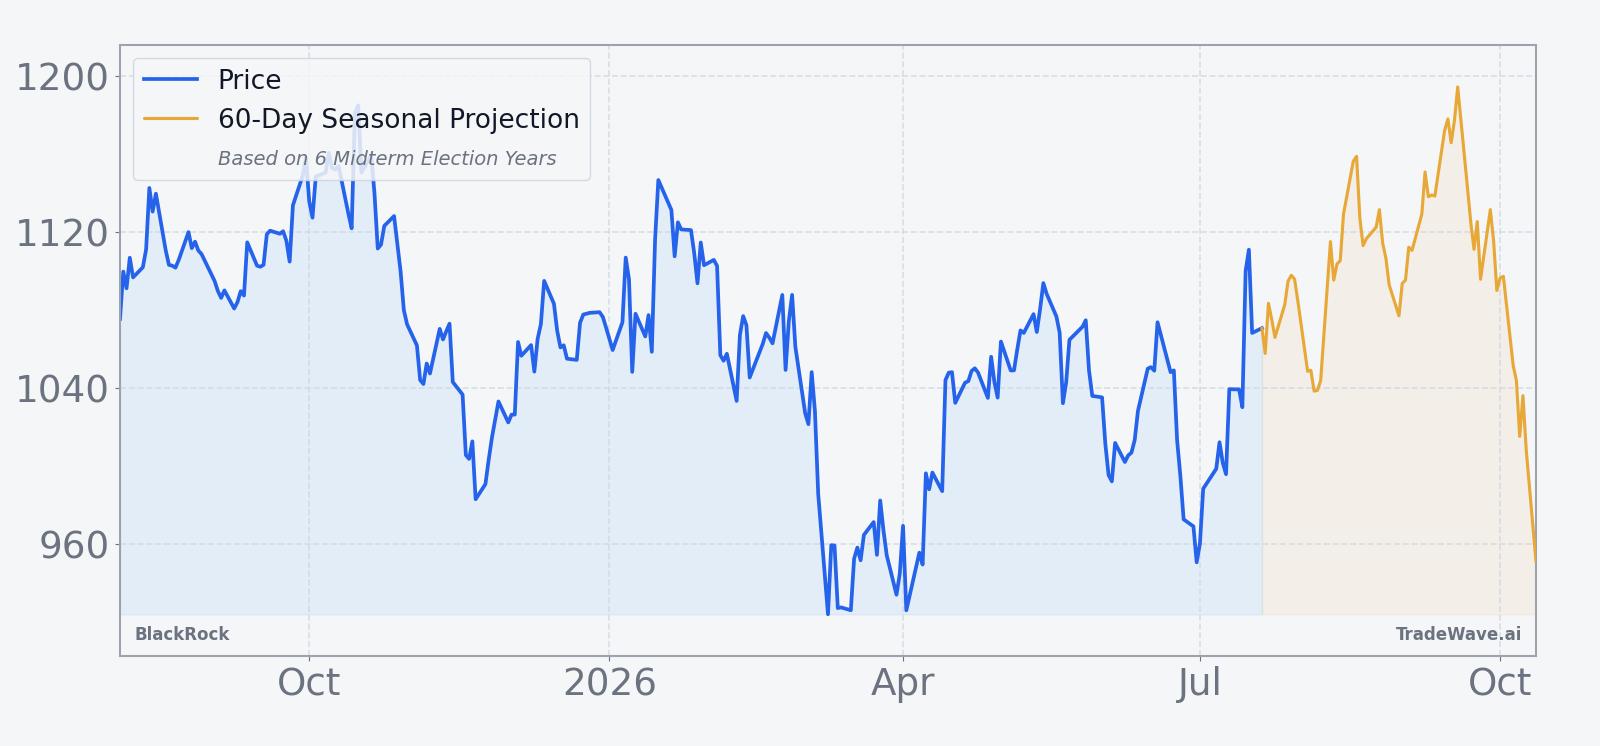
The chart below situates the latest pullback against BlackRock’s past year of trading and a short-term seasonal projection.
What should traders watch as this BlackRock seasonal window approaches?
First, the calendar: the 344-day BLK seasonal window tied to midterm election years begins on Aug. 2, so any pickup in volatility or trend change around that date will be watched closely against the 6-for-6 historical record. Second, levels: traders are focused on how the stock behaves between the recent high near $1,181 and the 50-day moving average around $1,030.86, since prior windows have featured sizable drawdowns before recovering.[2]
Third, the macro and policy backdrop will matter. If Fed expectations stay supportive and equity markets hold their risk-on tone, the historical pattern of stronger performance as the market transitions from midterm year into pre-election year could find a familiar backdrop. A shift toward tighter policy or weaker earnings breadth, by contrast, would test how robust this BLK seasonal pattern really is.
Finally, watch flows and earnings. The last three major earnings beats all coincided with sharp price pops and heavy trading volume as investors rewarded BlackRock’s AUM growth and ETF momentum.[1][2][3][4][5] If upcoming quarters continue to deliver upside surprises and strong inflows into iShares and private markets, that would rhyme with prior winning years in this seasonal window; a stumble on flows or margins would be an early sign that this cycle might diverge from the 100% win-rate history.
Sources
- CNBC, "Our patience in BlackRock pays off as its earnings send the stock to record highs," Oct. 14, 2025.
- CNBC, "BlackRock posted blowout earnings. JPMorgan says the asset management giant is a buy," Jul. 16, 2026.
- CNBC, "BlackRock's blowout earnings pass our test with flying colors. What about 2026?," Jan. 15, 2026.
- Reuters, "BlackRock quarterly profit rises on active ETFs and performance fees," Apr. 14, 2026.
- Reuters, "BlackRock's assets hit record $13.46 trillion on third-quarter markets rally," Oct. 14, 2025.
About this seasonal analysis
Seasonal pattern data is sourced from TradeWave.ai, which analyzes historical price behavior across annual calendar windows going back up to 30 years. Read the full data methodology or the book The 100-Year Pattern by Afshin Moshrefi (2026 edition). Past performance of seasonal patterns does not guarantee future results. This article is for informational purposes only and does not constitute investment advice.