S&P Global (SPGI) Has Risen in 10 of 10 Midterm Windows Starting Jul 22, Averaging 22% Gains
S&P Global is heading into a midterm-election-year seasonal window that has never produced a loss in the last 10 cycles, even as the stock trades well below its 52-week high after guidance-driven volatility.
Price as of Jul 16, 2026: $457.38 (last close).

What is the seasonal pattern for S&P Global (SPGI)?
S&P Global has risen in 10 of 10 midterm-election-year windows starting around Jul 22, with an average gain of 22.05% in winning years.
- 10 for 10 in this window, with S&P Global averaging 22.05% gains in winning years across the last 10 midterm election cycles.
- The upcoming seasonal window begins Jul 22 and runs for 355 trading days, covering the late midterm year into the pre-election year.
- Percent Profitable is 100%, with 10 winners and 0 losers in this S&P Global trading window.
- Median profit of 24.55% and cumulative return of 616% highlight how consistently this SPGI seasonal trend has favored the long side.
- Maximum favorable moves inside the window have reached as high as 45.57%, while adverse excursions have stretched to about -26.16%, underscoring real drawdown risk.
- TradeWave Ratio of 2.04 and a Sharpe ratio of 2.03 point to strong, historically efficient risk-adjusted performance for this long setup.
According to historical data from TradeWave.ai, this is not just another calendar stretch for S&P Global but a distinct midterm-election-year regime that has behaved differently from typical months.
How has S&P Global (SPGI) traded in this midterm-year seasonal window?
S&P Global has posted gains in all 10 of the last midterm-election-year windows that start around Jul 22 and run for 355 trading days, averaging 22.05% per cycle for long positions. Shares finished Friday at 457.38, up 2.9% on the day and about 10.3% below their 52-week high of roughly 509.70, after a sharp rebound from this year’s guidance shock and subsequent recovery rally.
Grouping the pattern by the presidential election cycle matters here because this window straddles the back half of the midterm year and the run-up to the presidential pre-election year, a phase when policy visibility typically improves and risk appetite often rebuilds. For a financial information and analytics heavyweight like S&P Global, that backdrop has historically coincided with stronger demand for ratings, benchmarks and data as investors reposition for the next leg of the cycle.[4]
Historically, this S&P Global trading window has been a clean long setup. Percent Profitable sits at 100%, with 10 winners and 0 losers, and the median profit of 24.55% is slightly higher than the 22.05% average, which suggests that the typical outcome has skewed toward solid double-digit gains rather than a few outliers doing all the work. The annualized return of 21.76% and cumulative return of 616% across these 10 midterm-election-year windows underline how powerful this specific slice of the calendar has been for long exposure.
The per-year table shows that even the “softest” years in this pattern still delivered double-digit gains. The weakest net return was 10.6% in 2022, while the strongest was 39.91% in 2010, when the stock’s best intraperiod run-up reached 44.74% from the entry level. Add it up: across 1986, 1990, 1994, 1998, 2002, 2006, 2010, 2014, 2018 and 2022, S&P Global has not logged a single losing outcome in this midterm-to-pre-election seasonal regime.
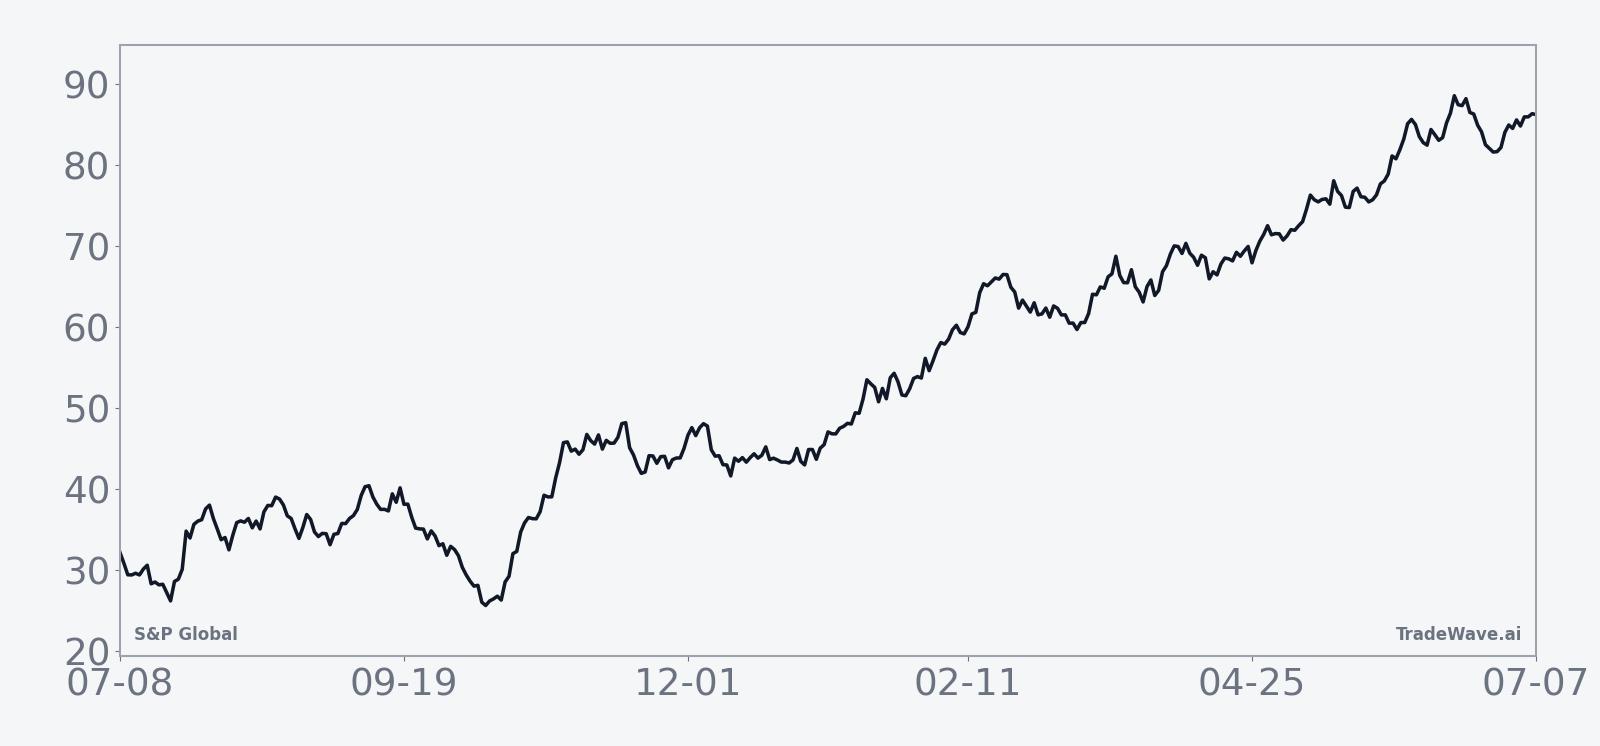
The historical seasonal average trend line slopes higher for most of the 355-day span, with relatively steady accrual rather than a single explosive burst. That profile suggests the SPGI seasonal trend has tended to reward patience, with gains compounding across the back half of the midterm year and into the pre-election year rather than relying on one short-lived spike.
Year-by-year bars with maximum favorable and adverse moves show how much upside and downside S&P Global has experienced inside this window.
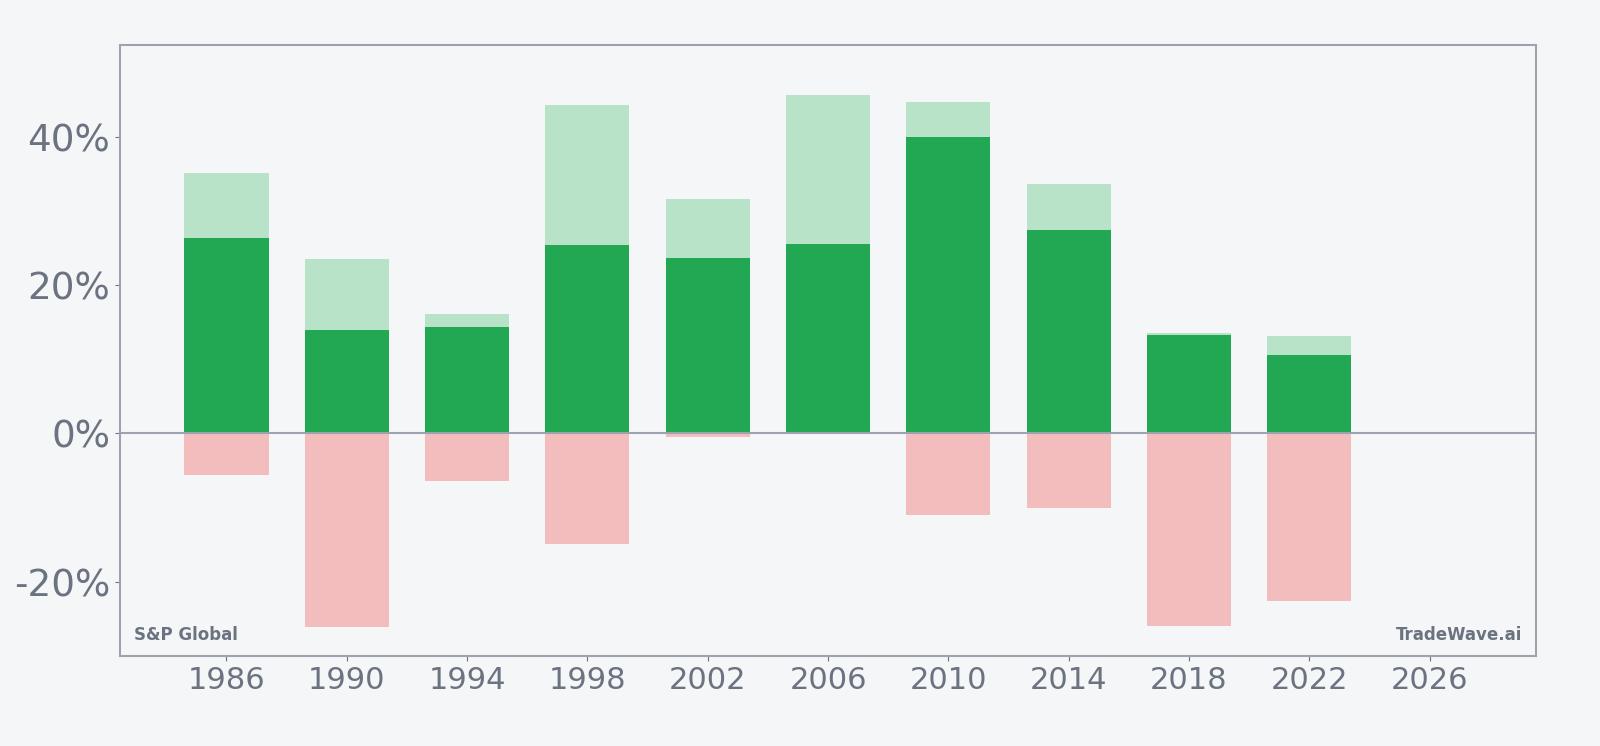
The MFE/MAE profile shows that upside has often been substantial, but the ride has not been smooth. In 2006, for example, S&P Global’s maximum favorable move reached 45.57%, while the worst intraperiod drawdown was a modest 1.67%, a near-ideal path for longs. By contrast, 1990 and 2018 still finished higher by 14.0% and 13.23% respectively, yet both years saw adverse excursions of roughly -26%, reminding traders that even “all green” seasonal windows can include deep pullbacks before the final gain is locked in.
History does not guarantee future results; adverse excursions can be large even in winning windows, and traders should treat this seasonal pattern as context rather than a forecast.
Why does S&P Global (SPGI) follow this seasonal pattern?
One likely driver is the way the presidential election cycle shapes risk appetite and capital markets activity. Analysts and portfolio managers often point to the late midterm and pre-election years as periods when policy uncertainty fades, issuance and deal-making pick up, and investors lean more heavily on benchmarks, ratings and analytics, all of which support S&P Global’s business. This pattern may also reflect institutional portfolio rebalancing and sector rotation into quality financial infrastructure names as the next election year approaches.
What is driving S&P Global (SPGI) today?
S&P Global closed Friday at 457.38, up 12.90 points or 2.9% on the session, trading between 444.60 and 457.55 on volume of about 1.6 million shares. The stock has climbed 17.95% over the past month and sits above its 50-day moving average of roughly 386.17, yet remains about 10.3% below its 52-week high near 509.70, leaving room between the current price and prior peak.
The recent path to that level has been volatile. In February 2026, S&P Global issued full-year 2026 adjusted EPS guidance of $19.40 to $19.65, below analysts’ average estimate of about $19.94, triggering an approximately 18% premarket drop as investors questioned how AI-driven disruption might pressure parts of the franchise.[3] In April 2026, the company reported first-quarter profit of $4.69 per share on revenue of $4.17 billion, up 10%, with management citing strong demand for analytics and risk products amid geopolitical and market volatility, which helped shares recover with a roughly 1.3% premarket rise on the day of the release.[4]
Those cross-currents have left S&P Global trading at a lower price-to-sales multiple than a year earlier, with one February 2026 analysis flagging the stock as about 32% cheaper on that metric while still benefiting from high margins and growing subscription revenue in Market Intelligence and Ratings.[1] The combination of a cheaper valuation, solid demand for data and analytics, and lingering concern about AI competition sets the stage for how investors may respond as the historically strong seasonal window opens.
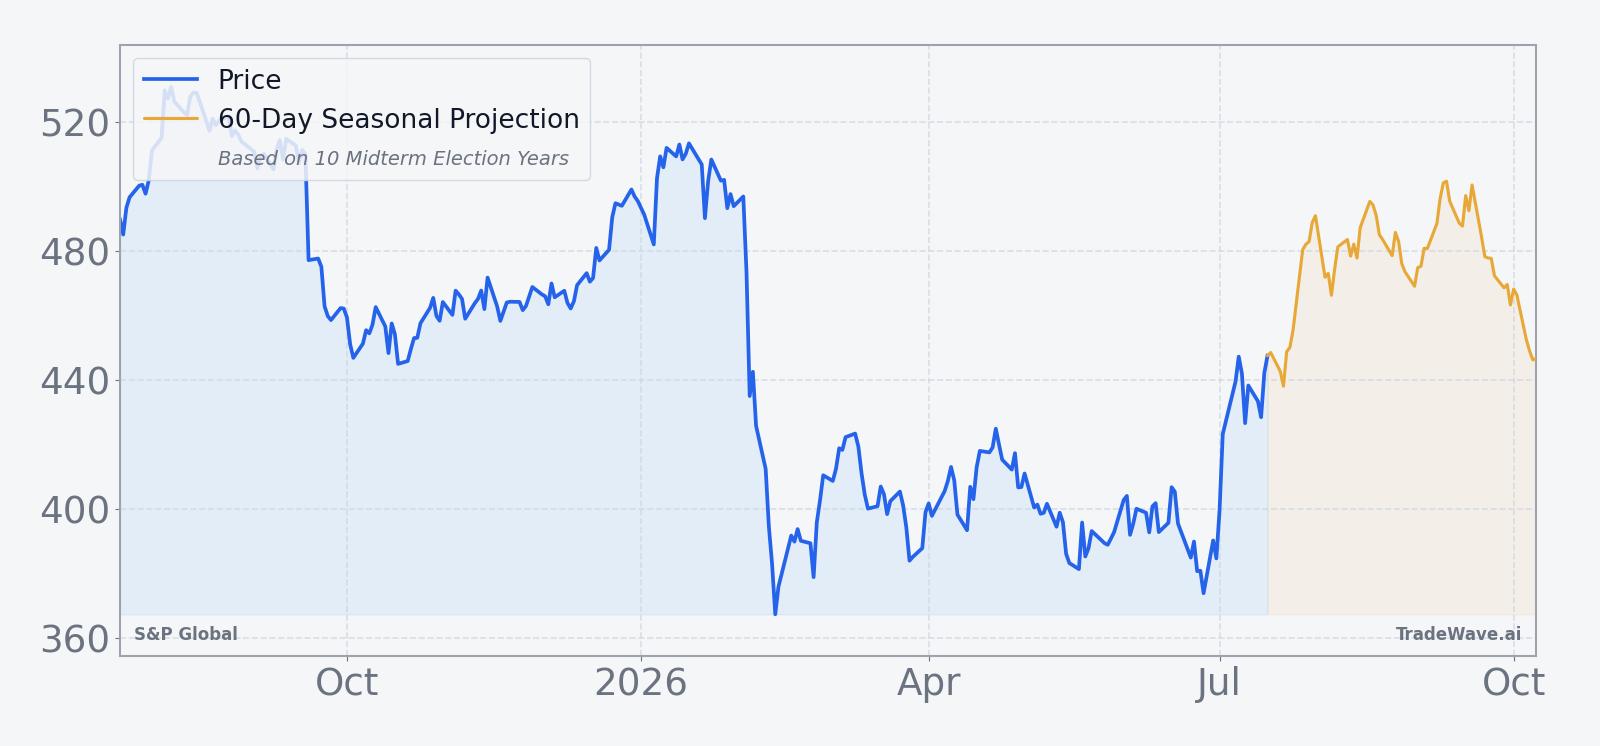
The chart below situates the latest rebound against the past year’s swings and overlays a short-term seasonal projection.
What should traders watch as this S&P Global (SPGI) window opens?
First, watch how SPGI behaves around the Jul 22 start date relative to its 50-day moving average and the 450–470 zone that has defined the latest rebound. A firm hold above that band as the window begins would be more consistent with the historical pattern of steady gains, while a quick break back toward the mid-400s would signal a bumpier path than the seasonal average suggests.
Second, monitor earnings and guidance updates against the backdrop of AI and macro volatility. In February and April 2026, sharp price moves around guidance and results showed how quickly sentiment can swing when investors reassess growth in analytics and ratings.[3][4] Similar reactions in upcoming quarters, especially if guidance shifts again, would either reinforce or challenge the idea that this midterm-to-pre-election stretch remains a supportive environment for S&P Global.
Third, keep an eye on intraperiod swings relative to the historical MFE and MAE profile. Past windows have seen maximum favorable moves north of 40% but also drawdowns near -26%, so a deep pullback inside the window would not be unprecedented. The key tell will be whether those dips are ultimately bought, preserving the long streak of positive outcomes, or whether a year finally breaks the 10-for-10 record.
Sources
- Forbes: "S&P Global Stock Now 32% Cheaper: Is It Time To Buy?" (Feb 12, 2026)
- Reuters: "S&P Global forecasts annual profit above estimates on strong demand" (Jul 31, 2025)
- Reuters: "S&P Global forecasts 2026 profit below estimates, shares plunge" (Feb 10, 2026)
- Reuters: "S&P Global reports higher first-quarter profit on demand for analytics products" (Apr 28, 2026)
About this seasonal analysis
Seasonal pattern data is sourced from TradeWave.ai, which analyzes historical price behavior across annual calendar windows going back up to 30 years. Read the full data methodology or the book The 100-Year Pattern by Afshin Moshrefi (2026 edition). Past performance of seasonal patterns does not guarantee future results. This article is for informational purposes only and does not constitute investment advice.