This 53-Day Midterm Stretch Has Delivered 87% Cumulative Gains for Northrop Grumman (NOC)
Northrop Grumman is trading near $578 just as a 53-day late-summer window opens that has delivered gains in every midterm election year in the past four decades.
Price as of Aug 10, 2026: $577.89 (last close).
What is the seasonal pattern for Northrop Grumman (NOC)?
Northrop Grumman has risen in 10 of 10 midterm-year late-summer windows starting Aug 11, with an average gain of 6.56% in winning years.
- 10 for 10 in this window, with Northrop Grumman averaging 6.56% gains across winning years from Aug 11 to Oct 2.
- Percent Profitable is 100%, with 10 winners and 0 losers across the last 10 midterm election years in this 53-day stretch.
- The trade direction is long, and the pattern’s Sharpe ratio of 1.63 points to a historically strong risk‑adjusted profile.
- Average profit of 6.56% comes alongside a TradeWave Ratio of 1.93, showing that price has typically traveled meaningfully in the trade direction within the window.
- Individual years have seen sizable swings, with some windows experiencing double‑digit intraperiod rallies and notable drawdowns before finishing higher.
- Stacked across cycles, this specific Northrop Grumman trading window has compounded to an 87% cumulative gain over the 10-sample history.
According to historical data from TradeWave.ai, this late-summer stretch for Northrop Grumman behaves very differently from an average month on the calendar, especially in midterm election years.
How has Northrop Grumman (NOC) traded in this midterm-year late-summer window?
Northrop Grumman has closed higher in every one of the past 10 midterm election years during the 53-day window that runs from Aug 11 to Oct 2, averaging a 6.56% gain. Shares opened this year’s window at $575 and finished Monday at $577.89, up 1.1% on the day and sitting about 24.7% below a 52-week high near $767.[11] That combination of a strong historical seasonal trend and a stock trading well off its peak gives this defense name a very different setup than it had during last year’s run to records.
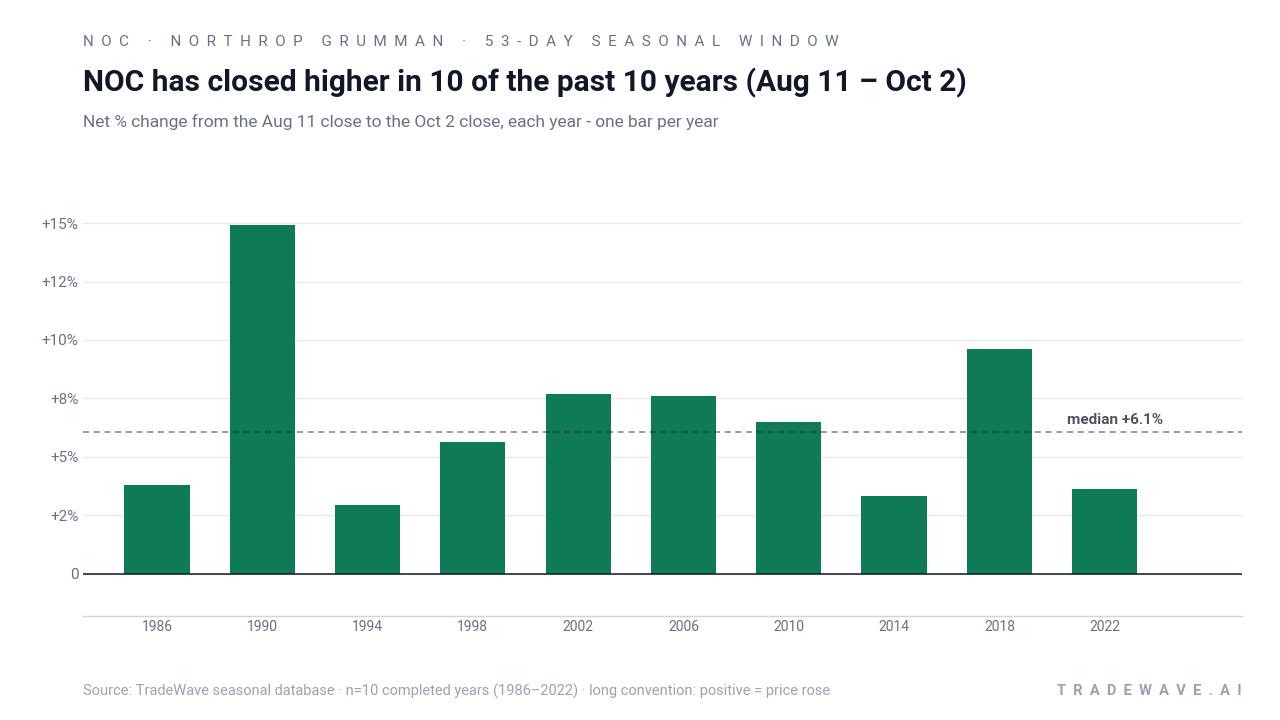
Because this pattern is grouped by presidential election cycle, it only looks at late-summer behavior in midterm election years, not every calendar year. That matters for a contractor like Northrop Grumman, since midterm years often coincide with budget fights, defense appropriations debates and shifting expectations for future spending that can drive sector rotation in aerospace and defense stocks.[1]
Across the 10-sample history, the average winner gain of 6.56% sits on top of an 87% cumulative return from repeatedly holding only this Aug 11 to Oct 2 slice in each midterm year. The median outcome is close to the mean at 6.06%, which tells you the distribution has not been dominated by a single outlier year. Even the softer years, such as 1994’s 2.96% gain or 1986’s 3.8%, still finished positive, while stronger cycles like 1990 and 2018 posted double‑digit advances of 14.9% and 9.6% respectively.
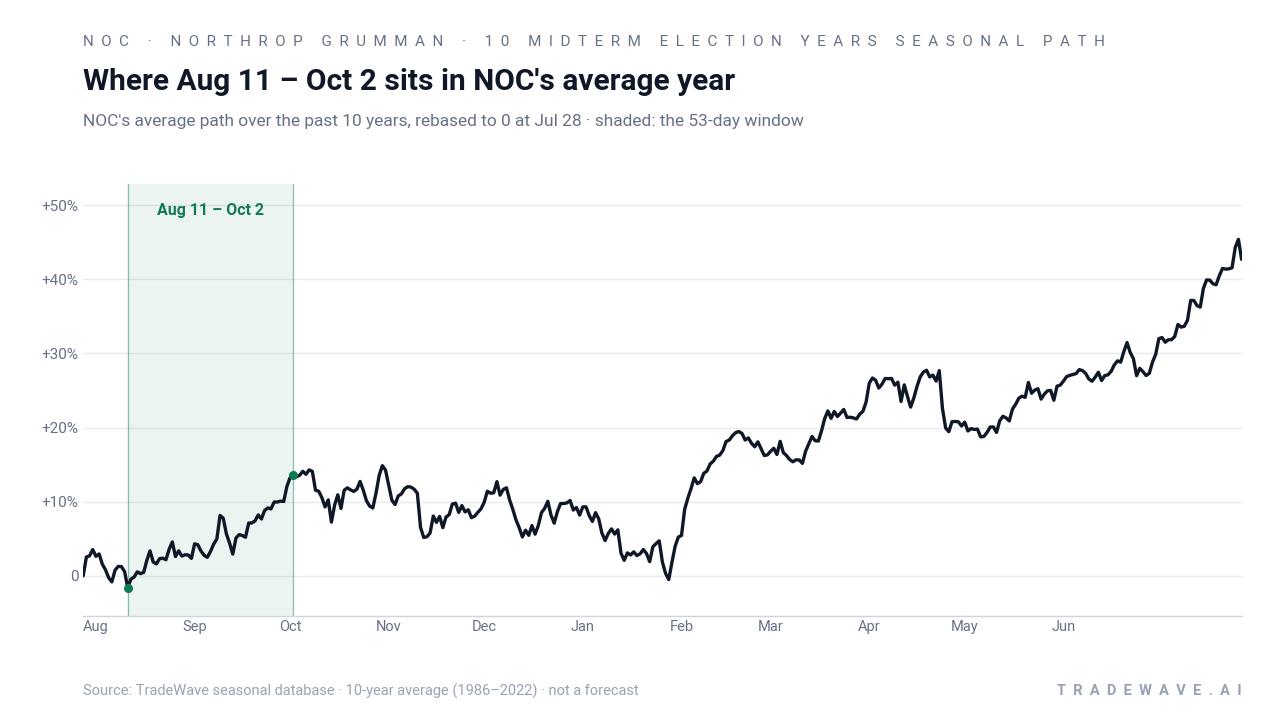
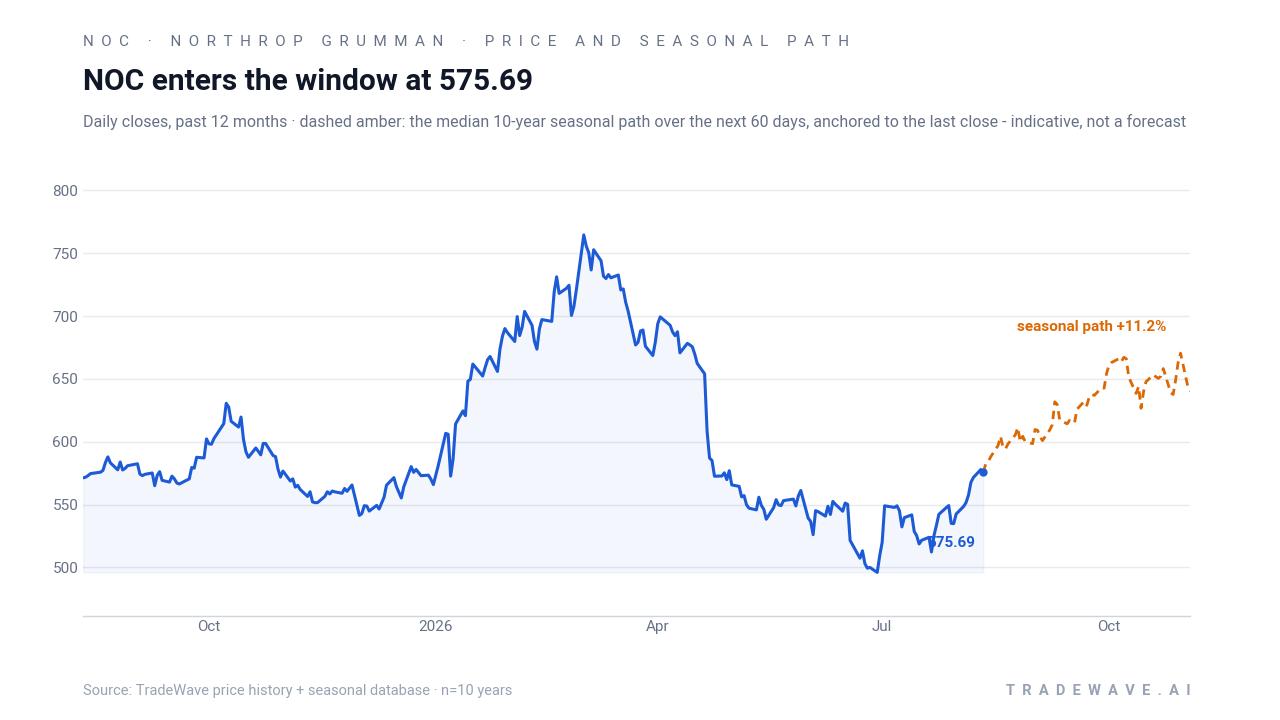
The historical seasonal trend chart shows a steady upward bias once the window begins, with gains tending to accrue through the middle of the period rather than spiking only at the end. That profile fits a narrative where investors gradually price in clarity on budgets and macro conditions as the midterm year moves from summer toward the fourth quarter.
A closer look at individual years shows how much room NOC has typically had to run, and how deep drawdowns have gotten inside the window.
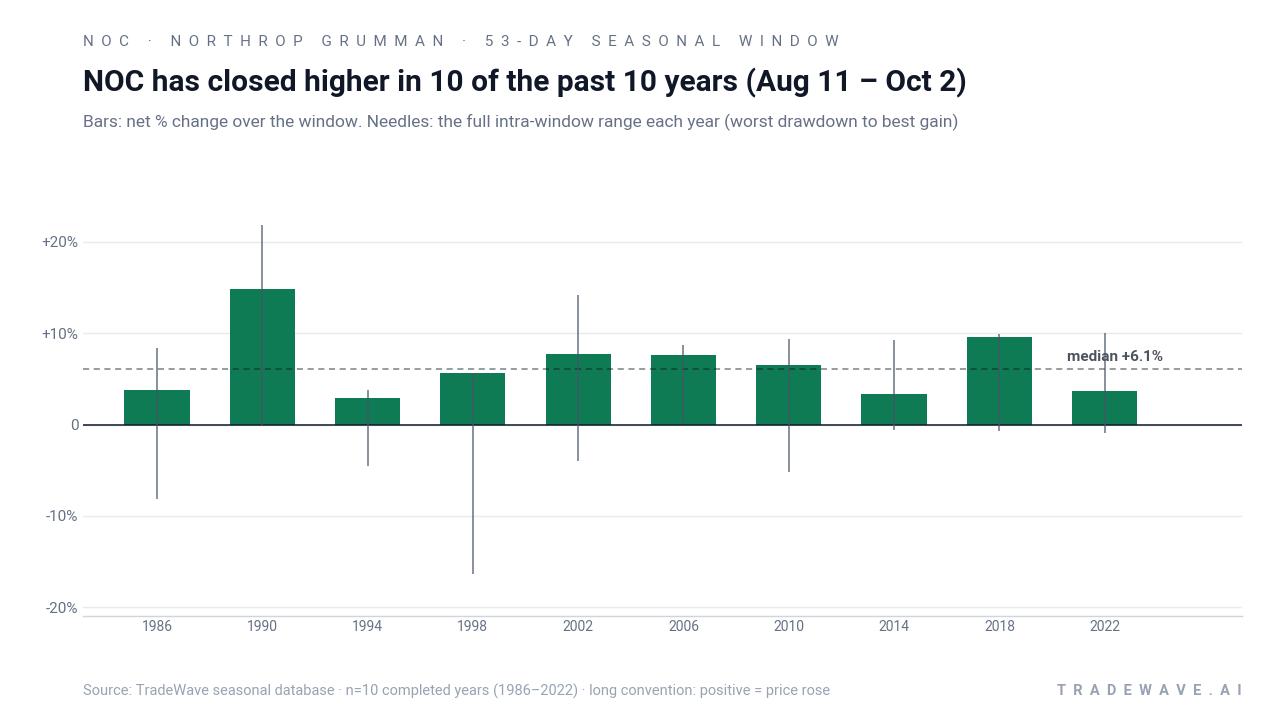
The per-year maximum favorable move and maximum adverse move profile is not one‑way traffic. In 1998, for example, NOC finished the window up 5.62% but saw an intraperiod drawdown of about 16.33% from entry before recovering, while 1990 delivered a 21.81% best run-up with essentially no adverse move recorded. More recent cycles such as 2018 and 2022 show best gains near 10% with intraperiod pullbacks contained to roughly 1% or less, suggesting that in the modern era the window has often rewarded patience without demanding extreme pain tolerance.
Put together, the pattern is clear: in the last 10 midterm election years, this late-summer window has favored longs every single time, with consistent mid‑single to low‑double‑digit gains and manageable drawdowns in most cycles.
Why does Northrop Grumman (NOC) follow this seasonal pattern?
One likely driver is the timing of the U.S. federal budget and defense appropriations process, which tends to come into sharper focus in late summer of midterm election years. Analysts have also pointed to institutional portfolio repositioning around fiscal year‑ends and shifting expectations for defense spending as Congress and the administration negotiate priorities.[1] For a pure‑play defense contractor like Northrop Grumman, that mix of policy headlines and fund flows may help explain why this specific late‑summer window has repeatedly skewed positive.
History does not guarantee future results, and even in a 10-for-10 window, adverse excursions within the period can be large before any recovery.
What is driving Northrop Grumman (NOC) today?
Northrop Grumman closed Monday at $577.89, up 1.1% on the session, extending a roughly 6.66% gain over the past month as the stock rebounds from a 52-week low near $479 and remains well below its 52-week high around $767.[5][11] The stock is trading above its 50-day moving average near $536 and on lighter-than-average volume relative to a 20-day average of about 897,000 shares, suggesting the recent climb has been steady rather than euphoric.[5][11]
Institutional positioning has been active around the name this summer. In late July, Lazard Asset Management trimmed its stake in Northrop Grumman, a move that came after a strong multi-year run and ahead of the current late-summer window.[1] That was followed by fresh interest from NWI Management, which disclosed a new position in early August, and NewEdge Advisors, which reported acquiring 8,735 shares, signaling that some managers are leaning into the defense contractor at current levels.[2][6]
On the fundamental side, Northrop Grumman is still trading in the shadow of a record backlog and a 2026 guidance update announced on Mar 2, 2026, which helped drive a 5.9% jump on that day.[12] While that catalyst is several months old, it underpins the longer-term narrative that big-ticket programs in areas like strategic deterrence and advanced aircraft are likely to support revenue visibility even as investors debate valuation.[7][12] Analyst coverage reflects that balance: MarketBeat data shows the stock carries an average rating of “Moderate Buy” with a consensus price target around $659, implying upside from current levels but not the kind of deep discount that would attract pure value hunters.[4][7]
The chart below shows how NOC’s recent rebound lines up with its typical seasonal path over the next two months.
What should traders watch in this Northrop Grumman seasonal window?
First, watch how NOC behaves around the $575 to $600 band as the window progresses. In prior midterm years, the stock has often built gains gradually rather than in a single burst, so a steady grind higher with shallow pullbacks would be more in line with the historical pattern than a sharp spike followed by a stall.
Second, keep an eye on policy and budget headlines as Congress returns from recess and defense spending debates pick up. Any signs of incremental funding for key Northrop programs or clarity on long-term procurement plans could reinforce the historical late-summer strength, while unexpected cuts or delays would be a clear test of the pattern.[1][7]
Third, monitor institutional flow and analyst commentary. Additional 13F filings showing new positions or increases from large asset managers, or shifts in the consensus rating and target, would signal whether professional money is leaning with or against the seasonal bias as the window unfolds.[1][2][4][6] If the stock can hold above its 50-day moving average on any pullbacks and attract buying on dips, that would echo the “drawdown then recovery” behavior seen in several past cycles.
Finally, traders should track how closely NOC’s actual path hugs or diverges from the historical seasonal trend over the next 53 days. A firm move higher with contained intraperiod drawdowns would fit the 10-for-10 record, while a deep and persistent break lower would mark the first real challenge to a pattern that has quietly delivered an 87% cumulative gain across the last 10 midterm election years.
Sources
- MarketBeat: Lazard Asset Management LLC Trims Stock Holdings in Northrop Grumman Corporation (NOC) (Jul 29, 2026)
- MarketBeat: NewEdge Advisors LLC Acquires 8,735 Shares of Northrop Grumman Corporation (NOC) (Aug 8, 2026)
- MarketBeat: Northrop Grumman Corporation (NYSE:NOC) Receives Average Rating of "Moderate Buy" from Analysts (Aug 3, 2026)
- Zacks: Northrop Grumman (NOC) Earnings Calendar & Announcement (Aug 10, 2026)
- MarketBeat: NWI Management LP Takes Position in Northrop Grumman Corporation (NOC) (Aug 2, 2026)
- Barchart: Northrop Grumman Earnings Preview: What to Expect (Jun 29, 2026)
- Yahoo Finance: Northrop Grumman Corporation (NOC) Stock Price, News, Quote (Aug 10, 2026)
- Yahoo Finance / Simply Wall St: A Look At Northrop Grumman (NOC) Valuation After Its Recent Share Price Pullback (May 20, 2026)
- Yahoo Finance / Simply Wall St: A Look At Northrop Grumman (NOC) Valuation After Recent Share Price Weakness (May 6, 2026)
- Yahoo Finance / Simply Wall St: Assessing Northrop Grumman (NOC) Valuation After A Recent Pullback And Mixed Fair Value Signals (Apr 21, 2026)
- Yahoo Finance: Northrop Grumman (NOC) Is Up 5.9% After Record Backlog and 2026 Guidance Update (Mar 2, 2026)
About this seasonal analysis
Seasonal pattern data is sourced from TradeWave.ai, which analyzes historical price behavior across annual calendar windows going back up to 30 years. Read the full data methodology or the book The 100-Year Pattern by Afshin Moshrefi (2026 edition). Past performance of seasonal patterns does not guarantee future results. This article is for informational purposes only and does not constitute investment advice.