HP Inc. (HPQ) Has Rallied in 9 of 10 Midterm Fall Windows, Averaging 21.02% Gains
HP Inc. is trading just below its 52-week high as it heads toward a historically strong midterm-year seasonal window that has often rewarded long positions but with sharp drawdowns along the way.
Price as of Aug 10, 2026: $29.80 (last close).
What is the seasonal pattern for HP Inc. (HPQ)?
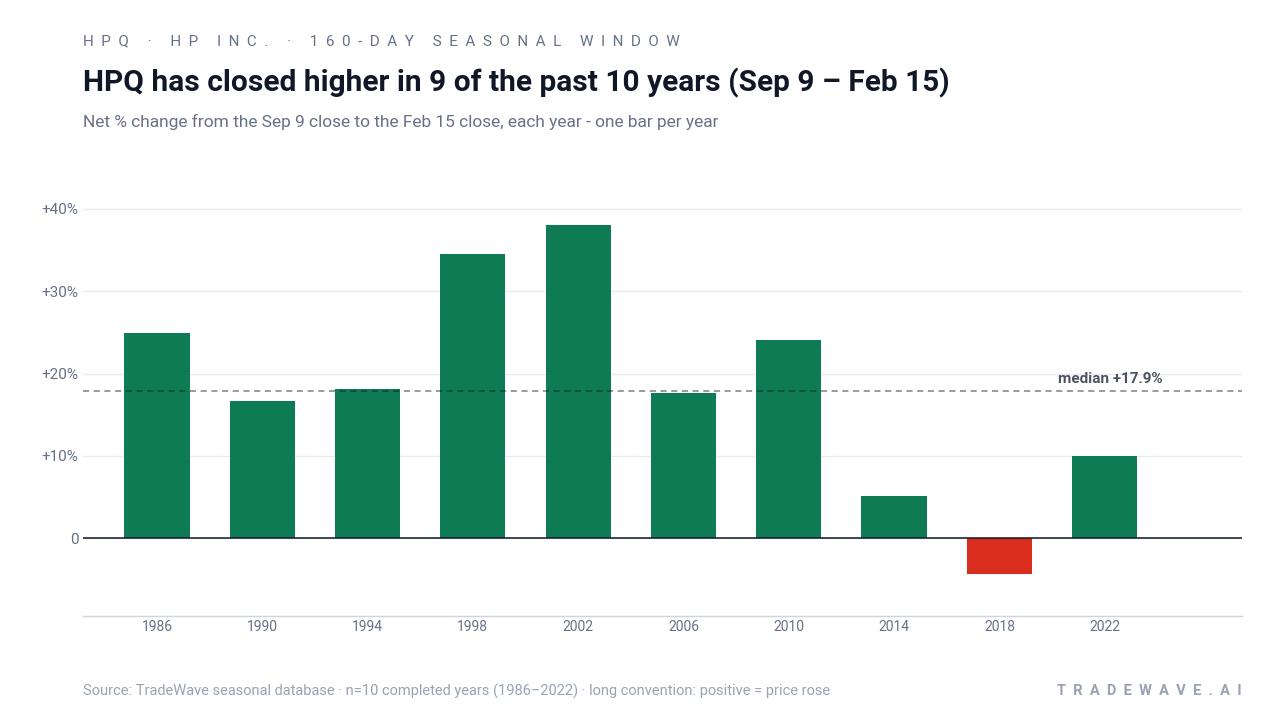
HP Inc. has risen in 9 of 10 years during this Sep 9 to Feb 15 midterm-year window, with an average gain of 21.02% in winning years.
- 9 for 10 in this window, averaging 21.02% gains in winning years across the last 10 midterm election cycles.
- Seasonal window runs from Sep 9 to Feb 15, a 160-day stretch that has historically favored long HPQ exposure.
- Percent Profitable is 90%, with 9 winners and 1 loser over the sample.
- Including all years, Avg Profit - All is 18%, reflecting one down year with a -4.34% loss.
- TradeWave Ratio of 1.39 signals that price has typically traveled meaningfully in the trade direction within the window.
- Intraperiod swings have been large at times, with some years showing double-digit drawdowns before finishing higher.
According to historical data from TradeWave.ai, this midterm-year stretch has behaved very differently from an average calendar quarter for HPQ, and the next iteration is less than a month away.
How has HP Inc. (HPQ) traded in the upcoming Sep 9 to Feb 15 window?
HP Inc. has closed higher in 9 of the last 10 midterm election years during the Sep 9 to Feb 15 window, with long trades in this slice of the calendar posting an average 21.02% gain in winning years. Shares finished Monday at 29.80, down 0.8% on the day and about 3.5% below their 52-week high of 30.87, leaving the stock near the top of its one-year range.[1]
The pattern sits inside the midterm election year, a phase where policy uncertainty and rate debates often keep cyclicals choppy early in the year but have historically given way to stronger risk appetite as investors look ahead to the pre-election year. For HPQ, the historical seasonality suggests that this late-year regime has been one of the more favorable stretches on the calendar for long exposure.
Across the 10 midterm-year samples since 1986, long trades in this HP Inc. trading window have produced a 90% win rate, with 9 winners and just 1 loser. Average gains in the up years clock in at 21.02%, while the single down year, 2018, saw a -4.34% loss, pulling the all-years average to 18%. That combination of a high hit rate and still-solid Avg Profit - All is unusual for a single stock pattern analysis and helps explain why this HPQ seasonal trend stands out.
The per-year breakdown shows how wide the range of outcomes has been. The strongest year in the sample, 2002, delivered a 38.0% net return in the window, with a best intraperiod run-up of 58.66% from the entry before giving back some gains. At the other end of the spectrum, 2018 was the lone losing year, finishing down 4.34% after suffering a worst drawdown of 21.03% from the starting level.
Those intraperiod swings matter. Maximum favorable excursion, or MFE, captures the best point-to-peak move within the window, while maximum adverse excursion, or MAE, tracks the worst drawdown from entry. In several years, including 1990 and 1998, HPQ saw MAE readings deeper than 20% even though the final outcome was positive, underscoring that this historically bullish window has not been a straight line.
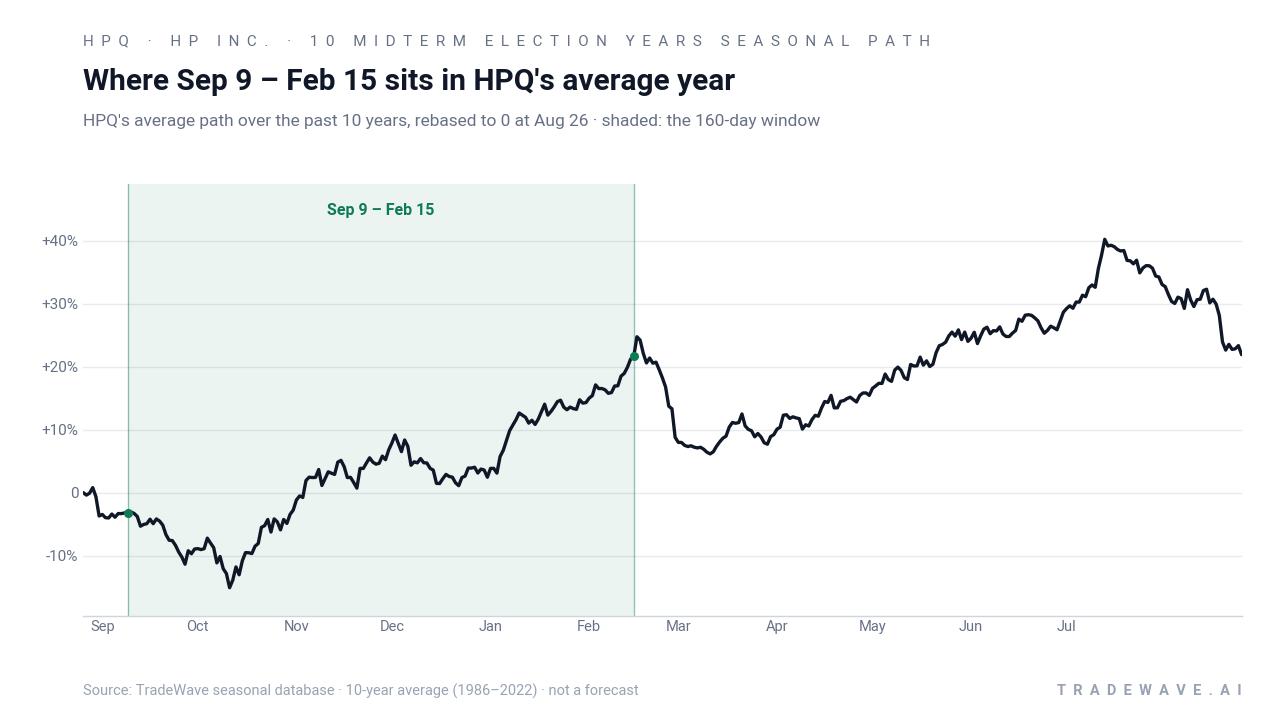
The historical seasonal average chart shows HPQ tending to grind higher through the heart of the window, with much of the net gain accruing between late October and early January. Earlier in the window, the average path is choppier, which lines up with the deeper MAE readings seen in some years before the trend reasserts higher.
Yearly net and intraperiod ranges highlight how upside and downside have coexisted in this window.
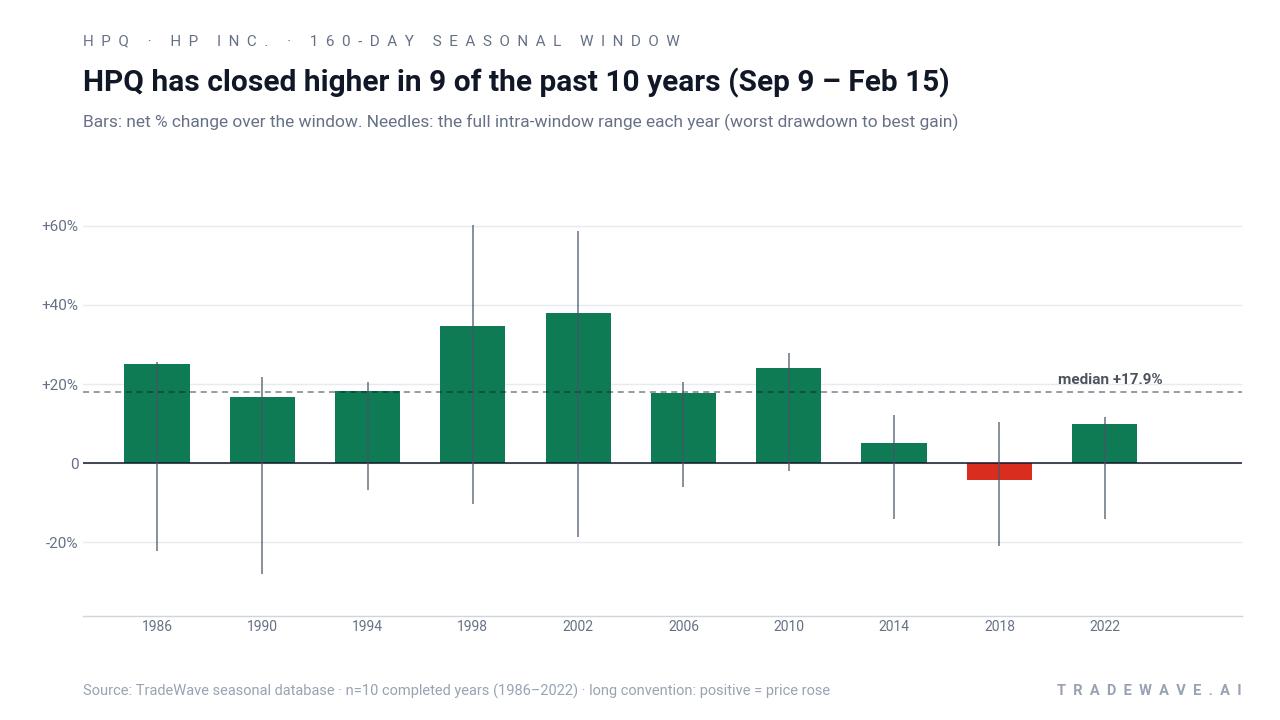
The stacked net, MAE and MFE view makes the trade-off clear. In most years, HPQ has eventually delivered a solid positive close, but the full intraperiod range often spans 30 percentage points or more between the worst drawdown and the best rally. The TradeWave Ratio of 1.39 captures that tendency for price to travel meaningfully in the trade direction within the window, even when the final net move is smaller than the peak run-up.
History does not guarantee future results; adverse excursions (MAE) can be large even in winning windows.
Why does HP Inc. (HPQ) follow this seasonal pattern?
One likely driver is the way HP Inc.’s earnings calendar and guidance cadence line up with the broader presidential election cycle. The Sep 9 to Feb 15 window typically captures the company’s late-summer report, holiday PC demand and early-year corporate IT budgeting, all against a backdrop of midterm-year policy uncertainty that often eases as investors look toward the pre-election year. Analysts have also pointed to sector rotation into value and cash-generative tech hardware late in midterm years as institutions rebalance portfolios and position for the next phase of the cycle.[3]
What is driving HP Inc. (HPQ) today?
HPQ slipped 0.8% in Monday’s session to 29.80, easing from an intraday high of 30.87 that also marked its 52-week peak, and leaving the stock about 79.6% above its 52-week low of roughly 16.60.[1] The pullback comes as investors look ahead to HP Inc.’s next earnings report on Aug 26, 2026, where analysts expect a roughly 12% year-over-year EPS decline alongside a 4.82% revenue increase after a strong second quarter that saw revenue up 9% and free cash flow swing to $756 million from a negative $145 million a year earlier.[1]
Valuation has been a key debate around the name. A July analysis framed HPQ as a value play after a prior pullback, arguing that tariff and geopolitical risks around China, plus margin pressure in PCs and printing, remain the main overhangs even as the company leans into AI-enabled devices and recurring revenue streams.[3] The same piece highlighted that consensus on Wall Street skews cautious, with a Sell rating and a price target that sits below the current quote, reflecting concerns that the stock has already priced in much of the near-term recovery.[1]
On the growth side, HP’s partnership with Nvidia to build AI-compatible PCs has become a central part of the bull case. In June 2026, coverage of the options market flagged that narrative as a driver for potential revenue and free cash flow improvement, tying it to a broader “future of work” push that includes software and services around AI workflows.[5] That same period saw unusual call options activity in HPQ, with heavy interest in out-of-the-money strikes that implied traders were willing to pay for upside exposure into 2027.[5]
The chart below situates the latest move in its recent multi-month context and overlays the median 60-day seasonal path.
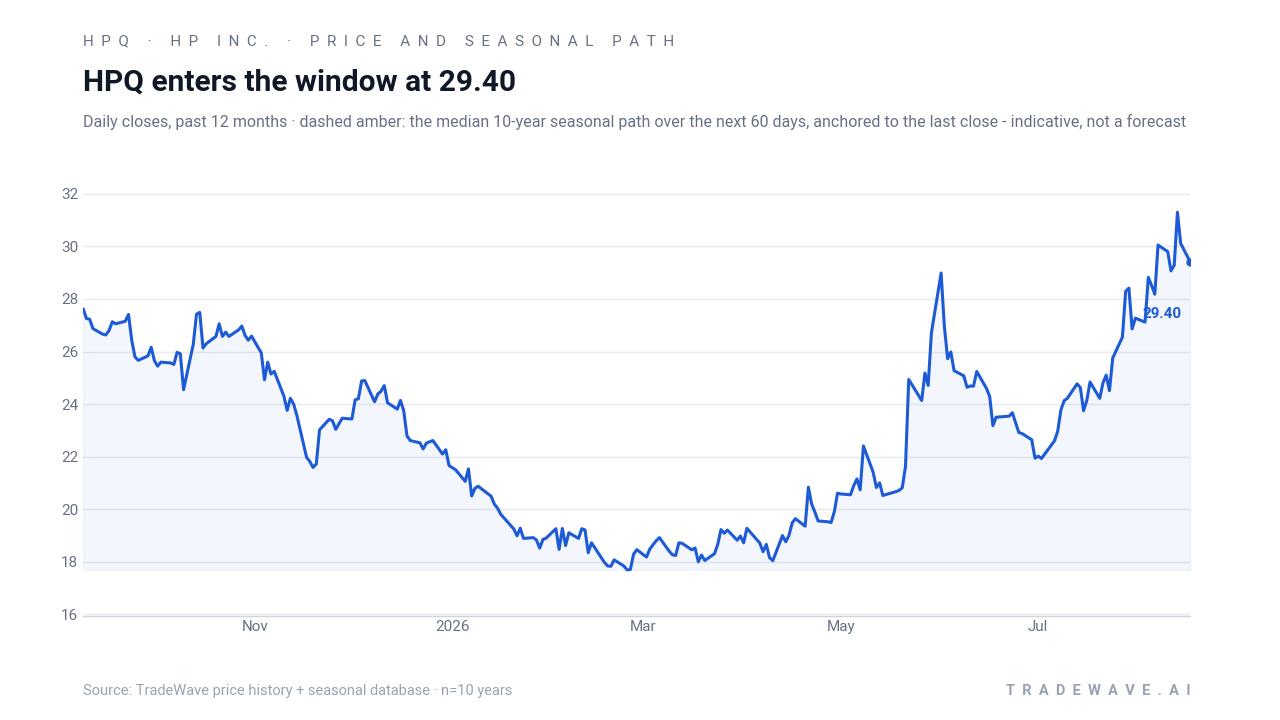
Macro conditions add another layer. PC and printer demand remain sensitive to global growth and trade policy, and recent commentary has stressed that tariffs and geopolitical tensions, particularly around China, could pressure pricing and margins even if unit volumes stabilize.[3] At the same time, sector research has emphasized AI-focused PCs and workplace platforms as a structural tailwind, arguing that a new upgrade cycle could support revenue and margin expansion over several years if adoption meets expectations.[2]
Against that backdrop, the upcoming midterm-year seasonal window takes on added significance. HPQ is entering it from a position of strength near its 52-week high, while the historical pattern points to a tendency for both sizable rallies and sharp drawdowns within the same 160-day stretch. For traders and longer-term investors alike, the combination of a strong HPQ seasonal trend, a cautious analyst stance and a live macro debate around tariffs and AI PCs sets up a period where price action could diverge meaningfully from the broader market narrative.
What should traders watch as this HPQ seasonal window approaches?
First, the Aug 26 earnings report will help determine whether HP Inc. can sustain its recent revenue momentum and free cash flow improvement into the back half of the year.[1] Guidance around AI PCs, enterprise IT budgets and any commentary on tariff exposure will shape how investors frame the risk-reward heading into the Sep 9 start of the historical window.
Second, price levels matter. The 52-week high at 30.87 is the immediate reference point; how HPQ behaves around that level in the coming weeks will show whether buyers are willing to push the stock into a breakout ahead of a window that has historically favored longs. A decisive move above that high with strong volume would fit the pattern of prior strong years, while a failure there could set up a more volatile path that still, historically, has often resolved higher by February.
Third, options and volume signals deserve attention. Earlier coverage of unusual call activity highlighted that some traders were already positioning for upside using out-of-the-money calls.[5] If that kind of bullish options flow and elevated volume reappears as Sep 9 approaches, it would suggest that the market is leaning into the historical seasonality; a fade in speculative call buying, by contrast, would hint that investors are more focused on macro and valuation risks than on the HPQ seasonal trend.
Finally, watch how HPQ trades relative to other PC and hardware names as policy headlines evolve. The midterm election year often brings shifting expectations around regulation, trade and fiscal policy, and HPQ’s reaction to those headlines inside this historically strong window will show whether the 9-for-10 record remains a useful guide or starts to break down. Add it up: earnings execution, behavior around the 52-week high, options positioning and macro newsflow will all help confirm or challenge what the last 10 midterm-year windows have delivered for HP Inc.
Sources
- Yahoo Finance, "HP Inc. (HPQ) Stock Price, News, Quote & History," Aug 10, 2026.
- Yahoo Finance, "Is HP (HPQ) Offering Value After Its Recent Share Price Slide?," Apr 28, 2026.
- Yahoo Finance, "HP (HPQ) Stock After Recent Pullback Is The Valuation Gap Too Wide?," Jul 12, 2026.
- Barchart, "HP Inc. Has Unusual Call Options Volume Today - Investors Bullish on HPQ Stock," Jun 1, 2026.
- Insider Monkey via Yahoo Finance, "HP Inc. (HPQ) Gets OK for Initiatives to Boost Growth, Jumps 7.7%," Apr 21, 2026.
About this seasonal analysis
Seasonal pattern data is sourced from TradeWave.ai, which analyzes historical price behavior across annual calendar windows going back up to 30 years. Read the full data methodology or the book The 100-Year Pattern by Afshin Moshrefi (2026 edition). Past performance of seasonal patterns does not guarantee future results. This article is for informational purposes only and does not constitute investment advice.