Ralph Lauren Corporation (RL) Has Risen in 6 of 6 Midterm Late-Summer Runs, Averaging 4.53% Gains
Ralph Lauren Corporation is heading toward an Aug 30–Sep 9 trading window that has quietly delivered gains in every midterm election year in the sample, just as the stock surges on a Q1 beat and higher fiscal 2027 guidance.
Price as of Aug 6, 2026: $395.83 (last close).
What is the seasonal pattern for Ralph Lauren Corporation (RL)?
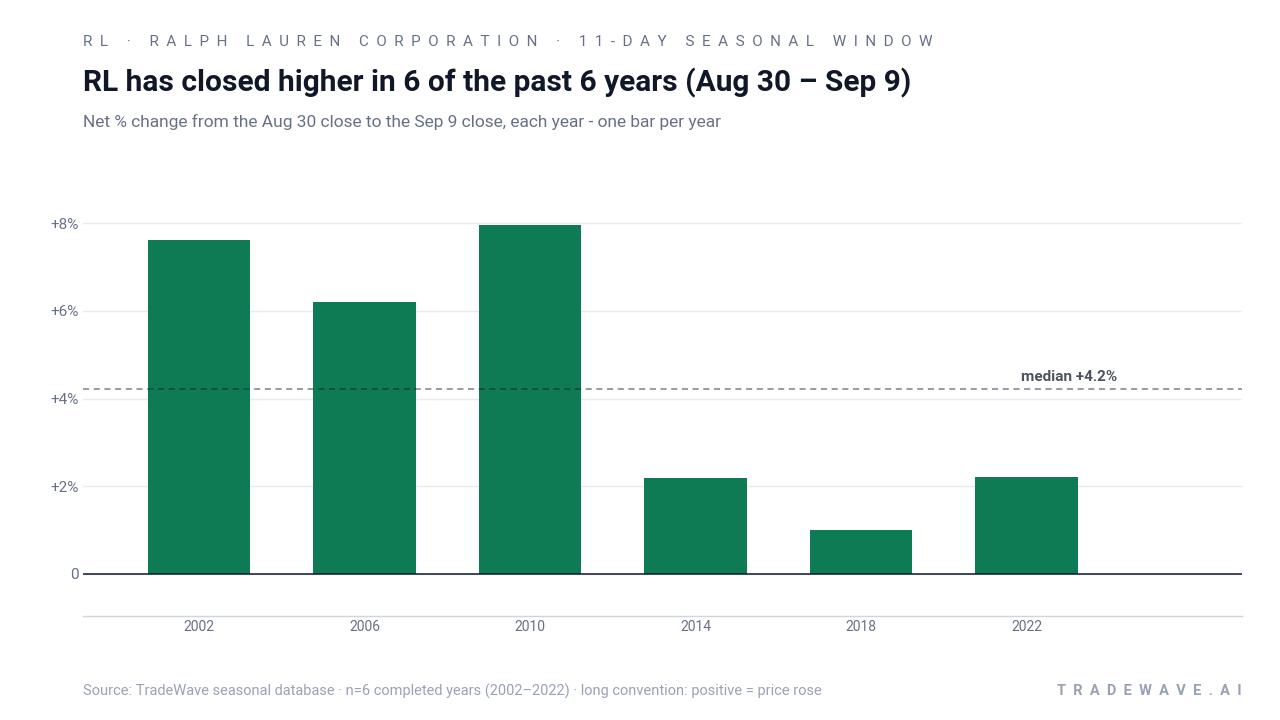
Ralph Lauren Corporation has risen in 6 of 6 midterm-year late-August to early-September windows, with an average gain of 4.53% in winning years.
- 6 for 6 in this window, averaging 4.53% gains in winning years across the last 6 midterm election cycles.
- Seasonal window runs from Aug 30 through Sep 9, spanning 11 calendar days in the midterm election year.
- Percent Profitable is 100%, with 6 winners and 0 losers in the historical sample.
- Average winner gain of 4.53% stacks to a 30% cumulative return when the window is repeated across all six years.
- TradeWave Ratio of 1.5 suggests price typically travels meaningfully in the long direction within the window, while the Sharpe ratio of 1.43 reflects favorable risk-adjusted returns.
- Intraperiod swings have included adverse moves as deep as about 7.5% in a single year, underscoring that even “all-win” windows can be bumpy.
According to historical data from TradeWave.ai, this late-summer stretch for Ralph Lauren Corporation behaves differently in midterm election years than in a typical calendar month, and the next iteration is approaching quickly.
How has Ralph Lauren Corporation (RL) traded in the late-August midterm-year window?
Ralph Lauren Corporation has risen in 6 of 6 midterm election years during the Aug 30 to Sep 9 window, averaging 4.53% gains for long positions. Shares finished Thursday at $395.83, up 4.0% on the day and about 5.7% below their 52-week high near $419.55.[2] That combination of a strong historical seasonal trend and a stock trading close to its highs after an earnings-driven jump is drawing fresh attention to this year’s setup.
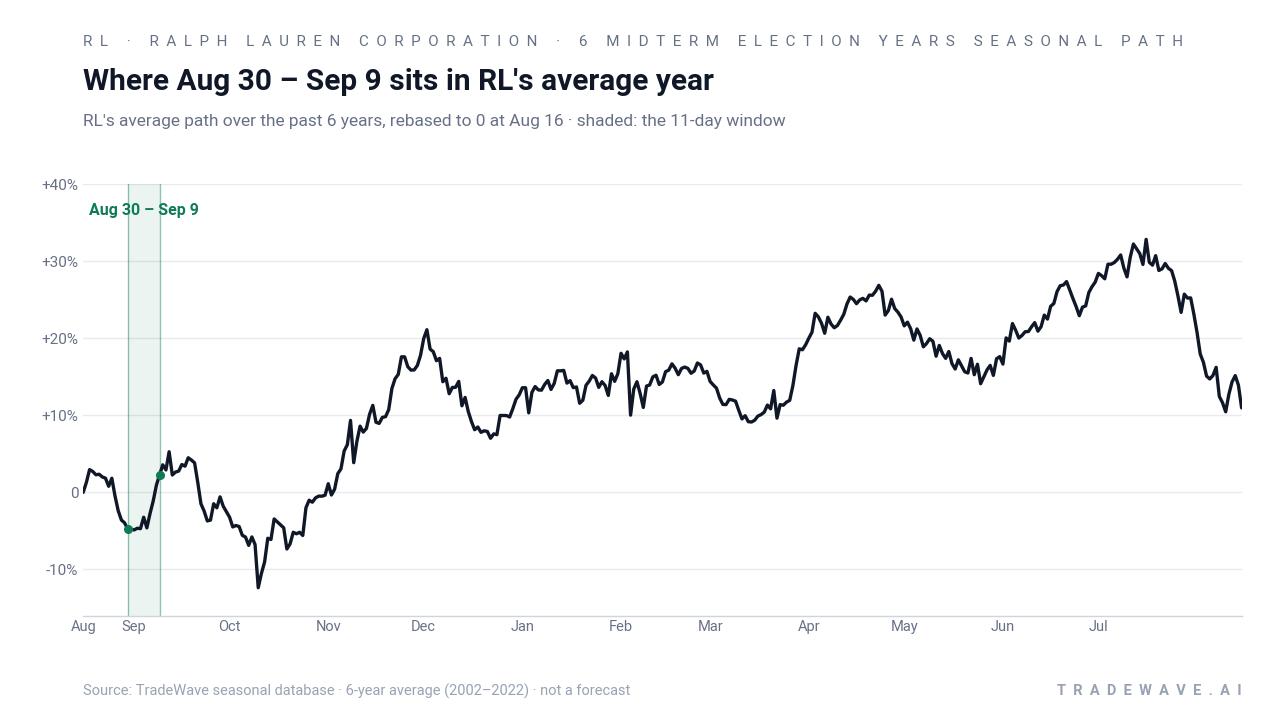
The pattern is built specifically on midterm election years, a phase of the presidential cycle that often brings policy uncertainty early in the year and more constructive risk appetite as investors look ahead to the pre-election period. Grouping Ralph Lauren’s late-August behavior by this cycle isolates how the stock has traded when Washington is in the same part of the four-year rhythm as it is today.
Across the six midterm-year samples from 2002 through 2022, every Aug 30 to Sep 9 window finished higher, with net gains ranging from 0.99% in 2018 to 7.95% in 2010. The strongest year in this RL seasonal trend was 2010, when the stock rallied 7.95% over the 11 days after entry, while the weakest still posted a positive 0.99% in 2018. Add it up and repeating the window across all six cycles would have compounded to roughly 30% cumulative gains.
Intraday and intraperiod swings have not been one-way. In 2022, for example, Ralph Lauren’s best run-up within the window reached 2.83%, but the worst drawdown from the entry point hit about 7.46% before the stock recovered to finish the period with a 2.21% gain. That profile, echoed in other years, shows why the TradeWave Ratio of 1.5 matters: price has typically moved meaningfully in the long direction at some point during the window, but the path has included sharp dips as well as rallies.
A second view combines yearly net results with the full intraperiod range of rallies and drawdowns.
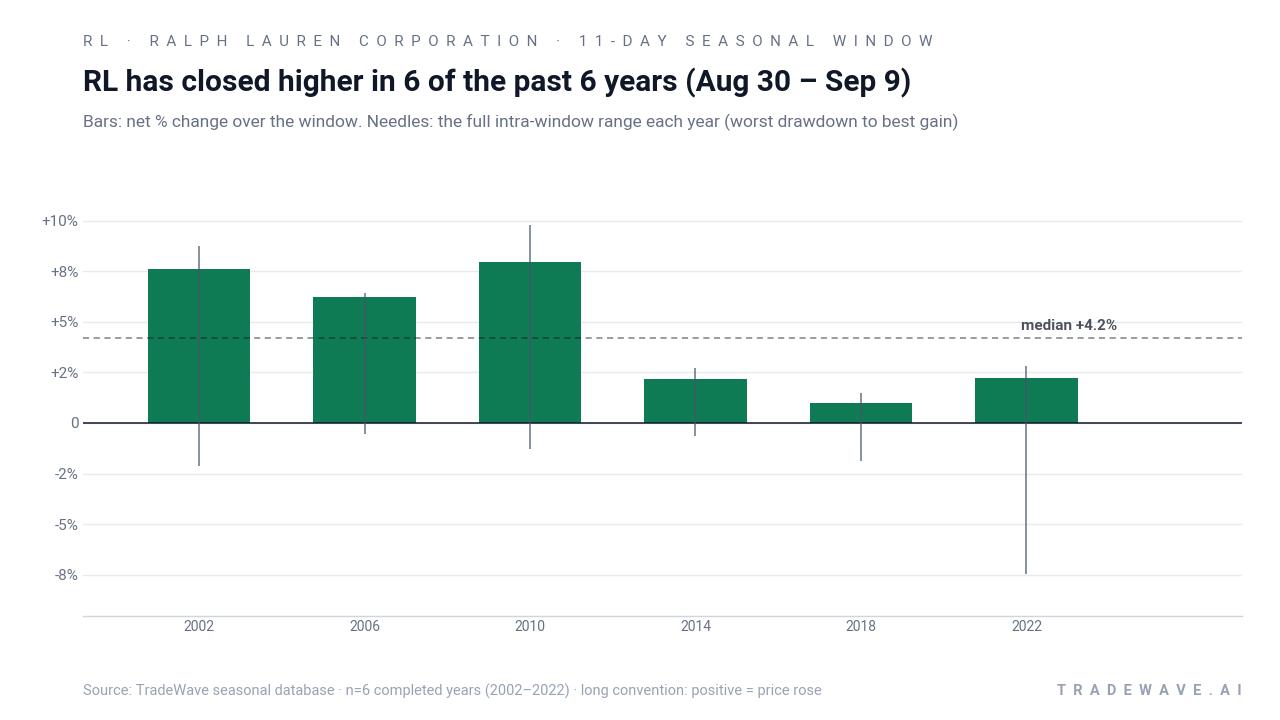
The stacked net / maximum favorable move / maximum adverse move view makes the trade-off clear. In years like 2002 and 2010, the best intraperiod rallies of 8.73% and 9.77% came with relatively modest worst drawdowns of about 2.12% and 1.27%. In 2022, by contrast, the window still finished higher but only after absorbing a roughly 7.46% adverse move from the entry level. Historically, this has been a bullish RL seasonal trend for longs, but not a low-volatility one.
The cumulative chart of this Ralph Lauren Corporation trading window reinforces that message. Stacking the 11-day midterm-year window on top of itself across the six samples produces a smooth climb to about 30.1% cumulative gains, with no interruptions from losing years. The pattern is clear: this specific late-August to early-September stretch has favored long exposure in 6 of 6 midterm election years.
History does not guarantee future results; adverse excursions (the worst intraperiod drawdowns) can be large even in winning windows.
Why does Ralph Lauren Corporation (RL) follow this seasonal pattern?
One likely driver is the way the fashion calendar and wholesale ordering cycle line up with the political calendar. Late August in a midterm election year often coincides with retailers finalizing fall assortments and investors digesting early-fiscal results, which can concentrate positive news flow for premium apparel names. This pattern may also reflect portfolio managers repositioning into consumer discretionary stocks ahead of the historically stronger pre-election year, using names like Ralph Lauren as vehicles for that shift.
What is driving Ralph Lauren Corporation (RL) today?
Ralph Lauren shares closed Thursday at $395.83, up $15.05 or 4.0% on the session, leaving the stock roughly 0.11% higher over the past month and about 5.7% below its 52-week high near $419.55.[2] The move followed a stronger-than-expected Q1 fiscal 2027 report on Aug 6, where the company delivered $1.96 billion in revenue, up 14% year over year and ahead of the $1.88 billion Zacks consensus, with adjusted EPS of $4.59 topping expectations of $4.30.[3] Management also raised its fiscal 2027 outlook, guiding to roughly 5% to 6% constant-currency revenue growth on a 52-week comparable basis, up from 4% to 5%, and flagged stronger margin expansion in the first half of the year while noting that foreign exchange should be roughly neutral for margins in fiscal 2027.[3]
The chart below situates the latest move in its recent multi-month context and overlays the median historical seasonal path for the next 60 days.
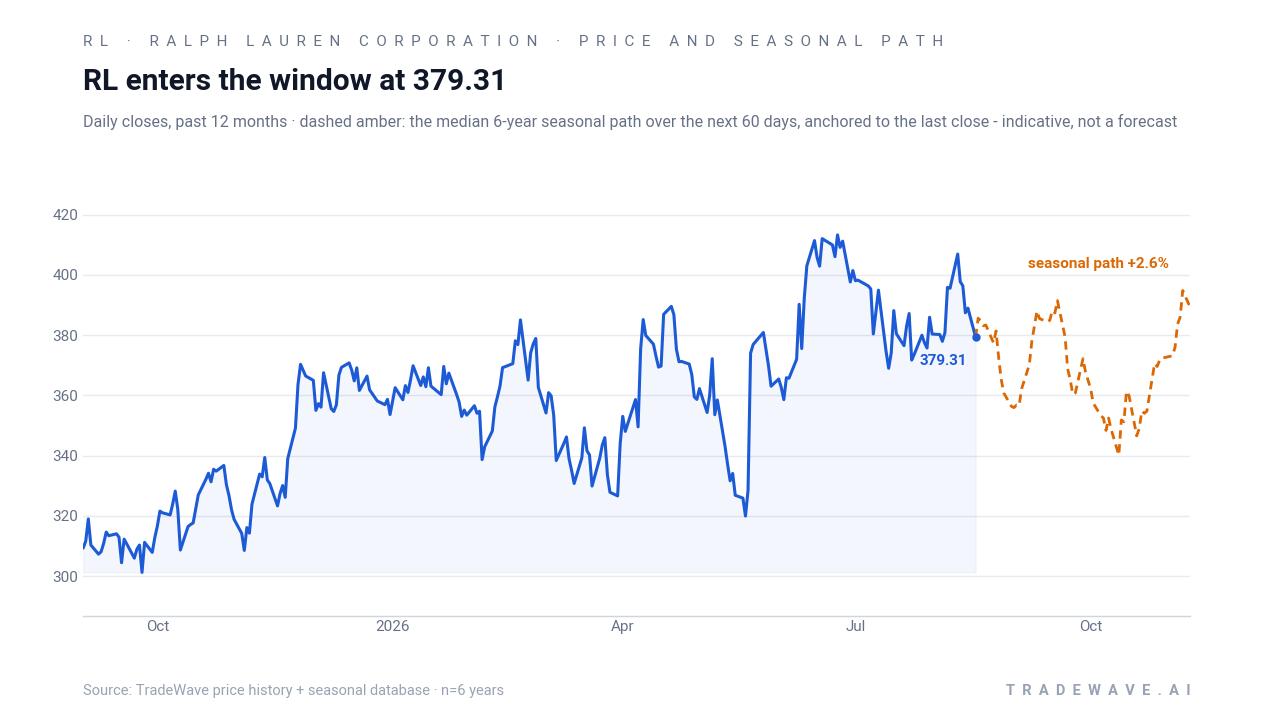
In late July, Zacks noted that Ralph Lauren had seen a 5.61% decline over the prior month, underperforming parts of the consumer discretionary sector even as earnings expectations remained constructive.[2] Ahead of this week’s report, the firm highlighted a positive Earnings ESP and a history of upside surprises, arguing that the stock was again positioned to beat estimates.[4] With that thesis now validated by the Q1 beat and raised guidance, the focus shifts to whether the stock can hold its post-earnings gains into the historically strong late-August seasonal window and how macro factors such as consumer spending and currency trends evolve as fiscal 2027 unfolds.[3]
Analyst sentiment remains measured despite the rally. ChartMill and Zacks data show a consensus “Hold” rating on Ralph Lauren, with a blended price target around $437 that sits modestly above Thursday’s close, reflecting expectations for continued but not explosive upside from here.[1] For traders watching the RL seasonal trend, that backdrop of cautious optimism, fresh earnings momentum and a stock trading near the upper end of its 12-month range sets the stage for a closely watched Aug 30 entry into the midterm-year window.
What should traders watch as the Aug 30 window approaches?
First, the calendar. The 11-day window begins on Aug 30 and runs through Sep 9, so price action in the final weeks of August will shape the entry level and the risk-reward profile for anyone tracking this historical seasonality. A pullback toward the 50-day moving average near $385.33 would present a different setup than a continued grind toward the 52-week high around $419.55.[2]
Second, intraperiod volatility. Past midterm-year windows have seen maximum adverse moves as deep as about 7.5% even in years that ultimately finished higher, so traders will be watching whether any early drawdowns in this year’s window resemble the 2022 pattern or the shallower dips seen in 2006 and 2010. A quick shakeout followed by a recovery would be consistent with the historical RL seasonal trend, while a sustained break lower through key support would mark a clear departure from the six-for-six record.
Third, the policy and macro backdrop. Midterm election years often feature shifting expectations around fiscal policy and regulation, and this one is no exception. For a global luxury and premium apparel brand like Ralph Lauren, investors will be monitoring consumer spending data, commentary from peers in the consumer discretionary sector, and any signs that currency, which management currently expects to be roughly neutral for margins, is starting to move in a way that could help or hurt fiscal 2027 profitability.[3]
Finally, behavior inside the window itself will be the real test. If Ralph Lauren again grinds higher through the Aug 30 to Sep 9 stretch, even with some intraday turbulence, it would extend a 6-for-6 record that already stands out among S&P 500 stocks in this part of the election cycle. A flat or negative outcome would not invalidate the pattern, but it would remind traders that even the cleanest historical seasonality is a tendency, not a rule.
Sources
- ChartMill: RL Forecast, Price Target & Analyst Ratings (Aug 3, 2026).
- Zacks: Why Ralph Lauren (RL) Outpaced the Stock Market Today (Jul 30, 2026).
- Zacks: Ralph Lauren Q1 Earnings Beat on Strong Demand and Margin Growth (Aug 6, 2026).
- Zacks: Why Ralph Lauren (RL) is Poised to Beat Earnings Estimates Again (Aug 5, 2026).
- Zacks: Ralph Lauren (RL) Earnings Calendar & Announcement (Aug 7, 2026).
About this seasonal analysis
Seasonal pattern data is sourced from TradeWave.ai, which analyzes historical price behavior across annual calendar windows going back up to 30 years. Read the full data methodology or the book The 100-Year Pattern by Afshin Moshrefi (2026 edition). Past performance of seasonal patterns does not guarantee future results. This article is for informational purposes only and does not constitute investment advice.