Amphenol (APH) Has Closed Higher in 8 Straight Midterm Sep-Apr Windows, Averaging ~13% Gains
Amphenol is heading into a historically strong Sep–Apr stretch just as shares hover near record highs on AI-fueled demand and upbeat earnings.
Price as of Aug 7, 2026: $169.18 (last close).

What is the seasonal pattern for Amphenol (APH)?
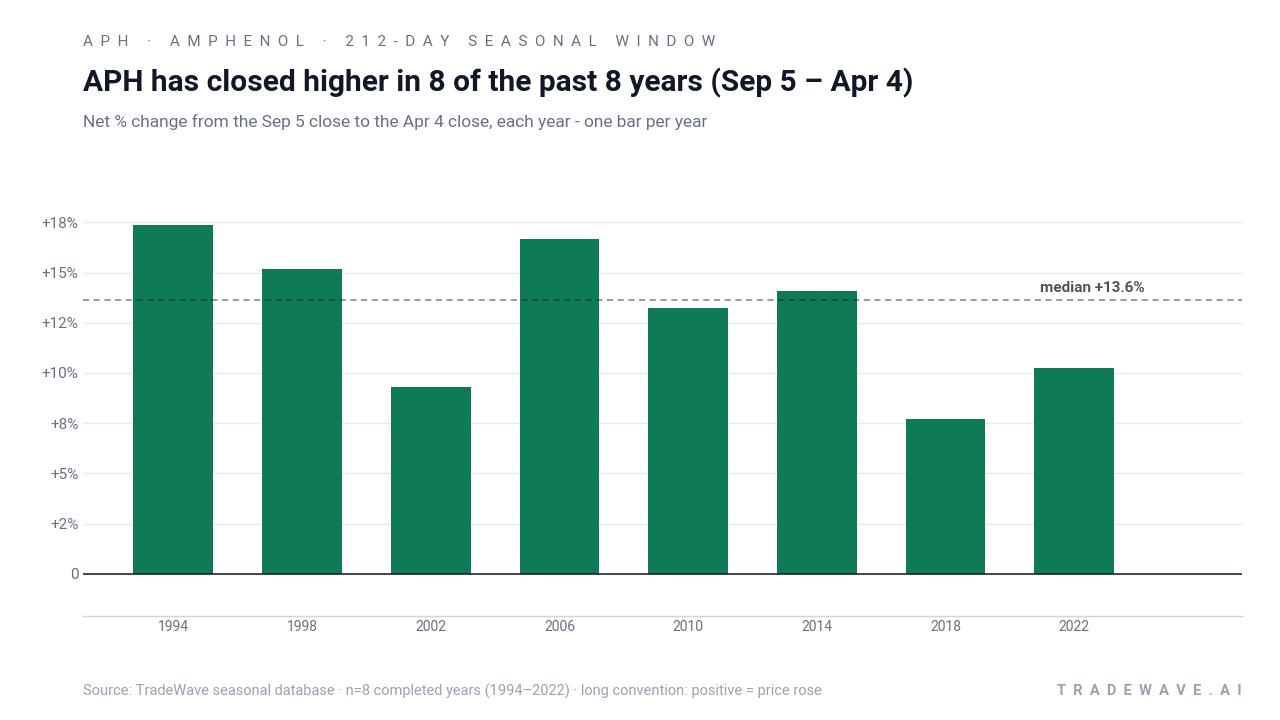
Amphenol has risen in 8 of 8 midterm-election-year Sep 5–Apr 4 windows, with an average gain of 12.98% in winning years.
- 8 for 8 in this window, averaging 12.98% gains in winning years across the last 8 midterm election cycles.
- Percent Profitable is 100%, with 8 winners and 0 losers for long positions in the Sep 5–Apr 4 Amphenol trading window.
- The pattern spans 212 calendar days and has compounded to a 164% cumulative return when stacked across all eight historical windows.
- Average annualized return of 12.93% and a Sharpe ratio of 3.02 point to unusually strong risk-adjusted seasonality.
- The TradeWave Ratio of 2.43 signals that price has typically traveled meaningfully in the trade direction within the window, not just at the close.
- Some years have seen deep intraperiod drawdowns even in the end-of-window winners, so timing and risk controls still matter.
According to historical data from TradeWave.ai, this upcoming Sep 5–Apr 4 stretch has behaved very differently from an average calendar period for Amphenol in past midterm election years.
How strong is Amphenol (APH) in the Sep 5–Apr 4 seasonal window?
Amphenol has closed higher in every single Sep 5–Apr 4 window across the last eight midterm election years, averaging nearly 13% gains for long positions. Shares finished Monday at $169.18, down 0.8% on the day and about 5.2% below their 52-week high of $178.52, leaving the stock still near the top of its one-year range. A large July put-sale, where a trader sold 5,500 July 17, 2026 $105 puts, underscored bullish positioning beneath the surface and signaled confidence that any pullbacks could be contained well above that strike.[9]
The Sep 5–Apr 4 window sits squarely in the midterm election year, a phase that often sees policy uncertainty give way to more stable spending plans and clearer capital expenditure pipelines. Grouping Amphenol’s history by this presidential cycle phase rather than by simple calendar years captures how those policy rhythms line up with the company’s order patterns and investor risk appetite.
Across the eight completed midterm-year windows since 1994, Amphenol’s long-only strategy in this stretch has delivered a 164% cumulative return when each window is compounded on top of the last. The average annualized return clocks in at 12.93%, and the Sharpe ratio of 3.02 signals that the gains have come with relatively low volatility compared with the payoff. In plain English, this has not just been a “usually up” window; it has been a consistently strong one on a risk-adjusted basis.
Individual years show some variation but lean firmly bullish. The strongest close-to-close gain in the sample came in 2006, when the stock rose 16.68% between early September and early April, while 1994, 1998, 2010 and 2014 all posted mid-teens returns. Even the softest outcome, in 2018, still produced a 7.73% gain for the window, which would be a solid year for many large industrial names.
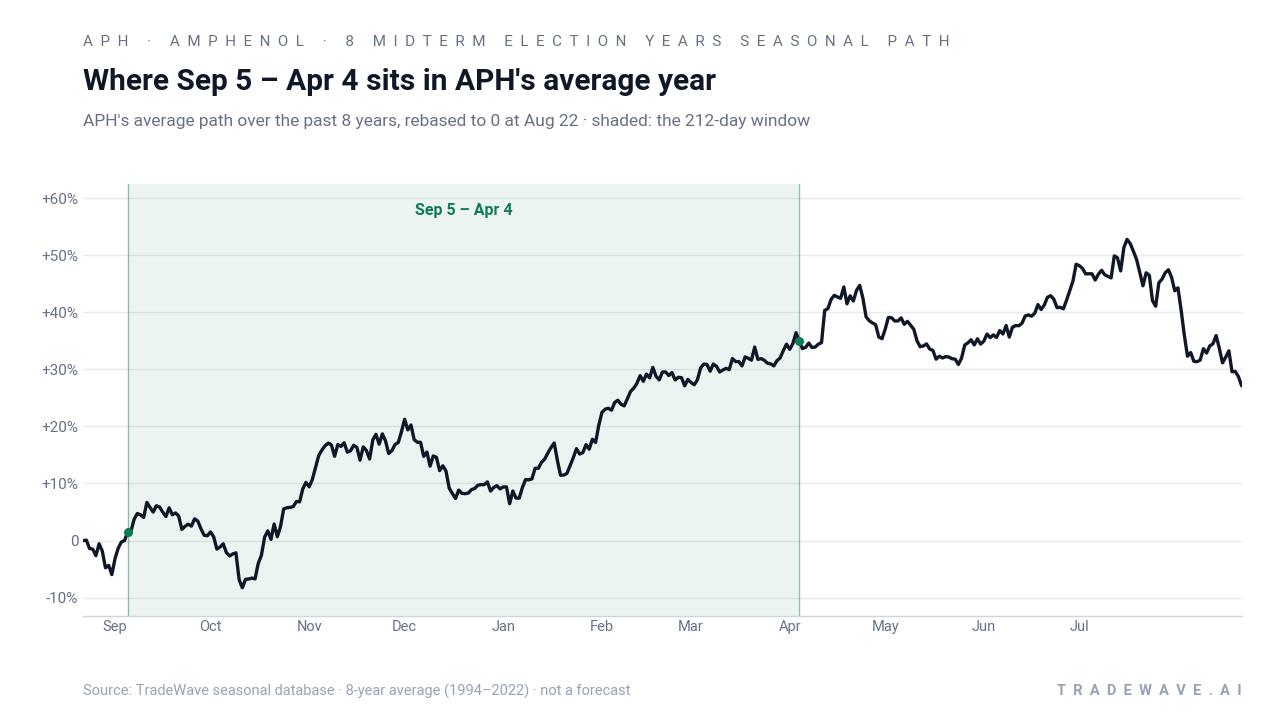
The historical average path suggests that strength in this Amphenol trading window tends to be persistent rather than front-loaded. Returns build gradually across the 212 days, which fits a story of steady order flow and incremental estimate revisions rather than one-off event spikes. For investors watching the APH seasonal trend, that means the pattern has historically rewarded patience more than quick flips.
Yearly net and intraperiod swings show how much room Amphenol has typically given traders on both the upside and downside inside this window.
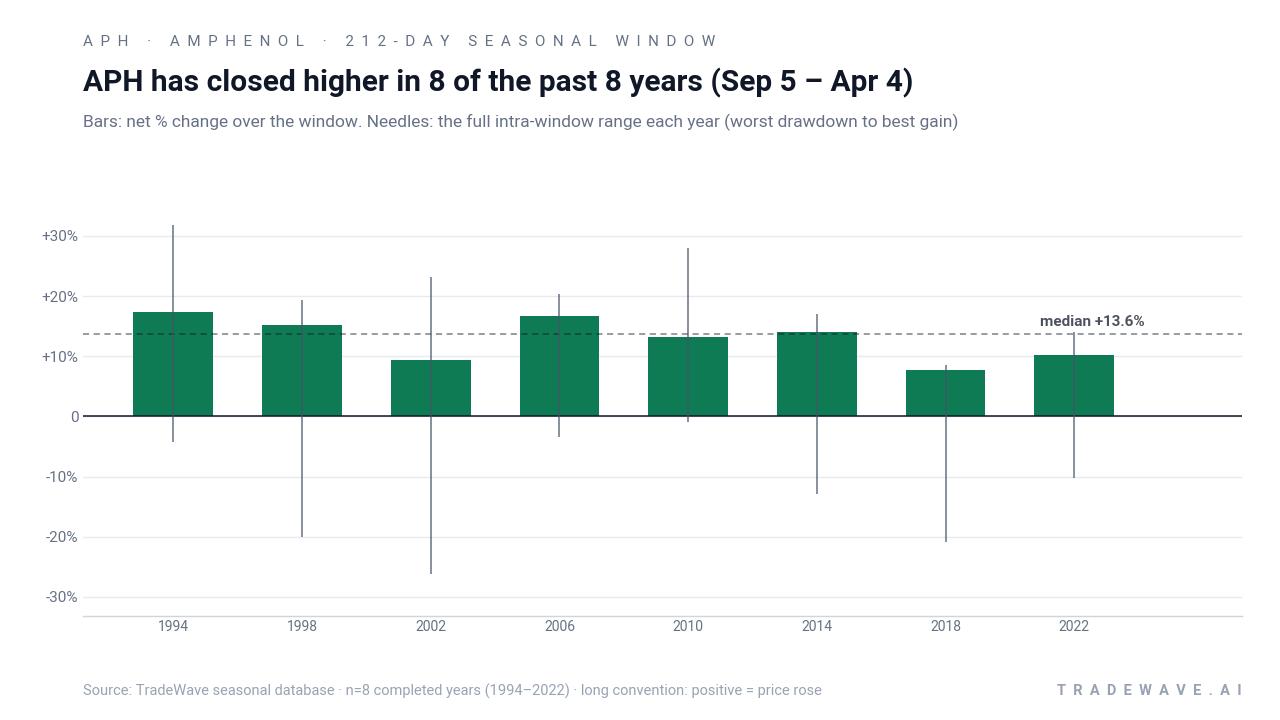
The bar-and-range view makes clear that even a “perfect” 8-for-8 record has come with real risk. Maximum favorable moves have reached into the low- to mid-20% range in several years, but maximum adverse excursions have also stretched to roughly 20% to 26% in weaker stretches such as 1998, 2002 and 2018. That combination of large best-case and worst-case moves is exactly what the TradeWave Ratio of 2.43 is flagging: this is a window where the stock has tended to travel a long way in the trade direction, but not without meaningful drawdowns along the path.
History does not guarantee future results; adverse excursions (MAE) can be large even in winning windows.
Why does Amphenol (APH) follow this seasonal pattern?
One likely driver is the way Amphenol’s earnings calendar and customer budgets line up with the political cycle. Midterm election years often bring clarity on regulation and fiscal priorities heading into the following pre-election year, which can unlock datacom and industrial connectivity spending that benefits Amphenol’s order book.[4] Analysts have also pointed to AI infrastructure buildouts and fiber-optic projects that tend to ramp through the back half of the year and into spring, reinforcing this Sep–Apr seasonal bias for the stock.[4]
What is driving Amphenol (APH) today?
Amphenol slipped 0.8% Monday to $169.18, easing from last week’s highs but still trading about 5.2% below its 52-week peak of $178.52 and well above its 50-day moving average near $157.52. The stock has been digesting a powerful run that accelerated after a strong Q2 report on Jul 29, when the company beat on both earnings and revenue and guided Q3 materially above Wall Street estimates.[2][8] Management projected Q3 EPS of $1.40 to $1.42 and revenue of $9.3 billion to $9.4 billion, versus consensus closer to $1.26 and $8.6 billion, reinforcing the view that Amphenol is riding a durable demand wave in AI infrastructure and high-speed connectivity.[2][4]
Analysts have responded by lifting targets and reiterating bullish calls. MarketBeat’s aggregate shows a Buy consensus on the stock, while firms such as BNP Paribas Exane have pushed price targets as high as $215, citing Amphenol’s leverage to datacenter and networking capex tied to AI workloads.[1][3][4][5] Zacks has also highlighted positive earnings estimate revisions and a favorable ranking for the name, arguing that the fundamental backdrop supports continued outperformance versus broader tech benchmarks.[7] In parallel, some institutional holders have trimmed positions after the rally, but those moves have been framed more as portfolio rebalancing than a shift in the core thesis.[1][3][5]
Options and volatility data add another layer to the story. In July, a notable trade saw a large investor sell 5,500 July 17, 2026 $105 puts at $1.40, effectively expressing confidence that Amphenol will remain comfortably above that level over the next two years.[9] Barchart’s coverage of earlier earnings reactions pointed to elevated day-0 trading ranges around results, with one analysis citing a 7.72% average move on Q1 earnings days, underscoring how event-driven volatility has clustered around the company’s quarterly updates.[6][10] Against that backdrop, the upcoming seasonal window looks less like a standalone anomaly and more like a regime where strong fundamentals, supportive policy dynamics and investor positioning have historically lined up in the same direction.
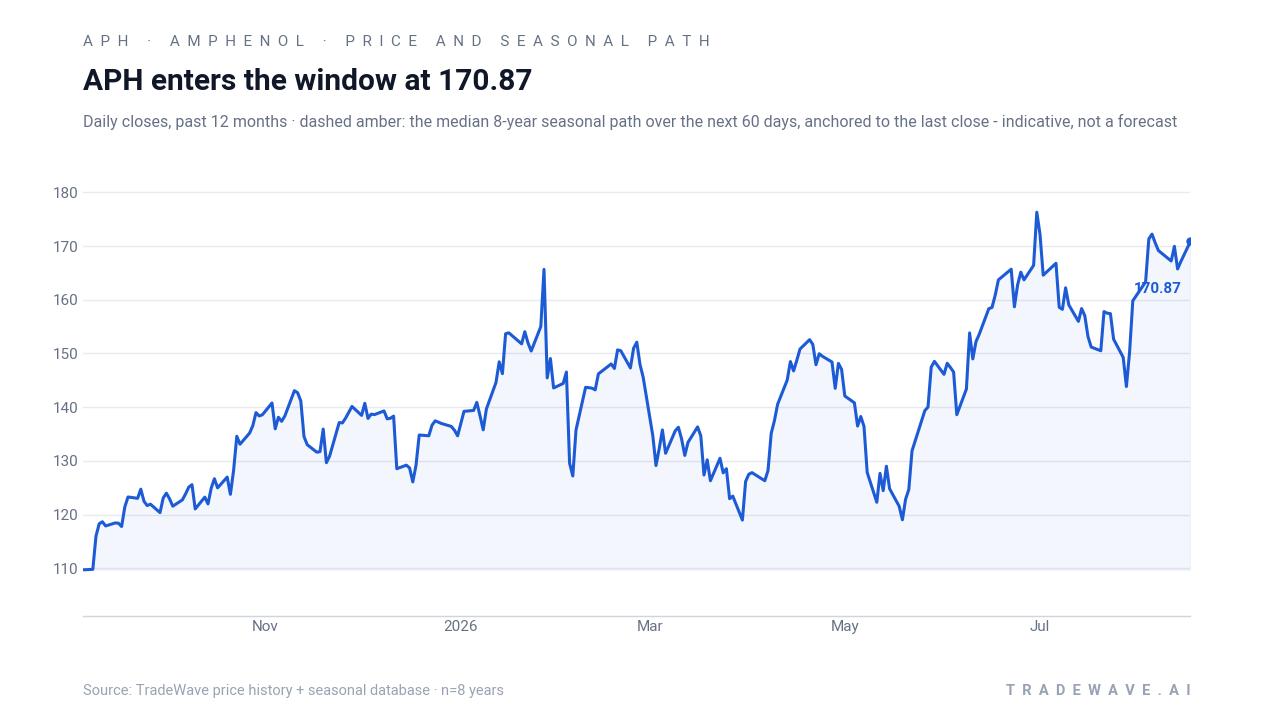
The chart below situates the latest pullback against Amphenol’s 12-month rally and the median seasonal path over the next two months.
What should traders watch as Amphenol (APH) approaches this window?
First, the calendar. The 212-day window opens on Sep 5 and runs through Apr 4, covering the late stages of the midterm election year and the early part of the following pre-election year. Historically, that has been a sweet spot for Amphenol, with 8 winners out of 8 and average gains near 13%, but the path has included intraperiod drawdowns that reached roughly 20% to 26% in some cycles. How the stock behaves into and through that start date will tell traders whether this cycle is tracking the historical script or diverging.
Second, the policy and macro backdrop. As Washington moves from midterm campaigning toward a more stable policy stance, investors will be watching for clarity on infrastructure spending, digital connectivity initiatives and any regulatory shifts that could affect datacenter buildouts. For a connectivity and electrical components supplier like Amphenol, confirmation that AI infrastructure budgets remain intact or even expand into 2027 would align with the historical pattern of strength in this part of the presidential cycle.[4][10]
Third, earnings and guidance. The company’s next set of results will land inside this seasonal regime, and the bar is now higher after Q2’s beat-and-raise performance.[2][8] Traders will be looking for whether order growth in datacom, automotive and industrial end markets can sustain double-digit trends, and whether management keeps nudging guidance higher or starts to talk about normalization. A continuation of upside surprises would rhyme with prior midterm-year windows where the stock’s gains built steadily across multiple quarters.
Finally, watch the options tape and positioning. The large July 2026 put-sale at $105 effectively set a line in the sand far below current levels, but follow-through matters: if similar bullish structures keep printing or implied volatility stays bid into earnings, it would suggest that institutional players are leaning into the seasonal tailwind rather than fading it.[9][10] On the other hand, a shift toward heavy call overwriting or protective put buying closer to spot would signal that big money is using strength to de-risk, which would be a notable break from the historical pattern of constructive behavior in this window.
Sources
- MarketBeat: Amphenol Corporation $APH Stock Holdings Lessened by Ravenstone Capital Management Inc. (Aug 3, 2026)
- MarketBeat: Amphenol (NYSE:APH) Stock Price Expected to Rise, Citigroup Analyst Says (Jul 30, 2026)
- MarketBeat: The Manufacturers Life Insurance Company Sells 437,582 Shares of Amphenol Corporation $APH (Jul 29, 2026)
- MarketBeat: Amphenol (NYSE:APH) Given New $215.00 Price Target at BNP Paribas Exane (Jul 30, 2026)
- MarketBeat: Pacer Advisors Inc. Reduces Stock Holdings in Amphenol Corporation $APH (Aug 5, 2026)
- Barchart: Is Amphenol Stock Outperforming the Nasdaq? (Jun 2, 2026)
- Zacks: Why Amphenol (APH) Might be Well Poised for a Surge (Aug 5, 2026)
- Barchart: Amphenol (NYSE:APH) Surprises With Strong Q2 CY2026, Stock Soars (Jul 29, 2026)
- Yahoo Finance: Is Amphenol Corporation (APH) A Good Stock To Buy Now? (Jul 11, 2026)
- Barchart: Amphenol's AI Infrastructure Thesis Gets Its Most Important Validation Yet (Jul 28, 2026)
About this seasonal analysis
Seasonal pattern data is sourced from TradeWave.ai, which analyzes historical price behavior across annual calendar windows going back up to 30 years. Read the full data methodology or the book The 100-Year Pattern by Afshin Moshrefi (2026 edition). Past performance of seasonal patterns does not guarantee future results. This article is for informational purposes only and does not constitute investment advice.