Marriott International (MAR) Has Rallied in 7 of 7 Midterm Runs, Averaging 18.69% Gains
Marriott International is heading toward a historically strong midterm-year trading window even as shares slide after Q2 earnings and geopolitical headwinds, setting up a sharp contrast between the chart and the calendar.
Price as of Aug 3, 2026: $346.83 (last close).

What is the seasonal pattern for Marriott International (MAR)?
Marriott International has risen in 7 of 7 midterm-year windows running from late August to mid-July, with an average gain of 18.69% in winning years.
- 7 for 7 in this window, with Marriott International averaging 18.69% gains in those winning years.
- Seasonal window runs roughly 319 days from Aug 28 to Jul 12, covering the late midterm year into the pre-election year.
- Percent Profitable is 100%, with 7 winners and 0 losers across the last 7 midterm election years.
- Trade Direction is long, supported by a Sharpe ratio of 3.76 and a TradeWave Ratio (TWR) of 2.44.
- Individual years have seen strong upside bursts, with maximum favorable moves as high as about 42% but also intraperiod drawdowns exceeding 30% in some cycles.
- Add it up: stacking this specific window across the sample compounds to roughly 230% cumulative gains.
According to historical data from TradeWave.ai, Marriott’s behavior in late midterm years has followed a distinct pattern that most hotel investors never see discussed on earnings calls.
How has Marriott International (MAR) traded in this midterm-year window?
Marriott International has closed higher in every one of the last seven midterm election years during the 319-day window that starts on Aug 28, averaging an 18.69% gain with a long bias. Shares finished Monday at 346.83 after dropping 7% on the Q2 report, leaving the stock about 15.6% below its 52-week high of 410.98 and well off the spring peak. That mix of a clean historical uptrend in this specific calendar slice and a sharp, earnings-driven pullback gives traders a very different backdrop than the headline tape suggests.
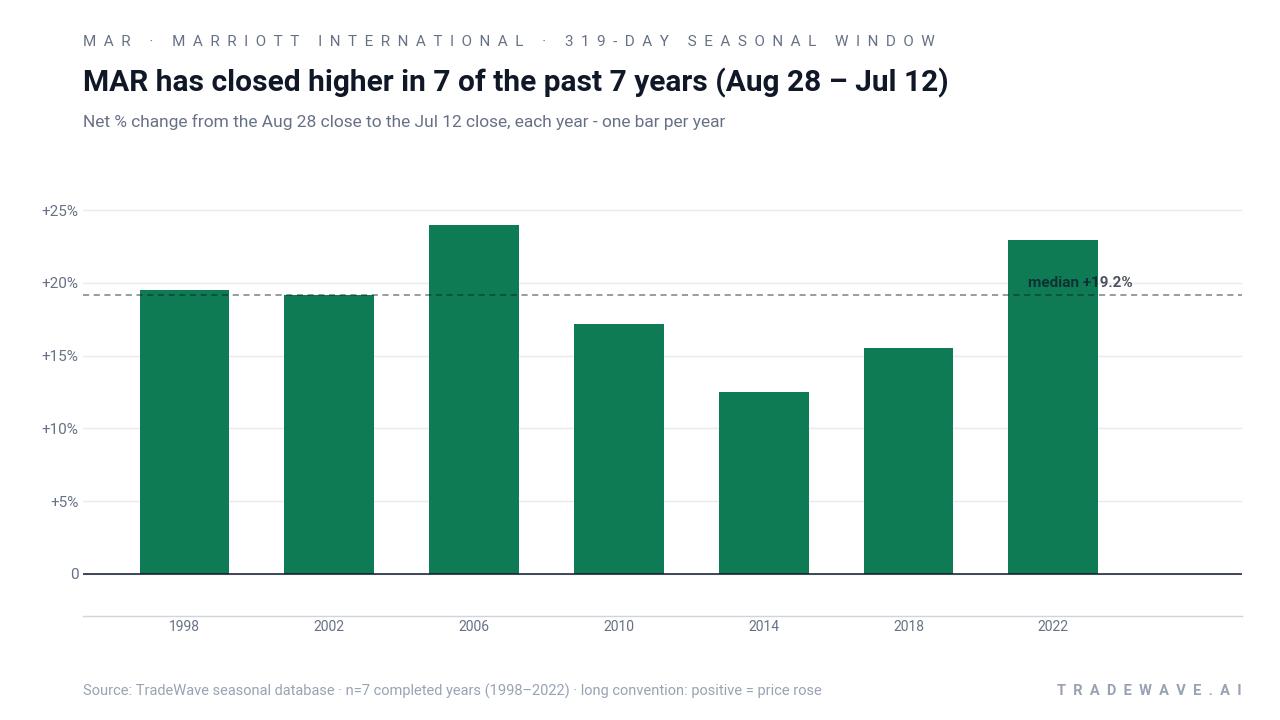
Grouping the data by the presidential election cycle matters here because this window straddles the late midterm year and the ramp into the year before the presidential election, a phase that has often coincided with easier financial conditions and stronger travel demand. In this sample of seven midterm election years, every Aug 28 to Jul 12 stretch produced a positive net return for a long position, with individual gains ranging from 12.49% in 2014 to 23.96% in 2006.
The average winner gain of 18.69% sits close to the 19.16% median, which tells you the pattern is not being driven by a single outlier year. The cumulative return chart for this Marriott International trading window compounds those slices into roughly 230% across the seven completed cycles, a steady stair-step higher rather than a jagged line dominated by one boom period. For a hotel stock that has already rallied hard over the last few years, that kind of consistency in a specific calendar regime stands out.
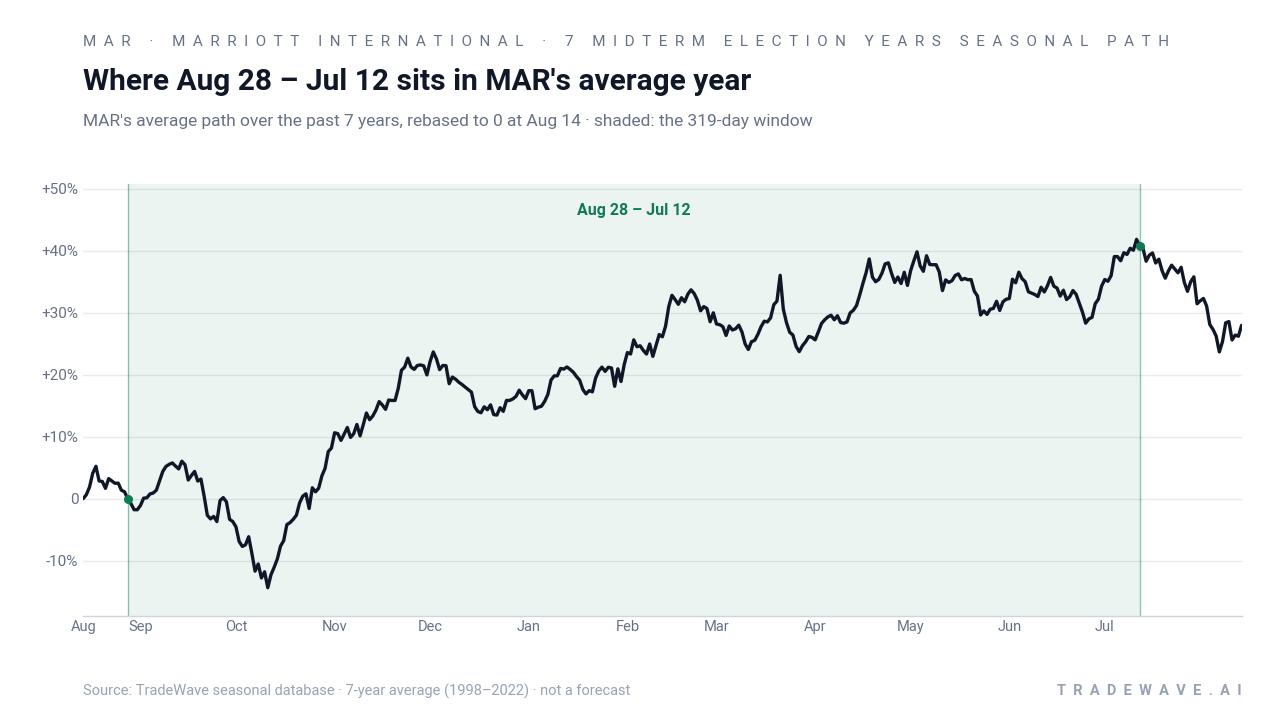
The historical seasonal average suggests the typical pattern is not a straight line. In several years, Marriott saw strong early gains within the first few months of the window, then periods of consolidation before another push higher into the following summer. That fits a narrative where investors re-rate the stock as visibility on the macro and policy backdrop improves heading into the year before the presidential election.
Year-by-year ranges show how much Marriott has swung inside the window before finishing higher.
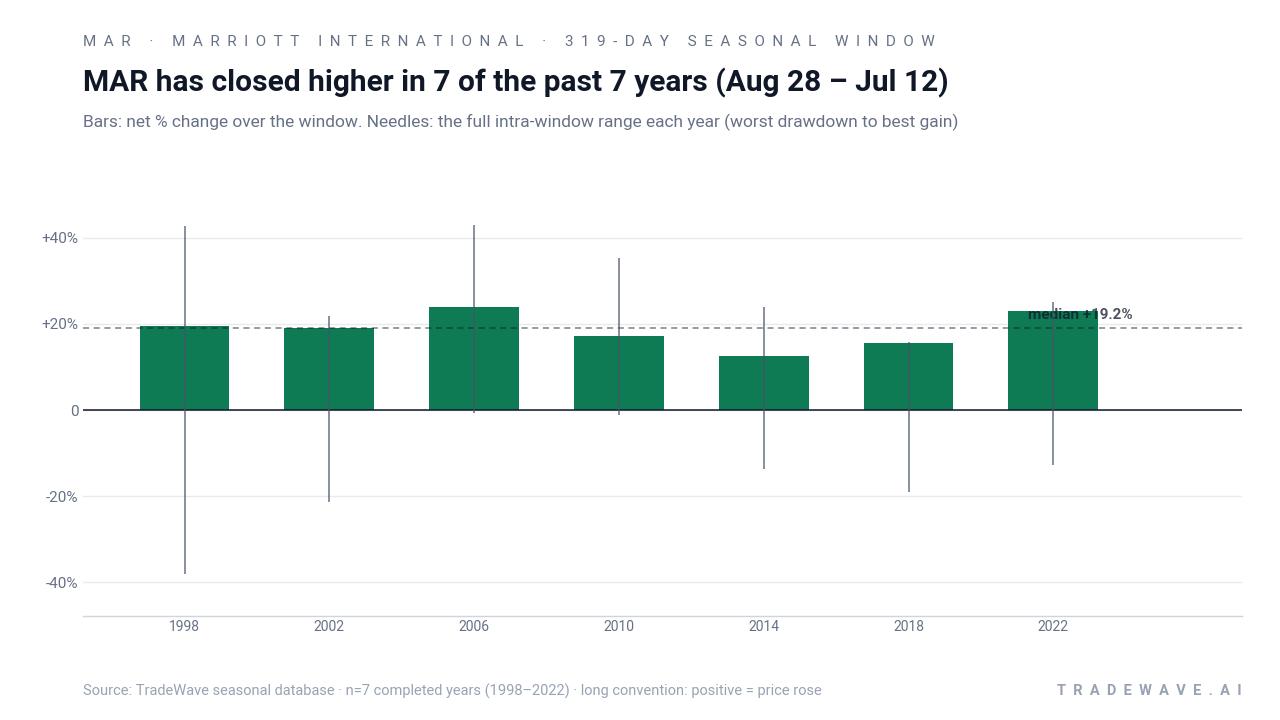
The intraperiod ranges are where the risk shows up. In 1998, for example, Marriott’s best run-up from the entry point reached 42.85%, but the worst drawdown inside the same window was a deep 38% slide before the stock recovered. Other years, such as 2006 and 2010, saw much shallower adverse moves of around 1% while still delivering double-digit gains by the end of the window. The TradeWave Ratio of 2.44 captures how far price has typically traveled in the trade direction within the window, while the Sharpe ratio of 3.76 reflects strong risk-adjusted returns based on end-of-window outcomes.
History does not guarantee future results; adverse excursions can be large even in winning windows, and a 100% hit rate over seven cycles does not eliminate the risk of a losing year.
Why does Marriott International (MAR) follow this seasonal pattern?
One likely driver is the way the travel and lodging cycle lines up with the policy calendar in midterm and pre-election years. Analysts often point to stronger corporate and group travel budgets as political uncertainty fades and companies lock in plans for the next administration, which can support room rates and occupancy. This pattern may also reflect institutional portfolio repositioning into cyclical and consumer-facing names as the year before the presidential election approaches, especially when rate expectations stabilize and visibility on growth improves.
What is driving Marriott International (MAR) today?
Marriott shares closed at 346.83 on Monday, down 26 points or 7% after the company reported Q2 revenue of $7.07 billion, missing analysts’ consensus and guiding Q3 profit below expectations even as it raised its full-year outlook on higher room prices.[2][3] Management said the conflict in and around Iran weighed on second-quarter sales and warned that construction delays in the Middle East are likely to push 2026 net room growth toward the low end of its prior 4.5% to 5% range, a reminder that geopolitics can still disrupt an otherwise solid hotel demand backdrop.[1][2]
The chart below puts that post-earnings drop in context against the past year of trading and the median seasonal path.
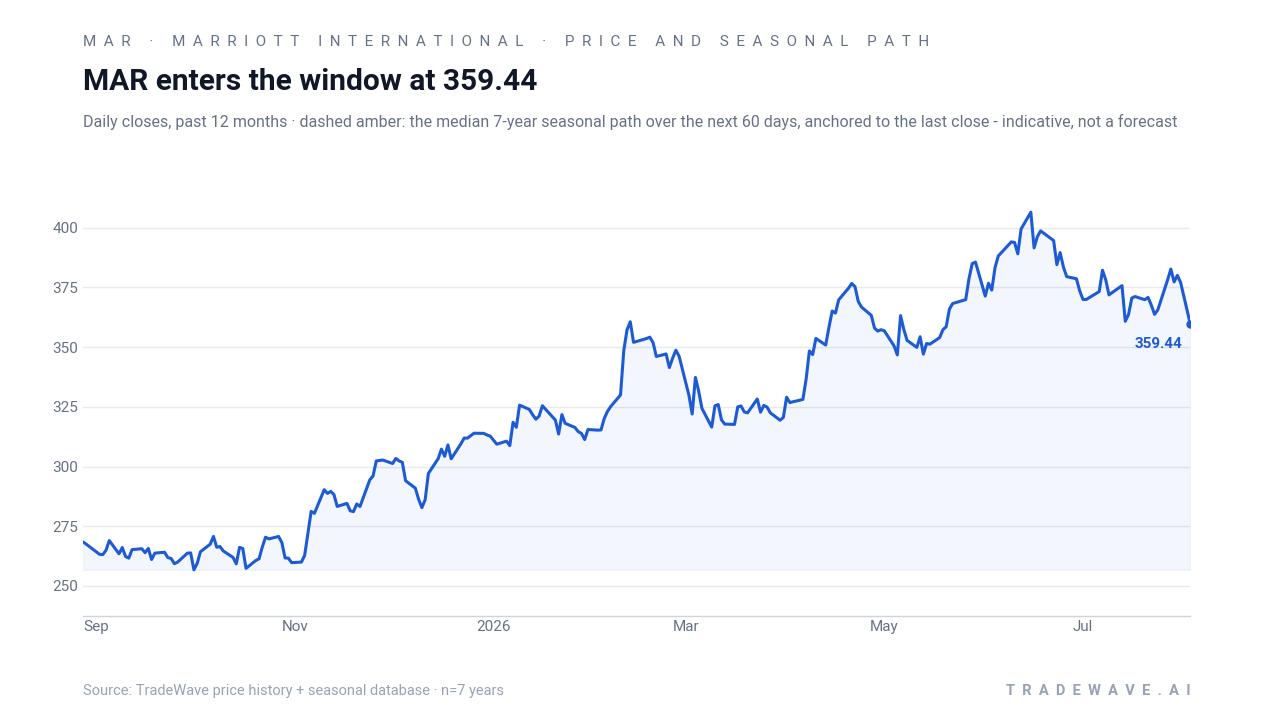
The earnings narrative is nuanced. Revenue rose about 5% year over year, and Marriott boosted its full-year outlook on the back of higher room prices, suggesting underlying demand remains resilient even as certain regions lag.[1][2] At the same time, commentary around weaker performance in parts of Greater China and pressure from the Middle East conflict shows that the global hotel recovery is uneven, which helps explain why investors punished the stock despite the guidance raise.[1][10]
Sector context also matters. The hotel and lodging group has benefited from a multi-year rebound in travel, with luxury properties and high-end leisure demand outpacing select-service and some international markets.[10] For a stock that had been trading near highs earlier this year, the combination of a revenue miss, cautious Q3 profit outlook, and geopolitical drag was enough to trigger a sharp reset in expectations, even if the longer-term RevPAR and room growth story remains intact.[2][3]
What should traders watch as this seasonal window approaches?
First, the calendar. The Aug 28 start date is only a few weeks away, and history says this 319-day stretch in midterm election years has been one of Marriott’s most consistently positive seasonal regimes. Traders will be watching whether the stock can stabilize above the post-earnings low and start to rebuild a base as that window opens, or whether continued selling pressure breaks the pattern of prior cycles.
Second, the macro and policy backdrop. Any easing of Middle East tensions that lifts travel demand and clears construction bottlenecks would directly address the headwinds management flagged on the Q2 call, while a more volatile geopolitical tape could keep a lid on room growth in key markets.[1][2] On the policy side, the transition from the midterm election year into the year before the presidential election has often coincided with friendlier conditions for cyclical consumer names, so investors will be tracking how rate expectations, corporate travel budgets, and global growth forecasts evolve into 2027.
Third, the tape itself. Inside prior winning windows, Marriott has sometimes endured double-digit drawdowns before finishing the period higher, so a choppy path would not be unusual. What would contradict the historical pattern is a sustained breakdown that fails to recover into the following summer, especially if it comes alongside weakening RevPAR trends or a material cut to the company’s room growth outlook.
Finally, volume and positioning. Monday’s more than 6% slide came with heavy trading as investors reacted to the Q2 miss and cautious Q3 profit guide, a sign that some fast money has already moved.[3] From here, traders will be watching whether that post-earnings volume spike marks a capitulation low that lines up with the approaching seasonal window, or the start of a longer de-rating that would challenge a seven-for-seven historical streak.
Sources
- The Wall Street Journal – “Marriott Says Middle East Conflict Weighed on Sales” (Aug 3, 2026)
- Bloomberg – “Marriott (MAR) Beats Estimates, Boosts Outlook on Higher Room Prices” (Aug 3, 2026)
- Yahoo Finance – “Wall Street rallies to kick off August on Iran talks optimism” (Aug 3, 2026)
- MarketBeat – “MAR Stock Near Highs: Q4 EPS Miss, 2026 Outlook, and HLT Valuation Comparison” (Apr 28, 2026)
About this seasonal analysis
Seasonal pattern data is sourced from TradeWave.ai, which analyzes historical price behavior across annual calendar windows going back up to 30 years. Read the full data methodology or the book The 100-Year Pattern by Afshin Moshrefi (2026 edition). Past performance of seasonal patterns does not guarantee future results. This article is for informational purposes only and does not constitute investment advice.