A. O. Smith (AOS) Q2 Earnings Land as Stock Enters Historically Weak Late-Summer Stretch
A. O. Smith is already down year to date and just posted fresh earnings as it trades inside a midterm-year Jul 28–Oct 19 window that has historically leaned lower for the stock.
Price as of Jul 29, 2026: $62.04 (last close).

What is the seasonal pattern for A. O. Smith (AOS)?
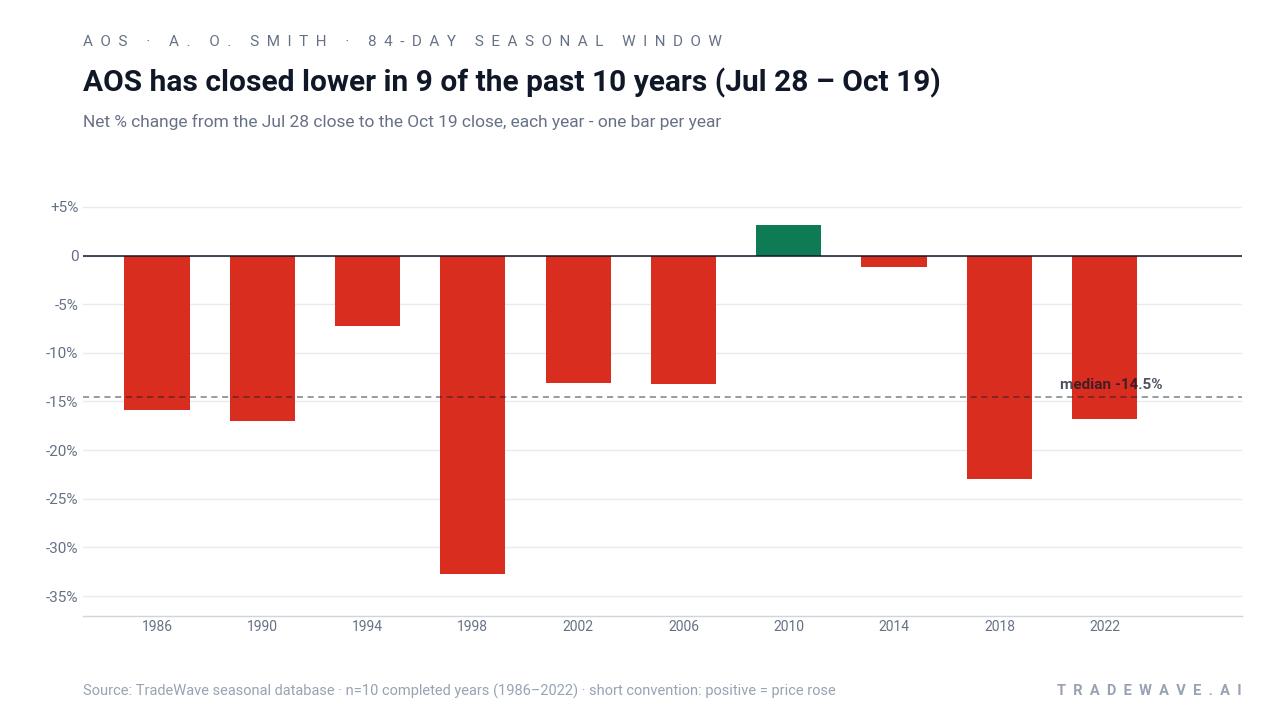
A. O. Smith has fallen in 9 of 10 midterm-year Jul 28–Oct 19 windows, with an average 15.55% gain in winning years for the short side.
- 9 for 10 in this window, with the short side averaging 15.55% profit in winning years and a 14% average outcome across all years.
- The current pattern window runs from Jul 28 to Oct 19 and is based on the last 10 midterm election years.
- Percent Profitable is 90%, with 9 winners and 1 loser for the short trade setup in this AOS seasonal trend.
- Average loss in the lone losing year is 3.1%, showing that the outlier against the pattern has been relatively contained.
- The TradeWave Ratio (TWR) of 1.98 signals that price has typically traveled meaningfully in the trade direction within this A. O. Smith trading window.
- A Sharpe ratio of 1.24 for this window points to a historically favorable risk-adjusted profile for the short pattern, albeit with notable drawdowns in some years.
According to historical data from TradeWave.ai, this late-summer stretch for A. O. Smith behaves very differently from an average quarter in midterm election years. The next section steps through what that election-cycle seasonality has looked like and how it frames the current move.
How has A. O. Smith (AOS) traded in the Jul 28–Oct 19 midterm-year window?
A. O. Smith has closed lower in 9 of the last 10 midterm election years during the Jul 28–Oct 19 window, with the short side averaging a 15.55% profit when the pattern works. Shares entered this year’s window at 63.09 and finished the prior session at 62.04, leaving the stock down 4.29% year to date and about 24.2% below its 52-week high of 81.87.[8]
Because this pattern is grouped by the presidential election cycle, it only looks at midterm election years, not every calendar year in between. That matters for an industrial name like A. O. Smith, where demand for water heaters and boilers can be sensitive to fiscal spending, housing activity and infrastructure programs that often ebb and flow with the policy backdrop in the midterm year.
The trade direction for this setup is short, so years in which AOS drifts or sells off are favorable for the pattern, while sharp rallies are the losing outcomes. Across the 10 midterm-year samples, the short has been profitable 90% of the time, with 9 winners and just 1 loser. Average profit in the winning years is 15.55%, while including the lone losing year pulls the all-years average to 14%, which is still a sizable move for an 84-day window.
The weakest year for the short was 2010, when AOS finished the window up 3.1%, turning that iteration into a loss for bears even though the stock still saw a maximum adverse move of 10.29% against the short before stabilizing. The strongest year for the pattern was 1998, when the stock fell 32.71% from late July into mid-October, with the worst intraperiod drawdown for shorts reaching 41.9% in their favor before the window closed.
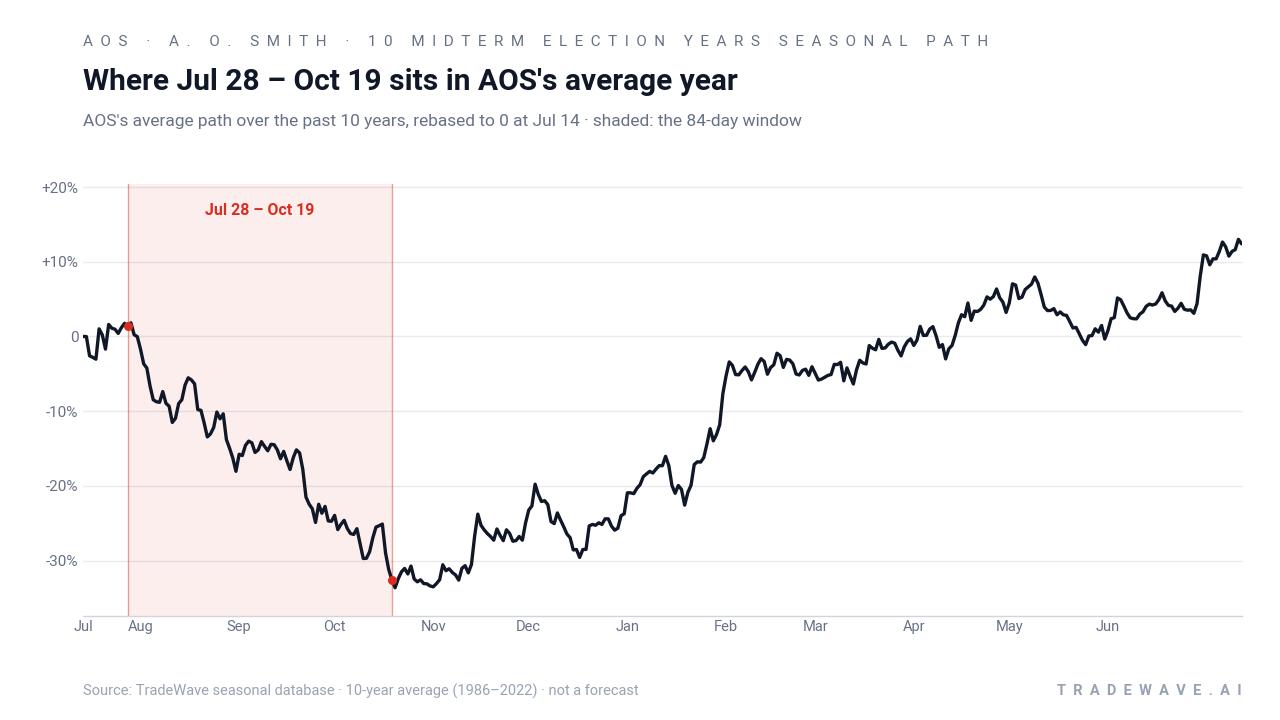
The historical seasonal average chart shows AOS tending to roll over shortly after the window opens, with weakness clustering in the middle third of the period before flattening out into October. That profile fits a pattern where the bulk of the move for shorts has often come from a sustained drift lower rather than a single crash day.
The next view combines yearly net results with the full intraperiod range to show how far AOS has swung inside this window.
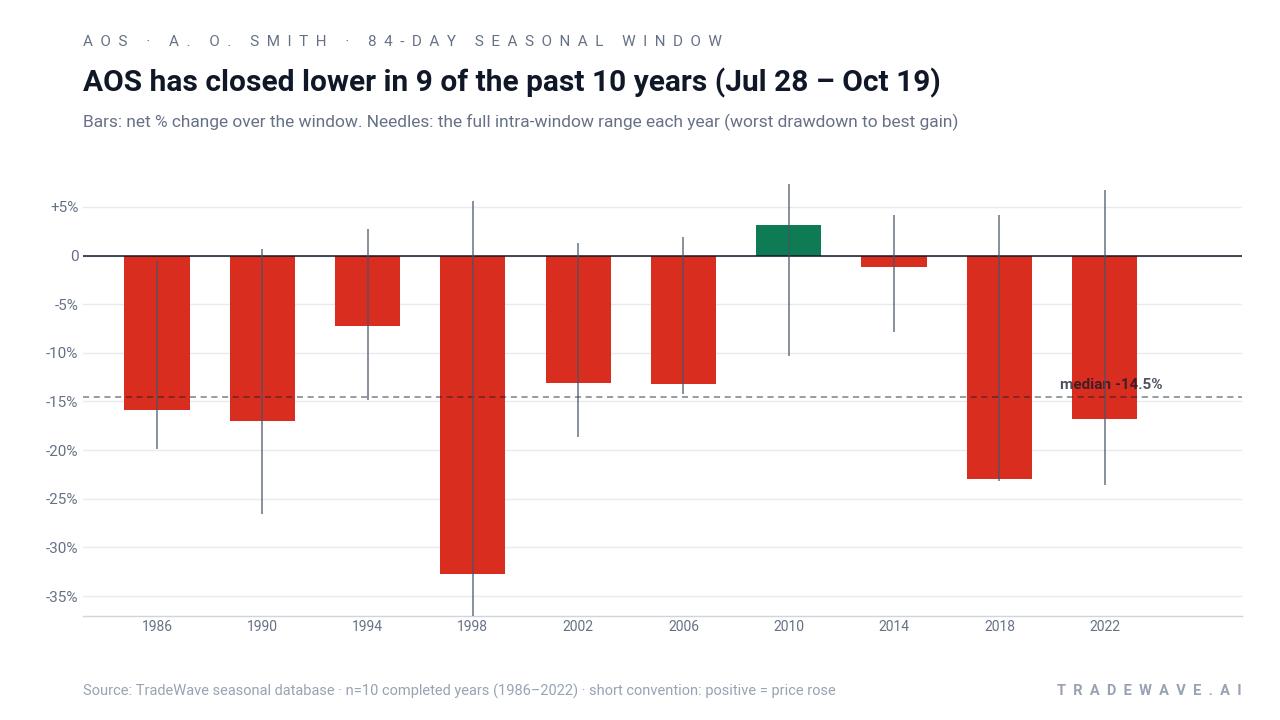
The combined net / maximum favorable move / maximum adverse move view makes clear that this has been a high-variance window. In several years, shorts ultimately finished with double-digit gains even though the stock staged mid-window rallies of 4% to 9% against them, while the worst drawdowns in their favor reached into the high teens or low 20s. That mix of large favorable and adverse excursions is what drives a TradeWave Ratio of 1.98 and a Sharpe ratio of 1.24 for the pattern, suggesting meaningful opportunity for the short side but with real whipsaw risk along the way.
History does not guarantee future results; adverse excursions (MAE) can be large even in winning windows.
Why does A. O. Smith (AOS) follow this seasonal pattern?
One likely driver is the way midterm election years concentrate policy uncertainty and infrastructure debate into late summer and early fall, a period when industrial and building-products stocks often trade as proxies for capex and housing sentiment. Analysts have also pointed to the timing of A. O. Smith’s earnings calendar, with Q2 and Q3 updates landing inside this window and sometimes resetting expectations for residential and commercial demand.[4][6] The pattern may also reflect institutional portfolio repositioning ahead of the pre-election year, when investors decide which cyclical names they want to carry into what has historically been a stronger phase for equities.
What is driving A. O. Smith (AOS) today?
A. O. Smith fell 3.08% in the prior session to 62.04, slipping further below its recent close of 64.01 and leaving the stock down 4.29% year to date and about 12.7% above its 52-week low of 54.16.[8] The move came as investors positioned around the company’s Q2 2026 earnings report on Jul 30, which follows a Q1/Q2 stretch where AOS missed consensus on both EPS and revenue but still posted a robust 28.42% return on equity and 13.84% net margin.[4][6]
Brokerage research compiled earlier in July shows an average recommendation of “Reduce” on the stock, with a consensus price target of 69.44 from MarketBeat’s aggregation, modestly above current levels but framed by cautious commentary on growth and valuation.[3][4] At the same time, several institutional investors, including Dimensional Fund Advisors, Bank of New York Mellon and Illinois Municipal Retirement Fund, have disclosed fresh purchases of AOS shares in July, suggesting that some long-only managers are willing to lean into the weakness.[1][2][3]
The chart below puts the latest pullback in context against the past year of trading and the median 60-day seasonal path.
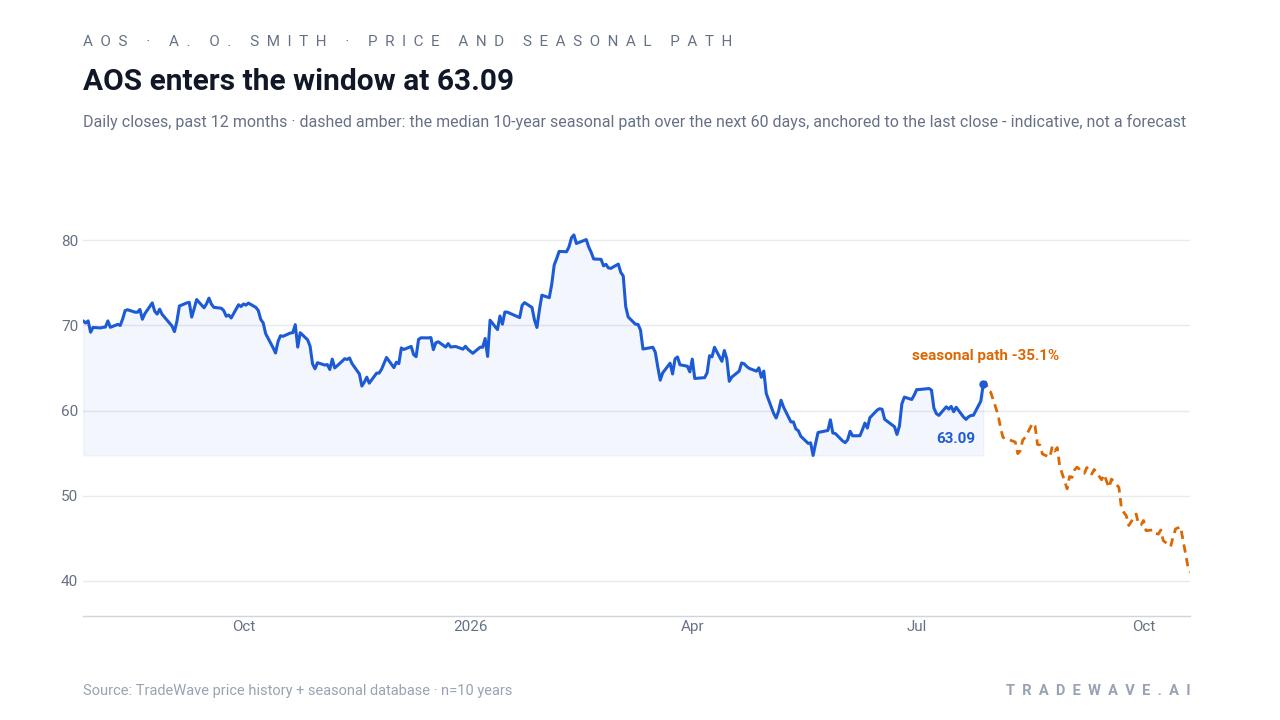
From a sector standpoint, A. O. Smith sits at the intersection of housing, commercial construction and industrial demand, all of which can be sensitive to interest rates and fiscal policy. In midterm election years, those macro levers often become part of the political conversation, which can amplify volatility in names tied to building and infrastructure spending. With the stock already well off its 52-week high and sentiment mixed, the historical seasonality adds another layer to how traders may frame risk into the fall.
What should traders watch in this AOS seasonal window?
First, watch how AOS trades around the 60–65 band that has defined much of its recent range; sustained weakness through the low 60s during this window would be consistent with the historical midterm-year pattern, while a decisive break back toward the high 60s would look more like the rare 2010-style outlier. Second, monitor post-earnings reaction and guidance updates, since any change to the 3.60–3.90 EPS outlook or demand commentary could either reinforce or blunt the usual late-summer softness.[4][6]
Third, keep an eye on institutional flows and analyst rhetoric: continued buying from large funds or a shift away from the current “Reduce” consensus would signal that fundamental investors are willing to fade the seasonal weakness.[1][2][3][4] Finally, track how closely the stock’s day-to-day path hugs or diverges from the historical seasonal trend; if AOS sells off early and then stabilizes into October, it would echo the typical pattern, while a grind higher through the window would mark a meaningful break from what the last 10 midterm election years have delivered.
Sources
- MarketBeat: A. O. Smith Corporation $AOS Shares Purchased by Dimensional Fund Advisors LP (Jul 28, 2026)
- MarketBeat: Illinois Municipal Retirement Fund Buys 32,848 Shares of A. O. Smith Corporation $AOS (Jul 18, 2026)
- MarketBeat: Bank of New York Mellon Corp Acquires 42,702 Shares of A. O. Smith Corporation $AOS (Jul 21, 2026)
- MarketBeat: A. O. Smith Corporation (NYSE:AOS) Given Average Recommendation of "Reduce" by Brokerages (Jul 13, 2026)
- MarketBeat: A. O. Smith Corporation (NYSE:AOS) Announces $0.36 Quarterly Dividend (Jul 14, 2026)
- MarketBeat: AOS Q2 2026 Earnings Report on 7/30/2026 (Jul 29, 2026)
- Zacks: What is the current Price Target and Forecast for A. O. Smith (AOS) (Jul 16, 2026)
- MarketWatch: AOS Stock Price | A.O. Smith Corp. Stock Quote (U.S.: NYSE) (Jul 29, 2026)
About this seasonal analysis
Seasonal pattern data is sourced from TradeWave.ai, which analyzes historical price behavior across annual calendar windows going back up to 30 years. Read the full data methodology or the book The 100-Year Pattern by Afshin Moshrefi (2026 edition). Past performance of seasonal patterns does not guarantee future results. This article is for informational purposes only and does not constitute investment advice.