Copart (CPRT) Faces 6-of-7 Midterm Late-Summer Loss Record as Aug 18 Window Nears
Copart is heading toward a historically weak late‑summer stretch even as shares sit well below their 52‑week high and investors digest mixed earnings and sector pressure.
Price as of Aug 3, 2026: $29.35 (last close).

What is the seasonal pattern for Copart (CPRT)?
Copart has fallen in 6 of 7 midterm‑year late‑summer windows from Aug 18 to Oct 3, with an average 11.61% gain in winning years for the short setup.
- 6 for 7 in this window: Copart has moved in favor of the short trade in 86% of midterm‑year samples, with only 1 losing year.
- The upcoming window runs from Aug 18 to Oct 3 and is grouped across the last 7 midterm election years, not consecutive calendar years.
- Percent Profitable is 86%, with 6 winners and 1 loser for the short direction across the sample.
- Average profit in winning years is 11.61%, while Avg Profit - All, which includes the lone losing year, is still a solid 10%.
- The pattern’s TradeWave Ratio is 1.51 and the Sharpe ratio is 1.33, pointing to a historically strong risk‑adjusted edge for shorts in this slice of the calendar.
- Intraperiod swings have been meaningful, with both favorable runs and adverse drawdowns showing that this Copart trading window can be volatile even when it ultimately favors the short side.
According to historical data from TradeWave.ai, Copart’s late‑summer behavior in midterm election years has not looked like an average month on the calendar. The next section walks through how that pattern has played out and where the upcoming Aug 18 to Oct 3 window fits into the broader election cycle.
How has Copart (CPRT) traded in the late‑summer midterm-year window?
Copart has closed lower in 6 of the last 7 midterm‑year windows from Aug 18 to Oct 3, a stretch that has historically rewarded short exposure with an average 11.61% gain in winning years. Shares finished Monday at 29.35, up 0.8% on the day and about 41.4% below their 52‑week high of 50.11, leaving plenty of room on the chart if this pattern repeats.
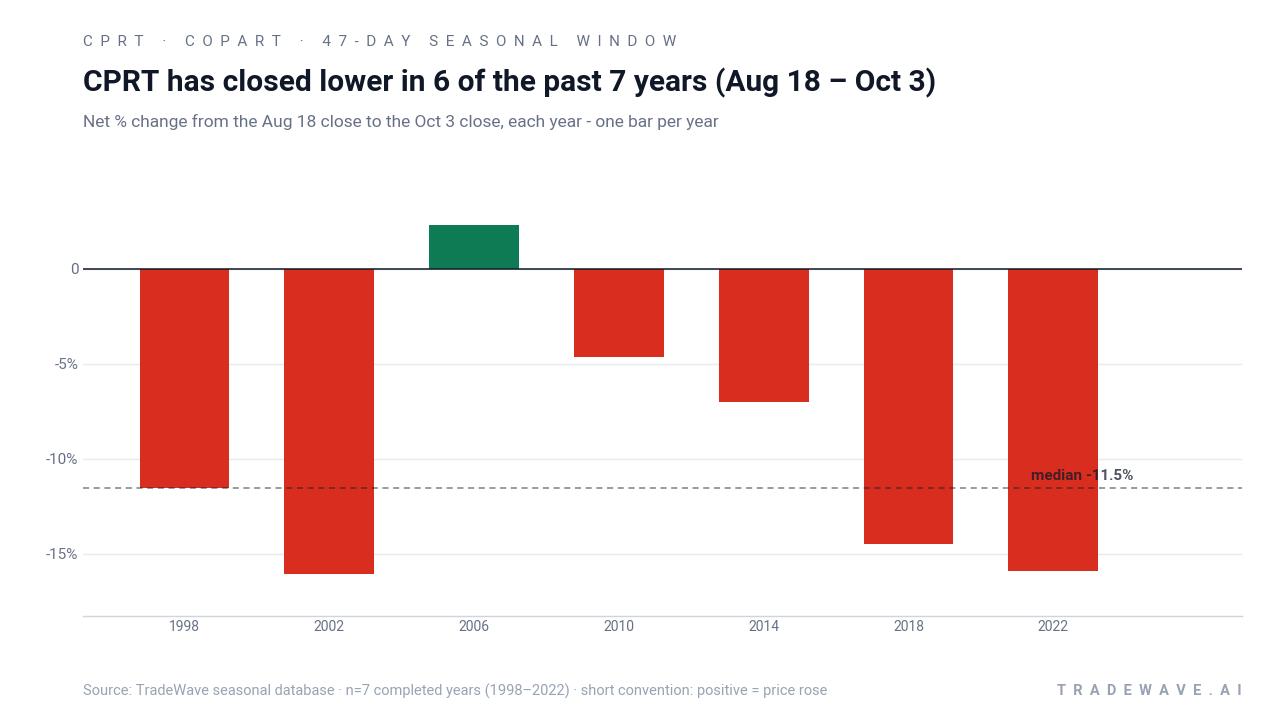
Because this pattern is grouped by the presidential election cycle, it only looks at years that match today’s backdrop: the midterm election year, just before the market transitions into the historically more supportive pre‑election year. For Copart, that specific slice of the calendar has tended to be a soft spot, even when the broader industrial sector or the S&P 500 has been firm.
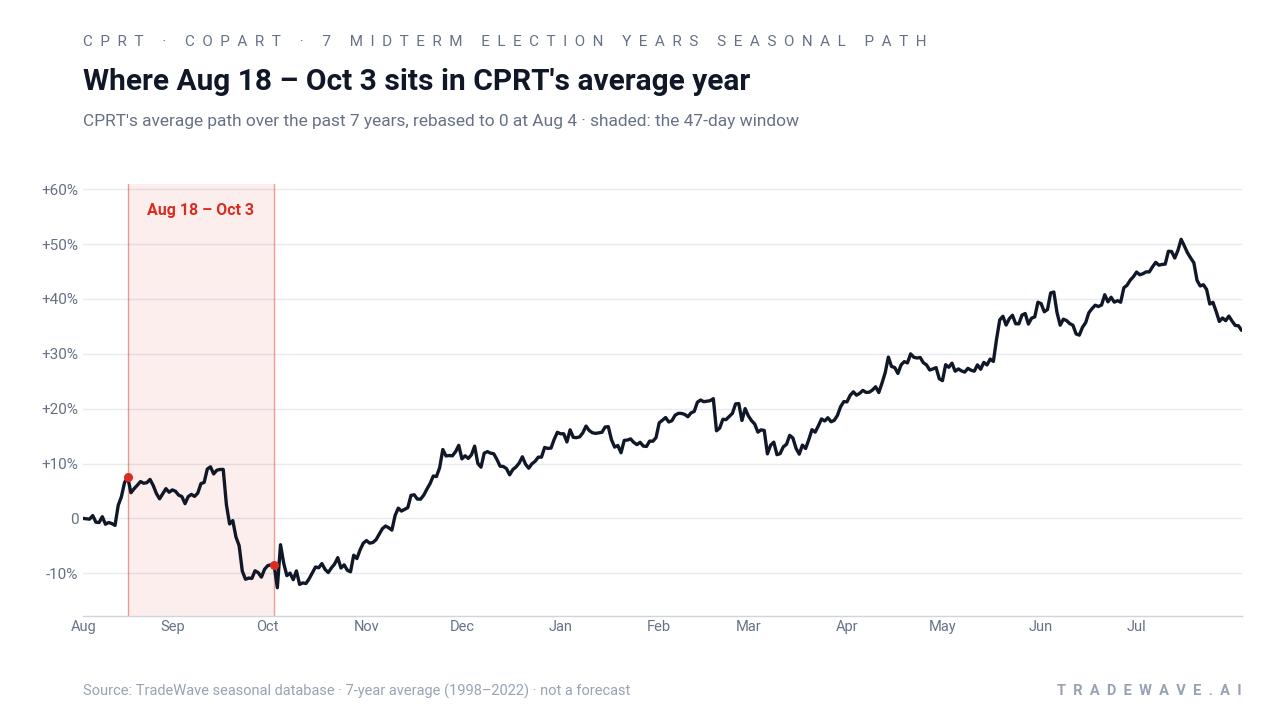
A closer look at yearly ranges shows how far Copart has tended to move in both directions inside this window.
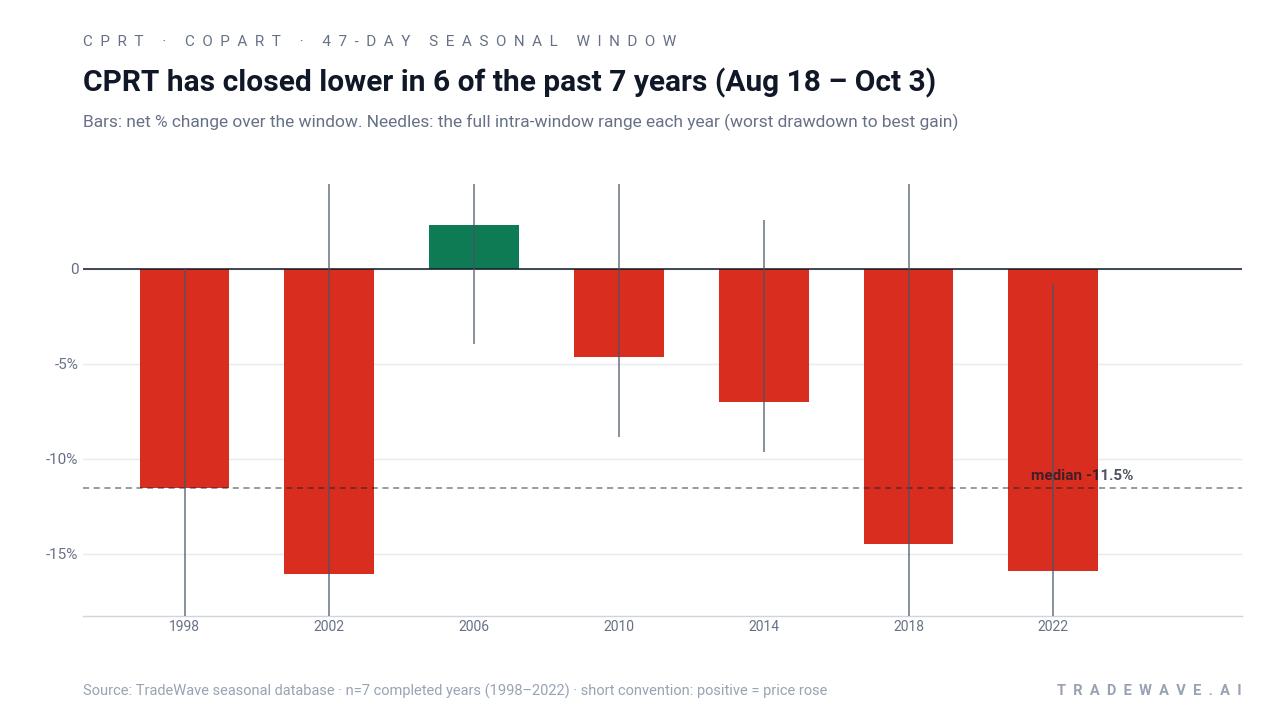
The per‑year table shows that the strongest short years, such as 2002, 2018 and 2022, delivered double‑digit declines over the 47‑day span, while the lone losing year for shorts, 2006, saw Copart grind slightly higher into early October. Maximum favorable moves for the short side have often built gradually, with the stock drifting lower over several weeks rather than collapsing in a single air pocket. At the same time, maximum adverse moves have not been trivial, with several years showing mid‑window rallies that would have tested short conviction before the pattern ultimately reasserted itself.
Stacking the window across all seven midterm‑year samples compounds to an 88% cumulative gain for the short strategy, which is unusually strong for a sub‑two‑month slice of the calendar. That cumulative line is not a forecast, but it does underline how consistently this late‑summer period has leaned against Copart’s longer‑term uptrend. The key takeaway: in midterm election years, this Aug 18 to Oct 3 Copart trading window has historically been a problem spot for longs and a tailwind for shorts.
History does not guarantee future results; adverse excursions (MAE) can be large even in winning windows.
Why does Copart (CPRT) follow this seasonal pattern?
One likely driver is the way Copart’s fiscal calendar and earnings cadence line up with the broader midterm‑year policy backdrop, which can leave late summer as a digestion phase after earlier guidance and volume updates. Analysts have also pointed to institutional portfolio repositioning in industrial and automotive salvage names around this time, as managers rebalance exposure ahead of the stronger pre‑election year, which may add selling pressure in a stock that has historically compounded strongly over the long run.[2]
What is driving Copart (CPRT) today?
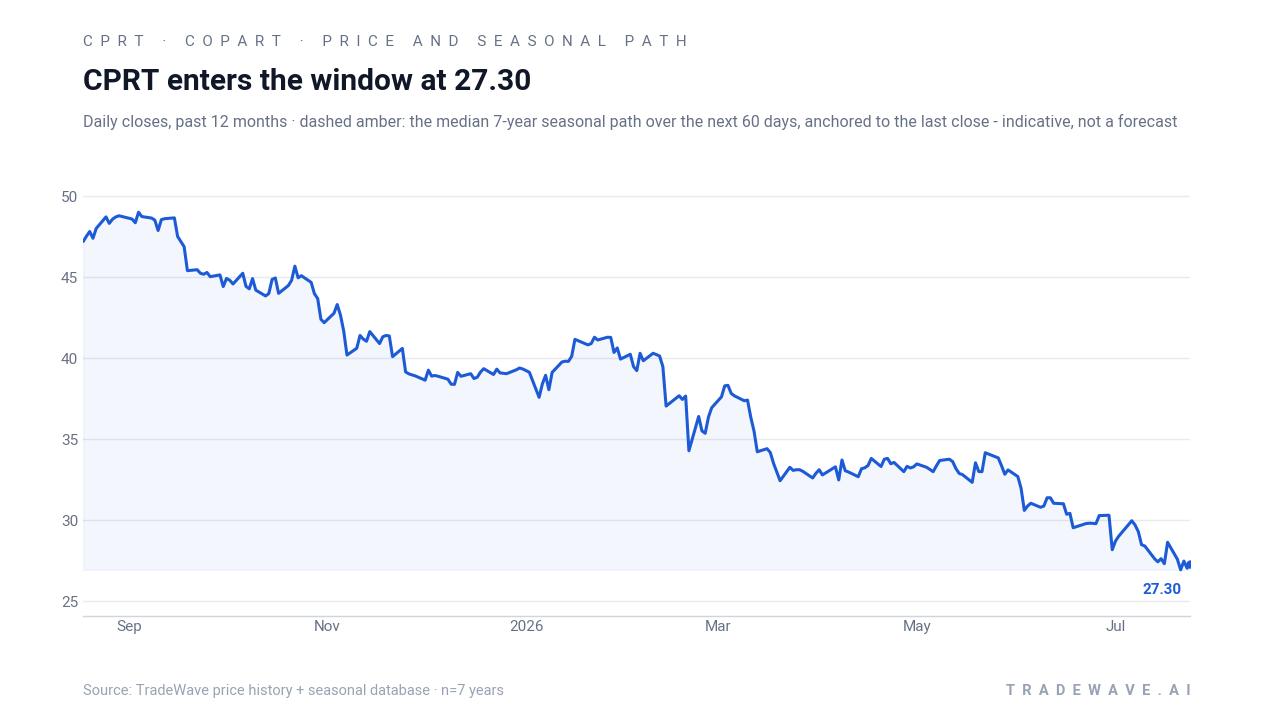
Copart closed Monday at 29.35, up 0.23 points or 0.8% on the session, and has gained a modest 0.38% over the past month while trading below its 50‑day moving average of about 29.89. That leaves the stock roughly 9.5% above its 52‑week low of 26.81 and about 41.4% under its 52‑week high of 50.11, a wide band that reflects both the long‑term growth story and the recent reset in industrials.
The near‑term narrative is still anchored in a mixed earnings run. On Feb 20, 2026, Copart’s fiscal Q2 results showed revenue down about 3.6% year over year and adjusted EPS of $0.36, both below expectations, and the stock sold off in response.[1][5] By May 21, the tone had improved: Q3 revenue grew roughly 2.1% to $1.24 billion and EPS ticked up 2.4% to $0.43, beating estimates and sparking a roughly 4.1% pop in the shares.[2][4][6] That rebound helped stabilize sentiment but did not erase the longer slide from last year’s highs.
Sector context has also mattered. In June 2026, Barchart highlighted that Copart had underperformed the broader industrials sector and key peers over both the prior 52 weeks and year to date, even as the company continued to benefit from structural tailwinds in the automotive salvage and used‑vehicle auction market.[2] Rising total‑loss frequency tied to electric‑vehicle complexity and advanced driver‑assistance systems has been expanding Copart’s addressable market, but investors have been weighing that against sluggish U.S. volumes and a more selective risk appetite for growth‑at‑a‑reasonable‑price compounders.[3][4]
The chart below situates the latest move in its recent multi‑month context alongside the historical seasonal projection.
What should traders watch as Copart (CPRT) approaches this window?
First, the calendar: the 47‑day window opens on Aug 18 and runs through Oct 3, squarely in the back half of the midterm election year and brushing up against the historically stronger pre‑election phase. If Copart starts to roll over into that stretch, in line with the past 6 of 7 midterm‑year samples, it would confirm that the historical seasonality is still exerting a pull. A firm grind higher instead would look more like the 2006 outlier and would mark a clear break from the usual Copart seasonal trend.
Second, price levels. On the downside, traders will be watching how the stock behaves if it revisits the 27 to 28 area that marked the recent 52‑week low zone. A decisive break with expanding volume would fit the historical pattern of meaningful late‑summer weakness. On the upside, reclaiming and holding above the 50‑day moving average near 29.89, then pushing toward the low‑30s, would signal that buyers are willing to lean into the name even as the seasonal headwind kicks in.
Third, catalysts and macro tone. While there is no specific earnings date in the immediate path, any updates on U.S. salvage volumes, insurance‑loss trends or capital‑return plans could shift the narrative quickly.[3][4] The broader industrial and auto complex will also matter: if sector risk appetite improves into the pre‑election year, Copart could see more support than it has in prior midterm cycles, even inside a historically weak window.
Finally, behavior inside the window itself will be the real tell. If the stock shows the familiar pattern of early‑window resilience followed by a steady drift lower into late September, that would echo several of the stronger short years in the sample. A choppy, sideways tape with shallow pullbacks would suggest that the 88% cumulative short‑side gain across past cycles is becoming less relevant. Either way, this is one of those calendar stretches where Copart traders will want to keep one eye on the tape and the other on the clock.
Sources
- Barchart – Do Wall Street Analysts Like Copart Stock? (May 5, 2026)
- Barchart – How Is Copart’s Stock Performance Compared to Other Industrial Stocks? (Jun 5, 2026)
- Seeking Alpha – Copart: A Wide-Moat Compounder Trading At Discount (May 7, 2026)
- Morningstar – Copart Earnings: Sluggish US Volumes Continue While Share Repurchases Accelerate (May 22, 2026)
- The Motley Fool – Why Copart Stock Dropped Today (Feb 20, 2026)
- The Motley Fool – Copart (CPRT) Q3 2026 Earnings Transcript (May 25, 2026)
About this seasonal analysis
Seasonal pattern data is sourced from TradeWave.ai, which analyzes historical price behavior across annual calendar windows going back up to 30 years. Read the full data methodology or the book The 100-Year Pattern by Afshin Moshrefi (2026 edition). Past performance of seasonal patterns does not guarantee future results. This article is for informational purposes only and does not constitute investment advice.