Procter & Gamble (PG) Has Risen in 10 of 10 Midterm Fall Windows, Averaging 8.99% Gains
Procter & Gamble is heading into a historically strong August-to-December trading window just as investors digest softer guidance, higher costs and a stock trading well below its 52-week high.
Price as of Jul 30, 2026: $143.96 (last close).

What is the seasonal pattern for Procter & Gamble (PG)?
Procter & Gamble has risen in 10 of 10 midterm-year Aug 3–Dec 15 windows, with an average gain of 8.99% in winning years.
- 10 for 10 in this window, with Procter & Gamble gaining an average 8.99% across winning years.
- Seasonal window runs from Aug 3 through Dec 15 in the last 10 midterm election years, a 135-day stretch.
- Percent Profitable is 100%, with 10 winners and 0 losers in the historical sample.
- Trade Direction is long, supported by a TradeWave Ratio of 1.74 and a Sharpe ratio of 1.4 across the window.
- Individual years have seen sizable intraperiod swings, with worst drawdowns reaching roughly mid-teens even in ultimately positive windows.
- Cumulatively, stacking this specific Procter & Gamble trading window across the 10 cycles adds up to about 133% total return.
According to historical data from TradeWave.ai, this midterm-year late-summer window has behaved very differently from an average stretch on the Procter & Gamble calendar. The next section walks through how that pattern has played out and where it sits in the current election cycle.
How has Procter & Gamble (PG) traded in past midterm-year fall windows?
Procter & Gamble has closed higher in every single Aug 3 to Dec 15 window across the last 10 midterm election years, averaging gains of 8.99% with no losing cycles. Shares finished Friday at $143.96, down 1.5% on the day and about 12.7% below the 52-week high of $164.76, leaving the consumer-staples giant closer to the lower end of its recent range than the top.
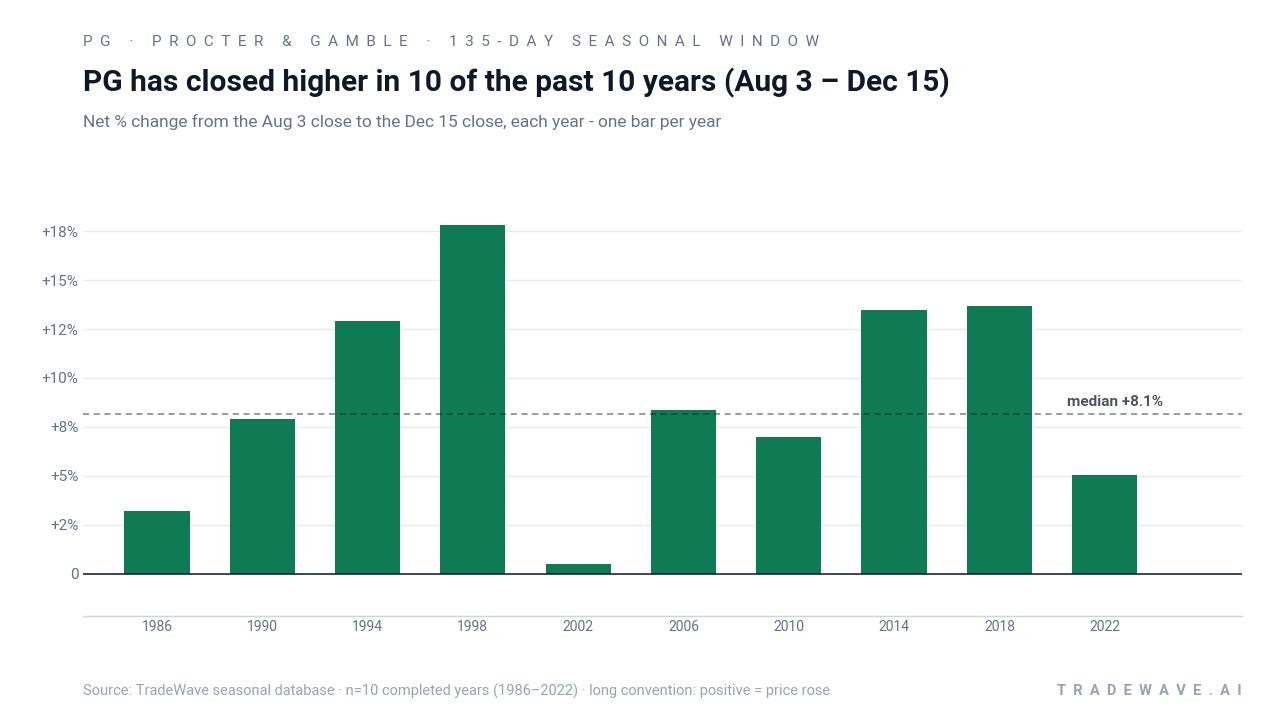
Grouping the data by the presidential election cycle matters here because consumer-staples flows often respond to policy and rate expectations that shift around midterm years. In this phase of the cycle, investors have historically rotated toward defensive names like Procter & Gamble as Washington noise picks up, then leaned back into risk as the calendar moves toward the pre-election year.
This seasonal window begins on Aug 3 and spans 135 days into mid-December. Historically, during this period in midterm election years, Procter & Gamble has shown a strong upside bias for long positions, with 10 winners and 0 losers and an annualized return of 8.87%. Average gains of 8.99% mask a wide range of outcomes, from a modest 0.51% advance in 2002 to a 17.79% surge in 1998.
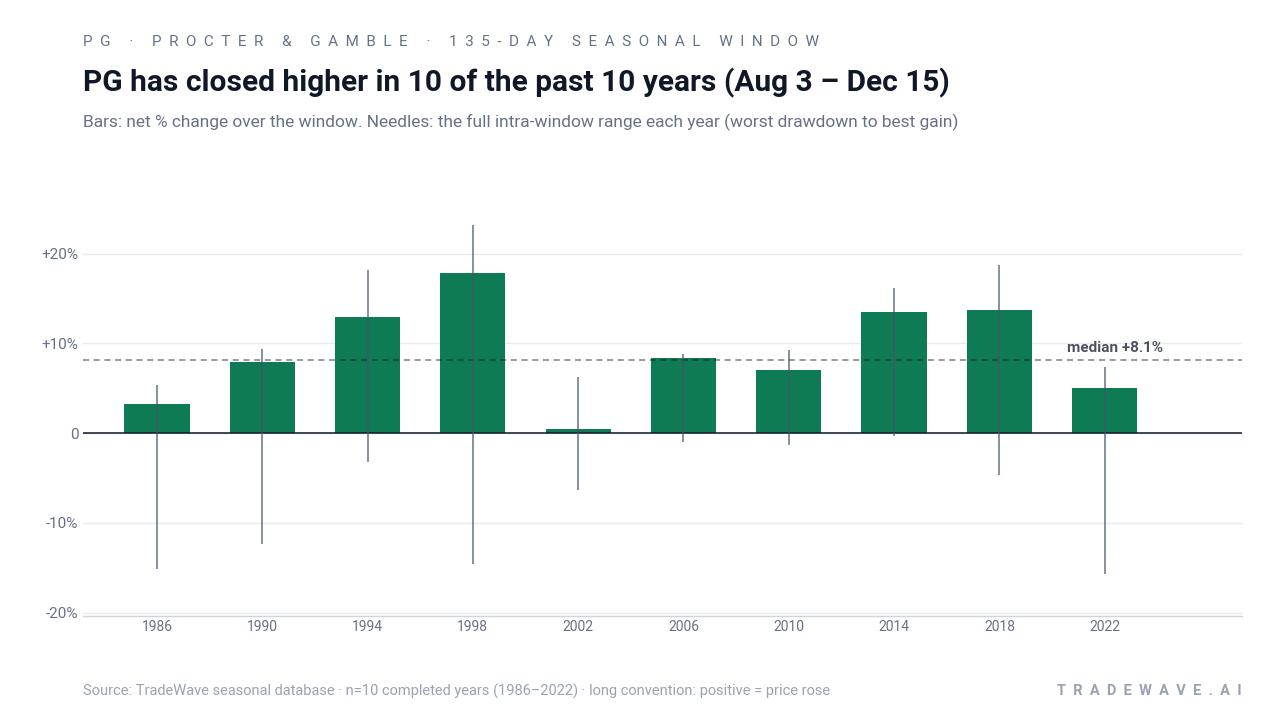
The per-year record shows how that upside has come with real swings along the way. In 1998, the stock’s best intraperiod move reached 23.13% above the Aug 3 entry level before settling at a 17.79% net gain by Dec 15. In 1986 and 2022, the pattern still finished positive, but the worst drawdowns within the window stretched to roughly 15% below entry, underscoring that even “all green” seasonal windows can feel uncomfortable in real time.
The maximum favorable move and maximum adverse move profile points to a high-conviction but not low-volatility setup. In stronger years like 1994 and 2014, Procter & Gamble’s best run-ups of 16% to 18% came with relatively shallow worst drawdowns of less than 4%, suggesting a smoother ride for longs. In choppier years such as 1990 and 1998, the stock still ended higher but spent part of the window down more than 12% before recovering, a reminder that timing inside the window has mattered.
A second view stacks each year’s net result with its full intraperiod range, highlighting how upside and downside have coexisted.
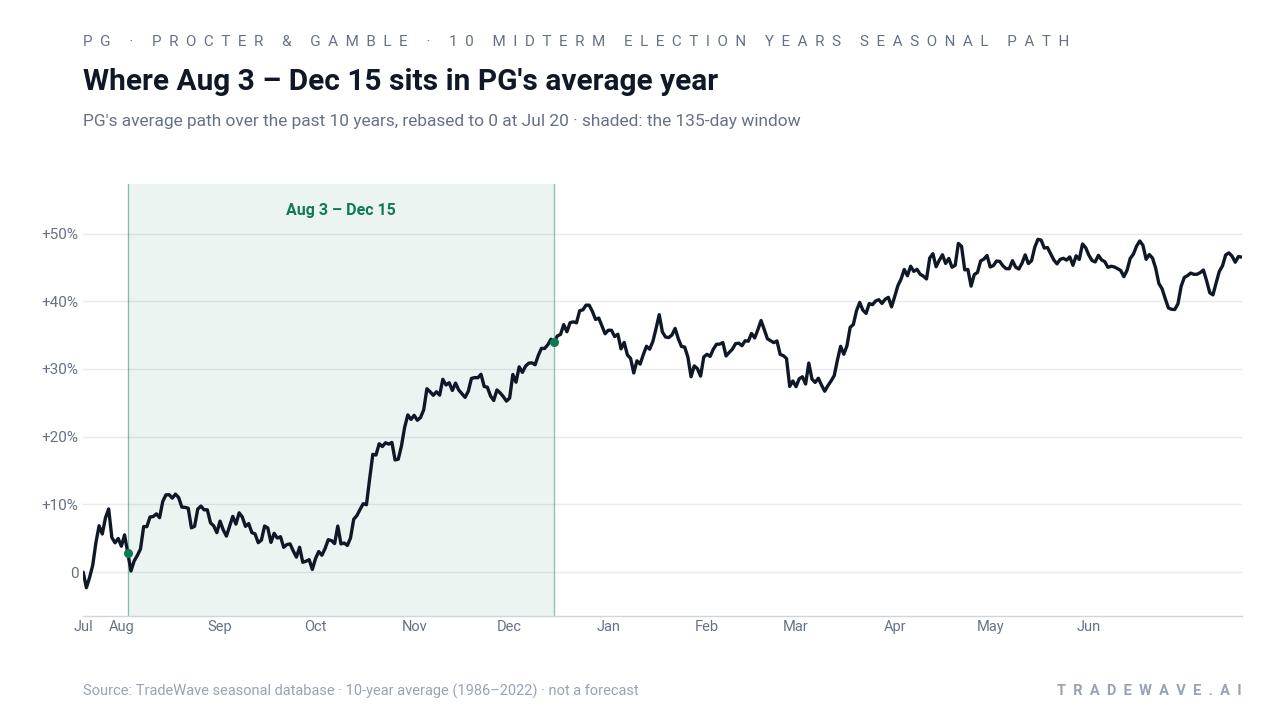
The cumulative chart of this Procter & Gamble trading window tells the same story in one line. Repeating the Aug 3–Dec 15 long exposure across the 10 midterm-year samples compounds to roughly 133% total return, a steady stair-step higher rather than a jagged pattern of wins and losses. Add it up: 10 for 10 with triple-digit cumulative gains is an unusually clean seasonal trend for a mega-cap staple.
History does not guarantee future results; adverse excursions can be large even in winning windows, and past MAE levels show that drawdowns of 10% to 15% have occurred inside this pattern.
Why does Procter & Gamble (PG) follow this seasonal pattern?
One likely driver is the way midterm-year policy uncertainty and rate debates push investors toward defensive, dividend-paying names in the back half of the year. Analysts have also pointed to consumer spending cycles, with back-to-school, holiday and year-end promotional periods supporting volumes for household and personal-care products. The pattern may further reflect institutional portfolio rebalancing, as managers lock in gains elsewhere and rotate into staples like Procter & Gamble ahead of the historically stronger pre-election year.
What is driving Procter & Gamble (PG) today?
Procter & Gamble shares closed at $143.96 on Jul 31, down 1.5% on the session and roughly 7.3% above the 52-week low of $133.67, after investors continued to digest a mixed fiscal 2026 report and muted fiscal 2027 outlook. The company reported fourth-quarter net sales of $21.203 billion, up 2% year over year but slightly below Wall Street’s revenue estimate, while adjusted EPS of $1.43 came in a touch ahead of expectations.[1][2]
Management guided to core EPS of $6.89 to $7.11 for fiscal 2027 and all-in sales growth of 1% to 3%, framing the year as one of modest expansion rather than a breakout.[2][7] Executives flagged roughly $1 billion in after-tax headwinds from higher raw materials, energy and transportation costs, along with drags from net interest, nonoperating income and foreign exchange, which together represent about a $0.56 EPS hit.[2][7] That cost backdrop helps explain why the stock has slipped over the past month even as the broader consumer backdrop remains described as “stable.”[1][6][7]
Analysts at Morningstar and elsewhere have highlighted P&G’s decision to lean harder into brand spending and product innovation to support share in slow-growing categories, a strategy that pressures margins in the near term but aims to protect pricing power.[4] Yahoo Finance and Reuters coverage has also emphasized a split consumer, with higher-income shoppers still trading up to premium offerings while lower-income households remain cautious, weighing on volumes in some segments.[6][7] That mix leaves Procter & Gamble straddling both defensive and growth narratives as it heads into a historically supportive seasonal window.
The chart below situates the latest pullback against the past year’s trading range and a historical seasonal projection.
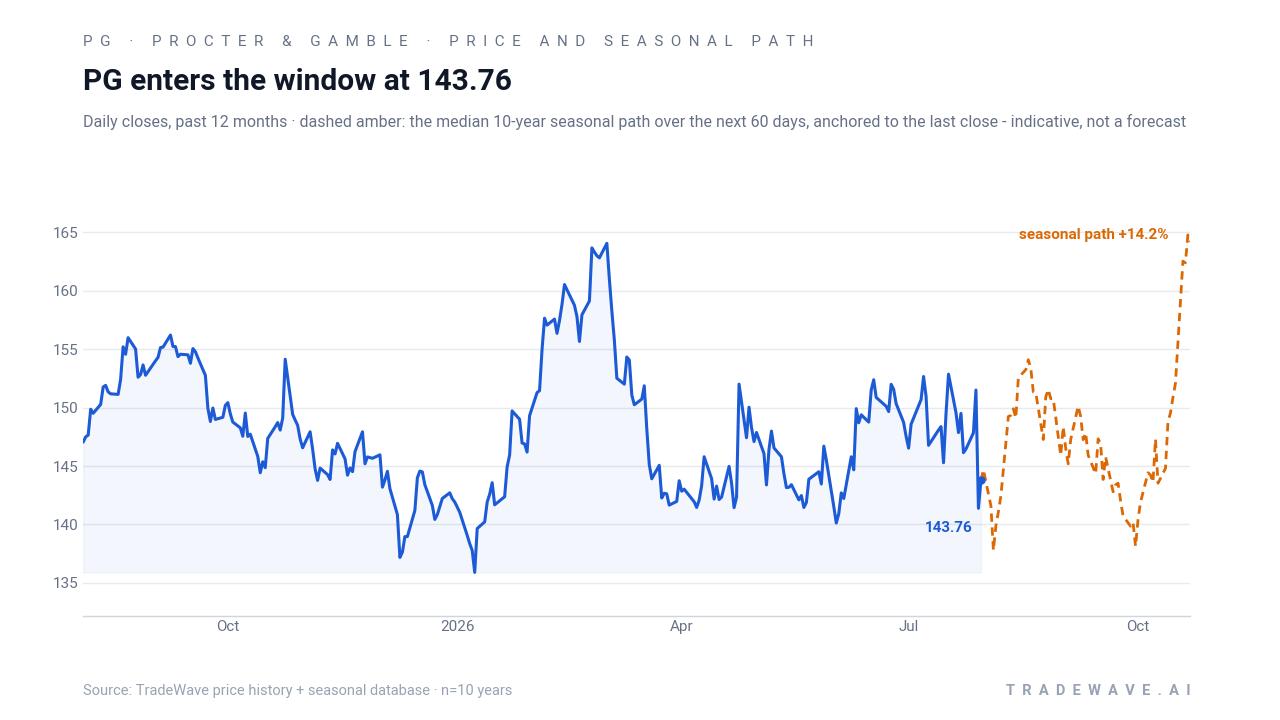
What should traders watch as this Procter & Gamble (PG) window opens?
First, the calendar: the Aug 3 start date means this midterm-year seasonal regime kicks in within days and runs through Dec 15, overlapping back-to-school, holiday and early pre-election positioning. Second, levels: traders will be watching whether Procter & Gamble can hold above the mid-$130s zone that has defined the 52-week low area, and whether any bounce toward the $150 region lines up with the historical pattern of gains building as the window progresses.
Third, fundamentals and policy: upcoming inflation prints, rate expectations and any shifts in Washington’s fiscal stance will matter for staples valuations, especially given management’s explicit $1 billion cost headwind and cautious sales outlook.[1][2][7] If input costs ease or pricing holds better than feared, the historical midterm-year seasonal strength could have more room to express itself. If costs stay sticky and volumes soften further, the same window that has historically been friendly to longs could instead be spent working off valuation.
Finally, behavior inside the window will be the real test of this Procter & Gamble seasonal trend. A pattern of higher lows, constructive reactions to any macro or company-specific headlines, and volume building on up days would be consistent with the 10-for-10 historical record. A break of the recent lows or persistent selling on good news would contradict that history and signal that this midterm-year cycle is trading to a different script.
Sources
- CNBC, "Procter & Gamble (PG) Q4 2026 earnings" (Jul 29, 2026)
- Procter & Gamble Investor Relations, "P&G Announces Fourth Quarter and Fiscal Year 2026 Results" (Jul 29, 2026)
- Morningstar, "Procter & Gamble Earnings: Wisely Leaning on Brand Spending to Turn the Tide on Its Sales Trajectory" (Jul 29, 2026)
- Yahoo Finance, "P&G stock dips on soft outlook despite 'stable' consumer" (Jul 30, 2026)
- Reuters, "P&G forecasts slower annual sales growth as costs weigh" (Jul 29, 2026)
- MarketBeat, "Insider Selling: Procter & Gamble (NYSE:PG) CEO Sells 36,093 Shares of Stock" (Feb 13, 2026)
About this seasonal analysis
Seasonal pattern data is sourced from TradeWave.ai, which analyzes historical price behavior across annual calendar windows going back up to 30 years. Read the full data methodology or the book The 100-Year Pattern by Afshin Moshrefi (2026 edition). Past performance of seasonal patterns does not guarantee future results. This article is for informational purposes only and does not constitute investment advice.