Amazon (AMZN) Has Rallied in 6 of 6 Midterm Jul 31-Aug 16 Windows, Averaging 5.32% Gains
Amazon is about to enter a 17-day window that has never produced a loss in past midterm election years, just as Wall Street zeroes in on Q2 earnings, AWS growth and heavy AI spending.
Price as of Jul 29, 2026: $226.65 (last close).
What is the seasonal pattern for Amazon (AMZN)?
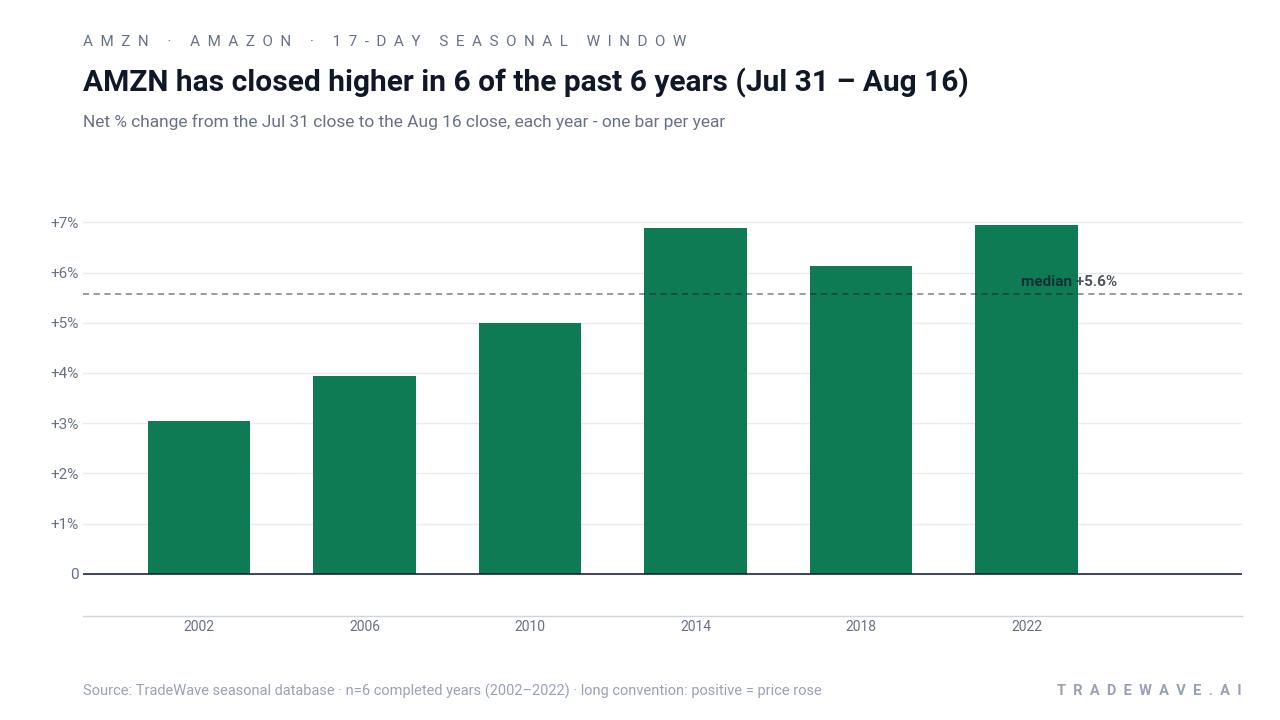
Amazon has risen in 6 of 6 years during this late-July to mid-August midterm-year window, with an average gain of 5.32% in winning years.
- 6 for 6 in this window, averaging 5.32% gains in winning years across the last six midterm election cycles.
- The upcoming 17-day trading window runs from Jul 31 to Aug 16 and has historically favored long positions in AMZN.
- Percent Profitable is 100%, with 6 winners and 0 losers across the lookback sample.
- Average profit of 5.32% compares with a cumulative return of 36% when stacking the window across all six years.
- Intraperiod swings have been meaningful, with some years seeing double-digit drawdowns even as the window finished higher.
- The pattern sits in the midterm election year phase, where policy uncertainty and AI capex debates can amplify volatility around earnings.
According to historical data from TradeWave.ai, this specific late-July to mid-August stretch has behaved very differently from an average month for Amazon in past midterm election years.
How has Amazon (AMZN) traded in this late-July midterm-year window?
Amazon has closed higher in this Jul 31 to Aug 16 window in 6 of the last 6 midterm election years, averaging a 5.32% gain for the stock. Shares finished Thursday’s session at 226.65, leaving the stock about 18.6% below its 52-week high of 278.56 and roughly 15.7% above the 52-week low of 196.00. That combination of a clean historical win streak and a stock trading well off its highs gives this year’s window more weight than a typical summer lull.
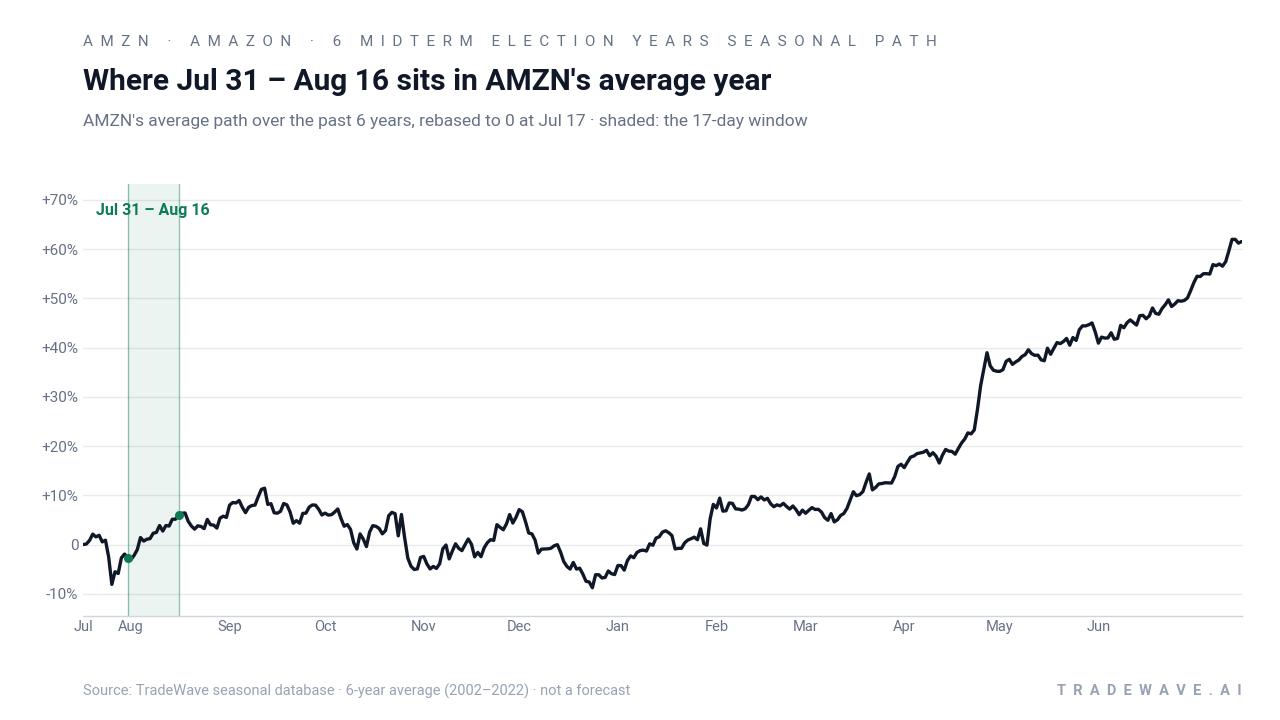
Grouping the data by presidential election cycle matters here because this year is a midterm election year, and midterms often bring a different policy and liquidity backdrop than pre-election or election years. For a mega-cap like Amazon, that backdrop can shape how investors react to earnings, AI capex headlines and regulatory noise during this specific slice of the calendar.
Across the six midterm election years in the sample, the strongest window came in 2022, when AMZN gained 6.94% between Jul 31 and Aug 16, with a best intraperiod run-up of 8.26% from the entry price. The softest outcome was in 2002, when the stock still finished the window up 3.04% but endured a maximum drawdown of 11.62% from the starting level before recovering. That mix of steady positive finishes and sometimes deep mid-window dips is what makes this pattern both attractive and risky for traders watching the AMZN seasonal trend.
A second view shows how far AMZN has tended to swing inside the window before settling at its final gain.
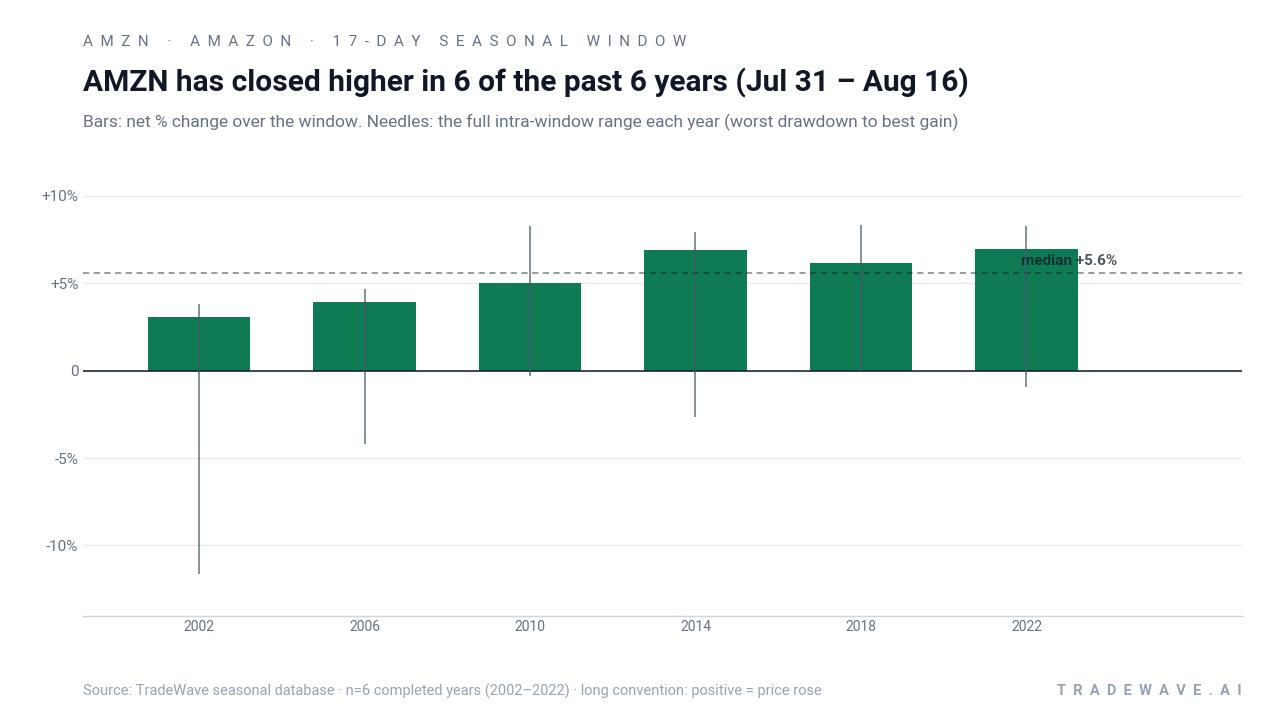
The bar-and-needle profile shows that in most years AMZN has pushed several percentage points higher at some point during the window, with maximum favorable moves often in the 7% to 8% range. At the same time, the worst intraperiod drawdowns have occasionally been sharp, including that 11.62% slide in 2002 before the stock clawed back into positive territory. For a long-biased pattern, that combination of strong maximum favorable moves and sometimes deep maximum adverse moves means the TradeWave Ratio of 3.23 is being earned with real volatility, not a smooth grind higher.
The cumulative chart for this midterm-year slice compounds those 17-day gains into a 36% total return across the six completed cycles. There are no losing years in the stack, so the line steps higher every time the window appears, rather than chopping sideways. Add it up: six midterm election years, six green outcomes, and a mid-summer window that has quietly delivered more than a third of a year’s worth of return when stitched together.
History does not guarantee future results; adverse excursions can be large even in winning windows, and traders should treat the historical pattern as context rather than a forecast.
Why does Amazon (AMZN) follow this seasonal pattern?
One likely driver is the clustering of Amazon’s Q2 earnings and guidance updates in this part of the calendar, which can reset expectations for AWS growth, retail margins and AI capex in a single shot.[4] Midterm election years also tend to feature shifting policy debates around regulation and taxation, which can push large-cap tech flows around earnings season more than in quieter years.[1] The result is a window where strong fundamental narratives have often lined up with a supportive seasonal backdrop, even if the path from entry to exit has been bumpy.
What is driving Amazon (AMZN) today?
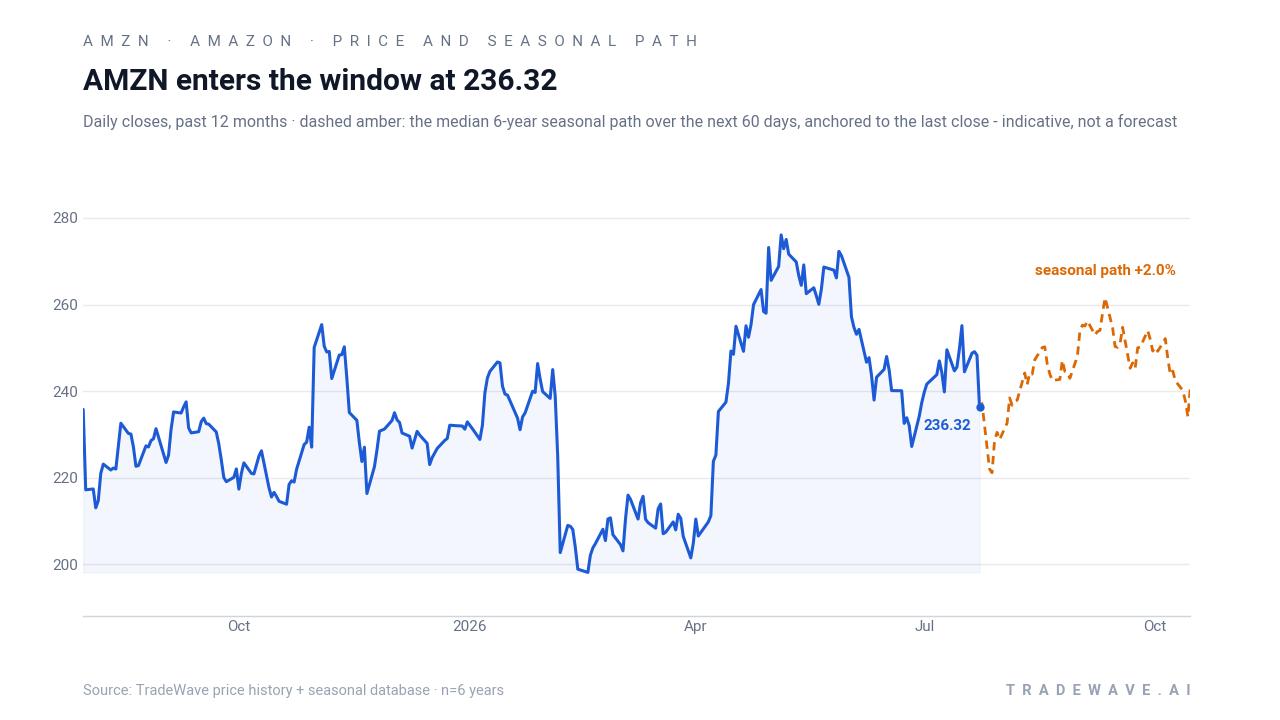
Amazon closed Thursday at 226.65, down 1.8% on the day, leaving the stock about 18.6% below its 52-week high of 278.56 and still comfortably above its 52-week low of 196.00. The pullback comes with Q2 2026 earnings due after the bell, where Wall Street is looking for roughly $198 billion in revenue and about $1.82 in EPS, with AWS growth and AI spending plans set to dominate the call.[2][4] Analysts say AWS revenue growth in the low-30% range would reassure investors that Amazon can fund its heavy AI and infrastructure capex, which some estimates peg near $200 billion for 2026, without derailing free cash flow.[4][5]
Regulatory risk is also in the mix after a Senate probe into alleged Chinese influence over Amazon’s third-party marketplace triggered a roughly 4% single-day drop earlier this week, reminding traders that policy headlines can still hit the stock even in the middle of an AI-driven bull case.[1] At the same time, Amazon’s stake in Anthropic has become a fresh talking point, with one analysis suggesting a potential Anthropic IPO could be worth as much as $240 billion to Amazon over time if the AI start-up’s valuation tracks bullish scenarios.[3] Against that backdrop, Wall Street’s average price target sits about 34% above the current share price, and the consensus rating remains firmly in Buy territory, though those targets were set when the stock traded closer to its highs.[1][7]
The chart below shows how that mix of earnings anticipation, regulatory noise and AI optimism has played out in AMZN’s price over the past year, alongside the median seasonal path for the next two months.
What should traders watch in this Amazon (AMZN) window?
First, the earnings reaction will set the tone. A strong print on AWS growth and a clear roadmap for AI capex could align with the historically bullish seasonal window, especially if the stock can reclaim the 50-day moving average near 247.72 in the days after the report.[2][4] Conversely, a weak guide or a renewed regulatory shock could test how resilient this midterm-year pattern really is if AMZN breaks back toward the low-200s despite the historical tailwind.[1]
Second, watch how the stock behaves inside the window relative to its intraperiod history. In prior cycles, some of the best years saw AMZN rally early in the 17-day stretch and then consolidate, while the tougher years featured a sharp drawdown before a late recovery into the close. If the stock quickly pushes 5% to 7% higher from the Jul 31 starting level and holds those gains, it would rhyme with the stronger historical years. A deep slide of 8% to 10% before any bounce would look more like 2002’s path, where the pattern still finished green but only after a painful dip.
Finally, the broader policy and AI calendar matters. Any fresh headlines out of Washington on tech regulation or antitrust, or new disclosures on Anthropic’s trajectory and Amazon’s satellite ambitions, could either reinforce or fight the seasonal bias.[1][3][6] For traders, the key tell will be whether AMZN’s price action respects the historical tendency for this midterm-year window to finish higher, or whether a break of that six-for-six streak signals that the AI and regulatory regime in 2026 is rewriting the usual playbook.
Sources
- Yahoo Finance, "Amazon Stock Just Hit a Major Hurdle Ahead of Earnings" (Jul 27, 2026)
- The Motley Fool, "Prediction: Amazon's Earnings Report Shows That AWS ..." (Jul 29, 2026)
- Yahoo Finance, "Anthropic's IPO Could Be a $240 Billion Moment for Amazon (AMZN)" (Jul 29, 2026)
- Yahoo Finance, "Amazon Q2 earnings to put spotlight on AWS growth amid AI spending" (Jul 29, 2026)
- The Motley Fool, "Prediction: CEO Andy Jassy Will Raise Amazon's Full-Year 2026 Capex ..." (Jul 27, 2026)
- Seeking Alpha, "Amazon Leo to deploy 5K satellites for mobile connectivity" (Jul 27, 2026)
- The Motley Fool, "Wall Street's Average Amazon Price Target Sits 34% Above the Stock -- 4 Days Before Its Earnings." (Jul 26, 2026)
About this seasonal analysis
Seasonal pattern data is sourced from TradeWave.ai, which analyzes historical price behavior across annual calendar windows going back up to 30 years. Read the full data methodology or the book The 100-Year Pattern by Afshin Moshrefi (2026 edition). Past performance of seasonal patterns does not guarantee future results. This article is for informational purposes only and does not constitute investment advice.