Equinix (EQIX) Hikes 2026 Outlook and Enters a Historically Bullish 342-Day Midterm Stretch
Equinix is heading into a historically powerful midterm-year seasonal window even as shares trade below their highs and options traders lean bearish.
Price as of Jul 31, 2026: $1,019.28 (last close).

What is the seasonal pattern for Equinix (EQIX)?
Equinix has risen in 6 of 6 midterm-election-year windows starting around Aug 24, with an average gain of 34.39% in winning years.
- 6 for 6 in this window, with Equinix averaging 34.39% gains in winning years across the last six midterm election cycles.
- The upcoming 342-day Equinix trading window runs from Aug 24, 2026 through Jul 31, 2027 and has historically favored long positions.
- Percent Profitable is 100%, with 6 winners and 0 losers across the historical sample of midterm election years.
- Average profit of 34.39% reflects strong upside in each completed window, with individual years ranging from about 17% to 65% gains.
- Intraperiod swings have been large, with some years seeing deep drawdowns before finishing higher, underscoring meaningful volatility inside an otherwise bullish pattern.
- The pattern aligns with the midterm-to-pre-election phase of the presidential cycle, a stretch that has often been supportive for risk assets and data center REITs.
According to historical data from TradeWave.ai, this midterm-year window for Equinix has behaved very differently from an average calendar year. The next section walks through how that pattern has played out in prior cycles and what it could mean for the coming 342 days.
How has Equinix (EQIX) traded in past midterm-year windows?
Equinix has finished higher in every one of the last six midterm-election-year windows that start around Aug 24 and run for 342 days, averaging a 34.39% gain for long positions. Shares closed Monday at 1,019.28, about 9.4% below their 52-week high of 1,124.00, leaving room above if the historical EQIX seasonal trend reasserts.
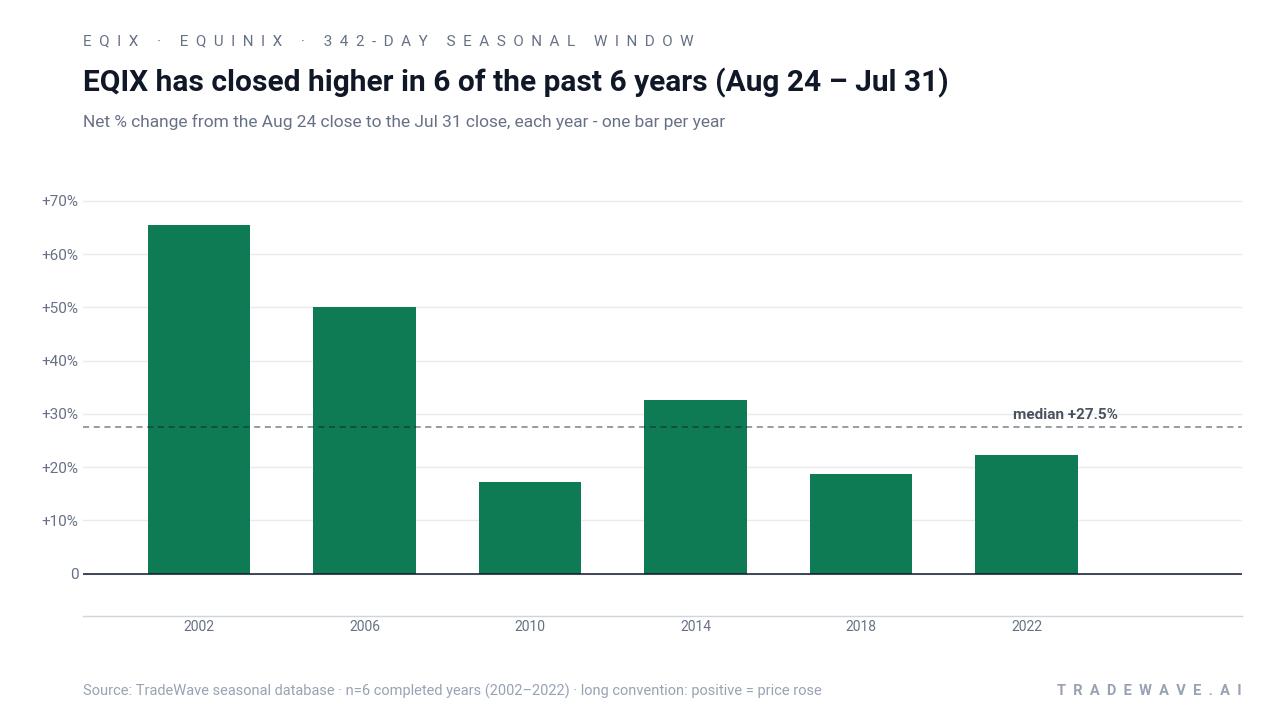
The grouping here is not six consecutive calendar years but the last six midterm election years, each followed through to the next pre-election year. That matters because policy, regulation and liquidity often move in election-cycle waves, and data center REITs like Equinix can feel those shifts through enterprise IT budgets and AI infrastructure spending.
Across those six midterm-year windows, Equinix’s annualized return clocks in at 33.27%, with a cumulative gain of 460% if an investor had only been exposed during this specific Aug 24 to Jul 31 stretch each cycle. The median outcome is a 27.45% gain, which means even the “middle” year in the sample delivered a strong double-digit return for the long trade.
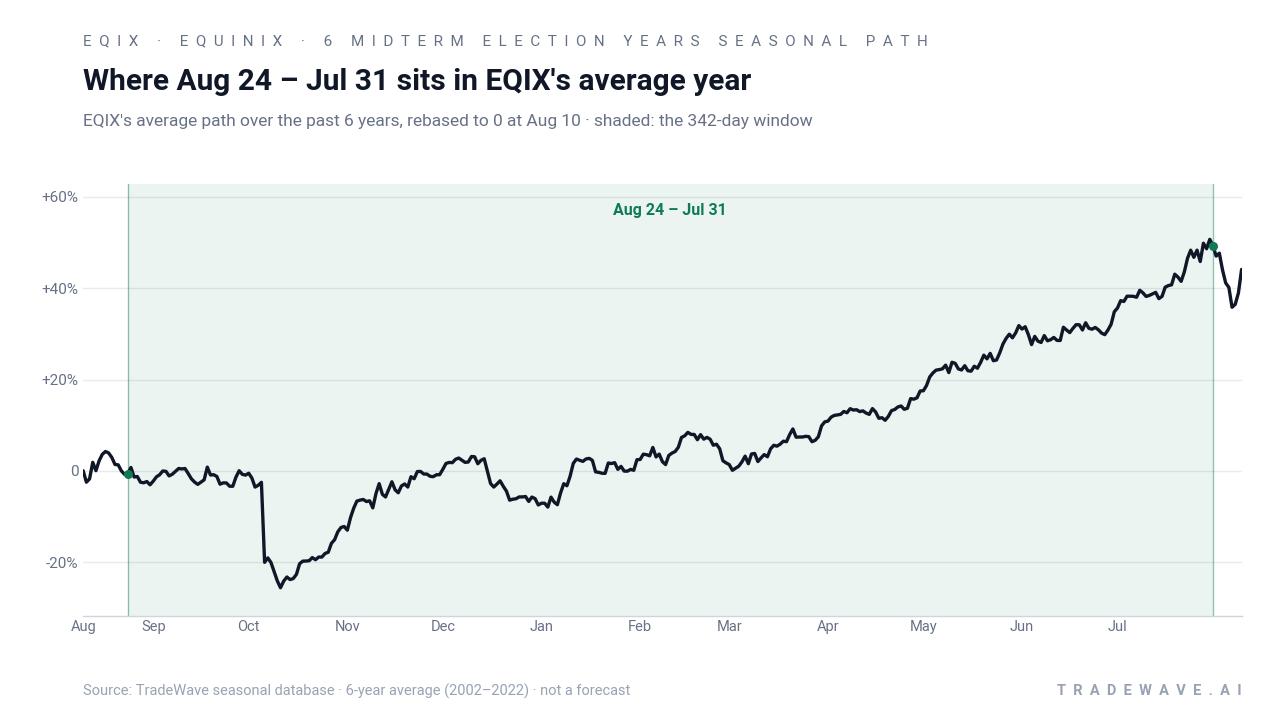
A second view shows how much Equinix has typically swung inside the window before finishing higher.
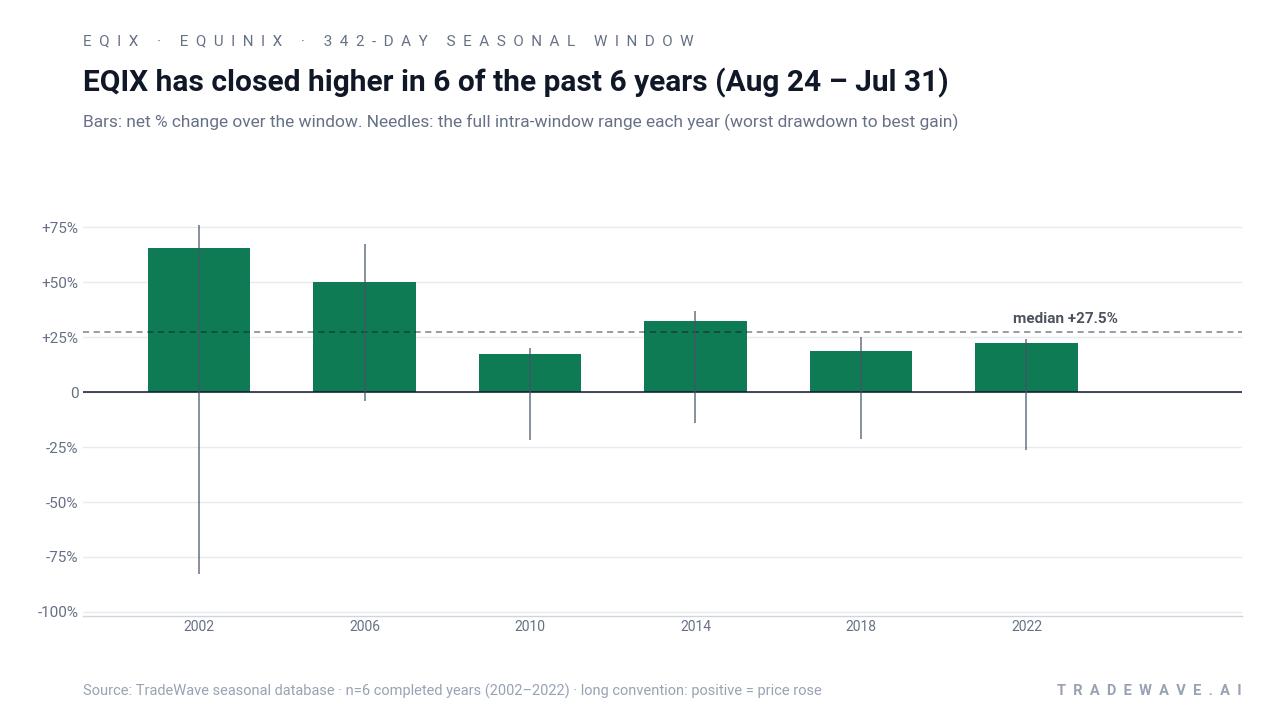
Per-year detail shows how that plays out. In 2002, the strongest year in the sample, Equinix gained 65.37% over the window, with a best intraperiod run-up of 75.78% but also a punishing worst drawdown of 82.64% from the entry at one point. At the other end, 2010 still finished up 17.22%, yet the stock was down as much as 21.98% inside the window before recovering.
Those maximum favorable and adverse excursions underline the character of this EQIX seasonal trend. The long trade has historically been rewarded, but the path has often been bumpy, with large swings both ways before the final close. The TradeWave Ratio of 1.57 and Sharpe ratio of 1.57 capture that mix of strong average returns and meaningful volatility in a risk-adjusted framework.
Stacking the windows compounds quickly. Running the Aug 24 to Jul 31 strategy across the six midterm-election-year samples would have turned a hypothetical 1-unit stake into roughly 5.6 units, a 460% cumulative gain, even though each year’s path included sizable drawdowns along the way. Add it up: six for six, with every cycle delivering a positive result for longs despite some deep interim pain.
History does not guarantee future results; adverse excursions can be large even in winning windows, and traders need to respect the potential for sharp drawdowns inside an otherwise bullish seasonal regime.
Why does Equinix (EQIX) follow this seasonal pattern?
One likely driver is the way Equinix’s earnings calendar and capital spending plans line up with the midterm-to-pre-election phase, when corporate IT and AI infrastructure budgets often loosen after early-cycle uncertainty. Analysts have also pointed to institutional portfolio repositioning into digital infrastructure as policy clarity improves heading into the presidential election year, which can favor large-cap data center REITs. This pattern may also reflect sector rotation, as investors shift from early-cycle growth leaders toward more stable, cash-generating platforms like Equinix during this part of the election cycle.
What is driving Equinix (EQIX) today?
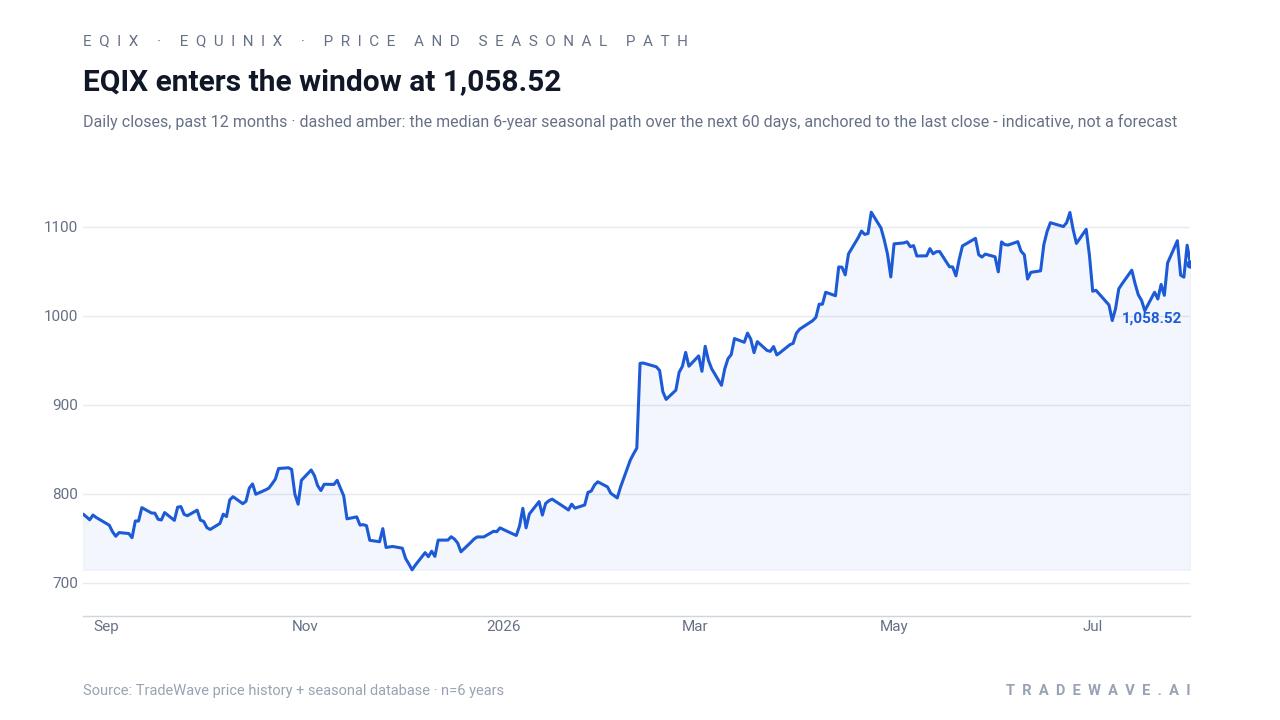
Equinix fell 2.7% Monday to 1,019.28, extending a pullback that leaves the stock about 9.4% below its 52-week high of 1,124.00 and under its 50-day moving average around 1,054.28. The move follows a late-July earnings update where the company raised its full-year 2026 revenue and AFFO outlook but paired that with a softer-than-expected third-quarter revenue forecast, a combination that knocked the shares lower despite the longer-term upgrade.[5] At the same time, options traders have been leaning defensively, with MarketBeat flagging an unusually large burst of put buying on Jul 31 that ran 448% above typical volume, alongside commentary that short interest has ticked up to roughly 2% of float.[8]
In late July, Reuters reported that Equinix lifted its 2026 revenue guidance range to roughly $10.21 billion to $10.29 billion and raised its full-year AFFO per-share outlook to $42.69 to $43.29, even as the midpoint of its third-quarter revenue forecast landed slightly below Wall Street estimates.[5] Earlier in the year, a February guidance hike and dividend increase helped drive a sharp rally, with MarketBeat describing a 12% jump tied more to the outlook than to backward-looking results.[9] A separate July analysis argued that the stock looked attractive on cash flow metrics but expensive on earnings, underscoring the valuation debate around a name that sits at the center of AI-driven data center demand.[6]
The chart below situates the latest pullback against the past year of trading and the median 60-day seasonal path.
What should traders watch as the next seasonal window opens?
The next 342-day Equinix trading window begins on Aug 24, placing the stock squarely in the midterm-to-pre-election phase that has historically been kind to longs. The key test will be whether the stock can stabilize above the recent low near 1,016.90 and reclaim its 50-day moving average as the window opens, which would align current price action with the historical EQIX seasonal trend.
Fundamentally, investors will be watching how the company executes against its raised 2026 revenue and AFFO targets after the softer third-quarter guide, and whether AI-related data center demand continues to support pricing and utilization.[5] Any further updates on hyperscale or enterprise AI deployments could act as catalysts inside a window that has previously delivered strong multi-quarter gains.
The options market is another important tell. The late-July spike in put buying and elevated defensive positioning set a cautious tone heading into this historically strong stretch.[8] If that put activity fades and open interest shifts toward calls as the window progresses, it would suggest that the market is leaning back toward the bullish seasonal script; if put demand stays heavy or builds, it would signal that traders are bracing for a break from the pattern.
In practical terms, the seasonal playbook will look more convincing if Equinix can absorb any near-term volatility around macro data, rates and tech earnings while holding above key support and gradually grinding higher into 2027. A failure to do so, especially if accompanied by persistent downside options flow and renewed guidance cuts, would be an early sign that this midterm-year window may not rhyme with the last six.
Sources
- Barchart – Is Equinix Stock Underperforming the Nasdaq? (Jun 3, 2026)
- Yahoo Finance / Insider Monkey – Analysts Raise Their Price Targets on Equinix (EQIX) (Apr 27, 2026)
- ChartMill – Equinix Shares Dip After Q1 Earnings Beat but Revenue Miss (Apr 29, 2026)
- Yahoo Finance – Equinix, Inc. (EQIX) latest stock news and headlines (Aug 1, 2026)
- Reuters via Yahoo Finance – Equinix shares fall on soft third-quarter forecast (Jul 30, 2026)
- Simply Wall St via Yahoo Finance – Equinix (EQIX) Stock Looks Like A Bargain On Cash Flow But Rich On Earnings (Jul 20, 2026)
- Yahoo Finance – Equinix news page and performance table (Aug 1, 2026)
- MarketBeat – Traders Buy High Volume of Equinix Put Options (NASDAQ:EQIX) (Jul 31, 2026)
- MarketBeat – EQIX Stock Jumps 12% on 2026 Guidance: Buy or Wait? (Feb 12, 2026)
About this seasonal analysis
Seasonal pattern data is sourced from TradeWave.ai, which analyzes historical price behavior across annual calendar windows going back up to 30 years. Read the full data methodology or the book The 100-Year Pattern by Afshin Moshrefi (2026 edition). Past performance of seasonal patterns does not guarantee future results. This article is for informational purposes only and does not constitute investment advice.