Earnings Revisions Turn Sharply Higher as Amphenol (APH) Enters a Bullish Midterm-Year Run
Amphenol is heading into a historically powerful 212-day trading window just as the stock trades near record highs and insiders cash out, setting up a tension between bullish seasonality and profit-taking risk.
Price as of Aug 17, 2026: $170.87 (last close).

What is the seasonal pattern for Amphenol (APH)?
Amphenol has risen in 8 of 8 midterm-election-year windows starting around Sep 5, with an average gain of 12.98% in winning years.
- 8 for 8 in this window, averaging 12.98% gains in winning years across the last 8 midterm election cycles.
- Seasonal window runs roughly from Sep 5 to Apr 4, spanning 212 calendar days in the midterm election year.
- Percent Profitable is 100%, with 8 winners and 0 losers over the historical sample.
- Average winner gain of 12.98% stacks to a 164% cumulative return when the window is repeated across all 8 cycles.
- TradeWave Ratio of 2.43 signals that price has typically traveled meaningfully in the long direction within the window.
- Sharpe ratio of 3.02 points to unusually strong risk-adjusted returns for this specific Amphenol trading window.
According to historical data from TradeWave.ai, this midterm-election-year stretch has behaved very differently from an average calendar period for Amphenol, and the next iteration is about to open again.
How has Amphenol (APH) traded in past midterm-year September–April windows?
Amphenol has closed higher in every single Sep 5 to Apr 4 midterm-election-year window on record, with gains in 8 of 8 cycles and an average move of 12.98%. Shares finished Monday at 170.87, up 2.25% on the day and sitting about 4.3% below their 52-week high of 178.52. In the last three months insiders have sold $18.7 million of stock with no reported buying, a notable counterweight to the bullish seasonal backdrop as the new window approaches.[3]
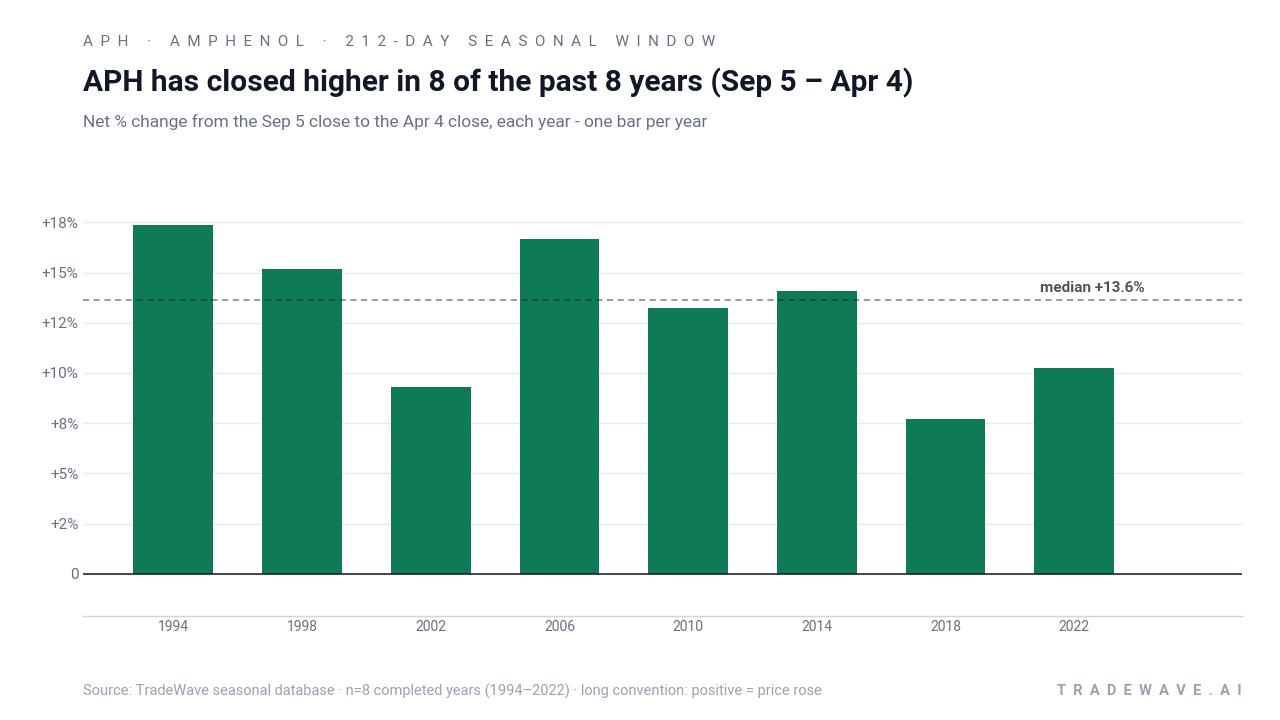
Grouping the data by the presidential election cycle matters here because this is a midterm election year, a phase that often brings policy noise early in the year and more constructive risk appetite as investors look ahead to the pre-election year. The Amphenol seasonal trend for Sep 5 to Apr 4 is calculated only across the last 8 midterm-election-year instances, so it reflects how the stock has behaved in this specific policy and liquidity backdrop rather than in an average year.
This seasonal window begins on Sep 5 and spans 212 days into early April. Historically, during this period in midterm election years, Amphenol has shown a strong upside tendency in line with a long trade direction. Percent Profitable sits at 100%, with 8 winners and 0 losers, so every midterm-year run of this window since 1994 has finished in the green. Average profit in those winning years is 12.98%, while the median outcome is slightly higher at 13.64%, which points to a fairly tight cluster of double-digit gains rather than a pattern driven by one outlier year.
The per-year table shows that the strongest window came in 2006, when Amphenol gained 16.68% between the Sep 5 entry and the Apr 4 exit, after reaching a best intraperiod run-up of 20.35%. At the other end of the spectrum, 2018 delivered the weakest net gain at 7.73%, with a maximum favorable move of 8.61% and a maximum drawdown of 20.8% from the entry price. Even in that softer year for the pattern, the stock still finished higher by the end of the window, which is consistent with the 8-for-8 record but also highlights that the path can be bumpy.
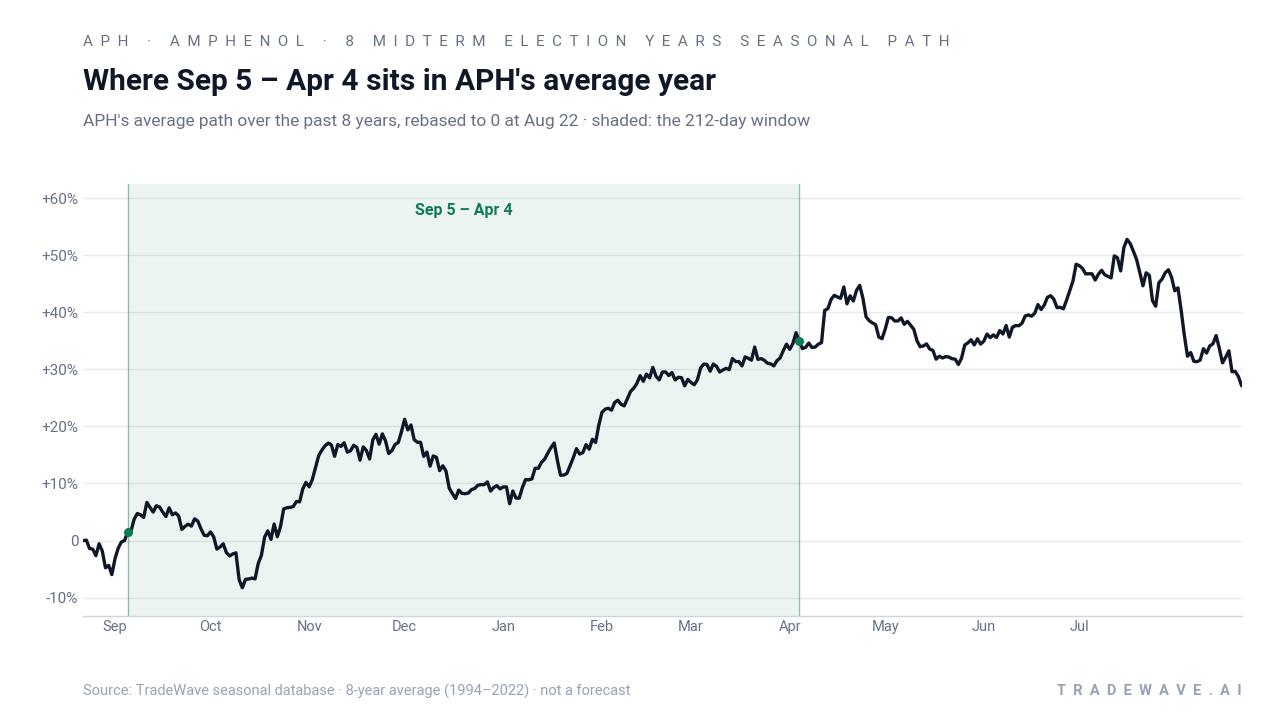
The historical seasonal average chart suggests that gains in this Amphenol trading window tend to build steadily rather than in a single burst. The average path slopes higher across most of the 212 days, with only modest pauses, which fits a picture of a stock that benefits from steady demand as the midterm year gives way to the year before the presidential election.
Year-by-year ranges of best and worst moves inside the window underline both the upside potential and the drawdown risk.
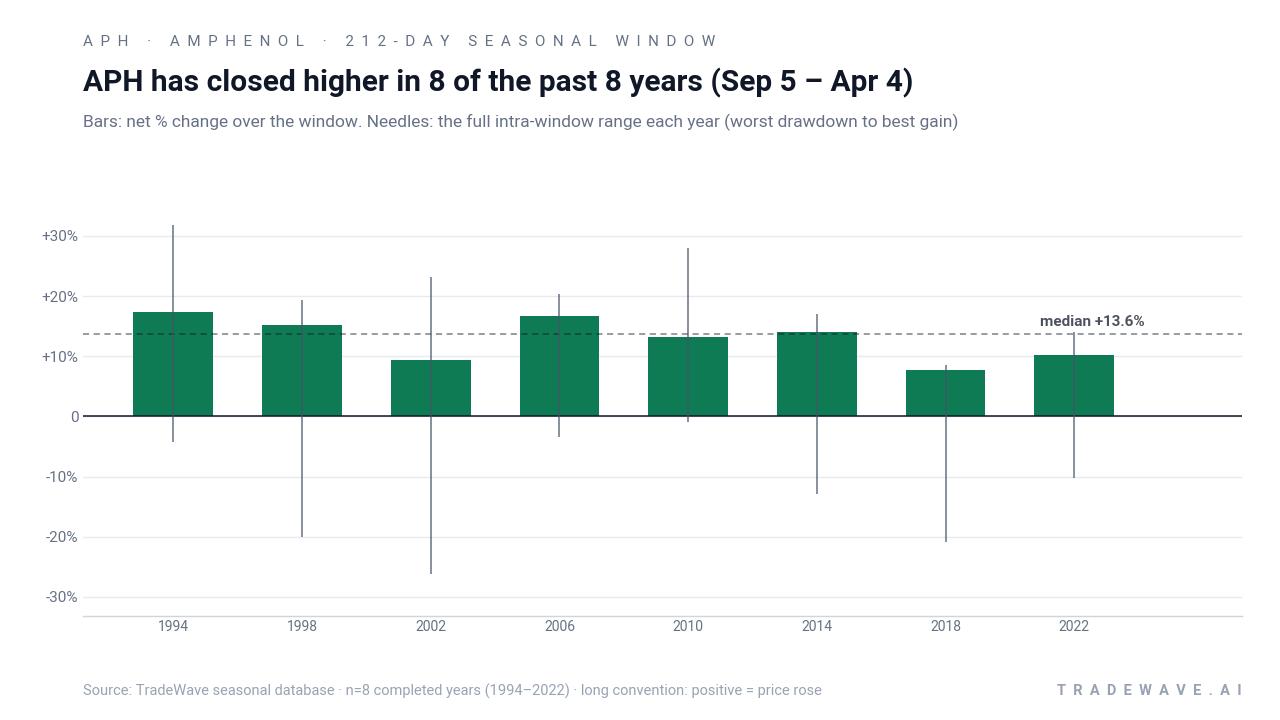
The combined net / maximum favorable / maximum adverse excursion view shows that Amphenol’s best intraperiod rallies in this window have often reached into the high teens or low 20s in percentage terms, while the worst drawdowns have at times pushed into the mid- to high-teens on the downside. In 2002, for example, the stock ultimately gained 9.3% but first endured a maximum adverse move of 26.16% before recovering to finish the window higher. That mix of strong MFE and occasionally deep MAE is consistent with a TradeWave Ratio of 2.43 and a Sharpe ratio of 3.02, which together describe a pattern of sizable directional travel with historically favorable risk-adjusted outcomes for long exposure.
History does not guarantee future results; adverse excursions (MAE) can be large even in winning windows.
Why does Amphenol (APH) follow this seasonal pattern?
One likely driver is the clustering of Amphenol’s earnings reports and guidance updates across the back half of the midterm year and into the following spring, which can reinforce trends when results beat expectations.[1] Institutional portfolio repositioning around the midterm election and into the historically stronger year before the presidential election may also favor high-quality technology and industrial names like Amphenol. The pattern may further reflect sector rotation into connectors, sensors and interconnect systems as capital spending plans for the next calendar year are finalized.
What is driving Amphenol (APH) today?
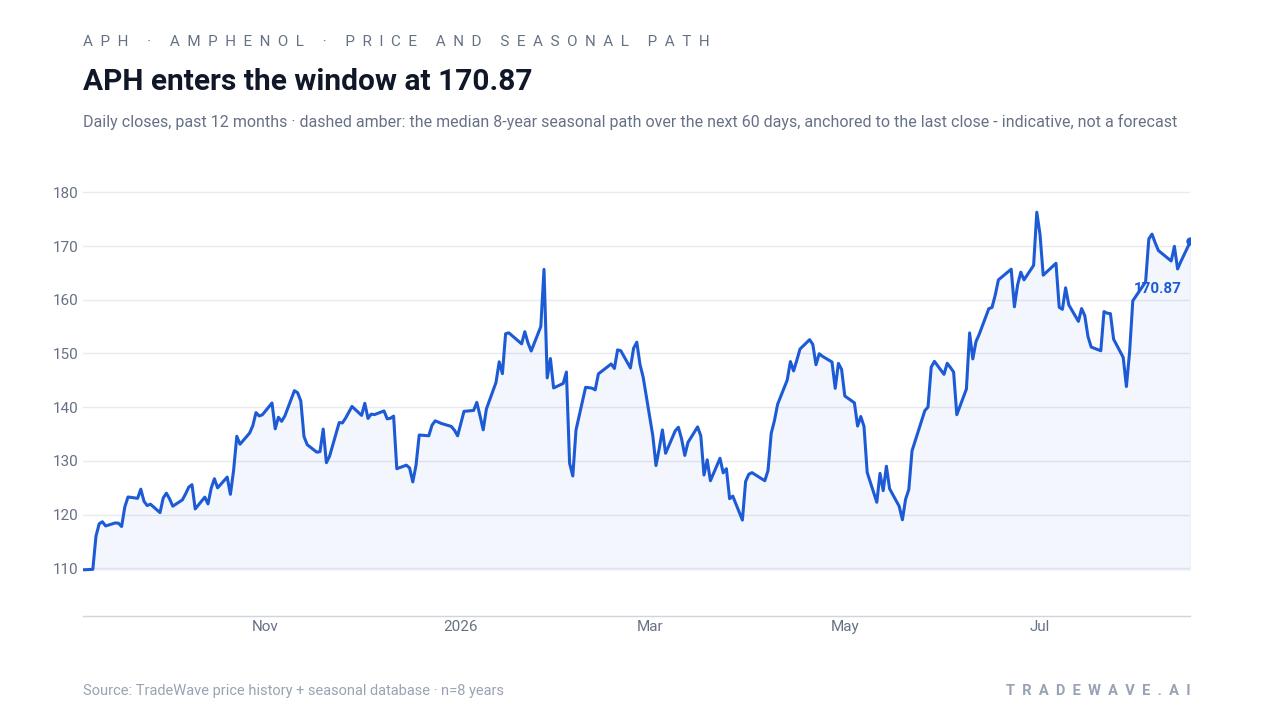
Amphenol shares closed Monday at 170.87, up 2.25% on the session, leaving the stock about 4.3% below its 52-week high of 178.52 and well above the 50-day moving average near 160.02. The move extends a strong run that accelerated after the July earnings report, when the company delivered its fourth straight beat versus the Zacks Consensus Estimate and returned $208 million via share repurchases alongside $307 million in dividends over the most recent quarter.[1] Upward earnings estimate revisions have tracked the rally, with Amphenol frequently cited as a market-beating name in technology-related screens that emphasize consistent execution and balance-sheet strength.[1]
At the same time, insider behavior has turned more cautious. In June 2026, GuruFocus reported that insiders had sold $18.7 million worth of Amphenol shares over the prior three months with no offsetting insider buying, a pattern that often signals profit-taking after a strong run rather than distress but still gives some investors pause at elevated valuations.[3] Earlier GuruFocus coverage in June also highlighted Amphenol’s high GF Score, which reflects a blend of profitability, growth and valuation metrics, even as the stock experienced a short-term pullback.[2] Options data from Barchart show active trading in Amphenol contracts, though there has been no clearly documented unusual options activity flagged in recent days.[4]
The chart below situates the latest move in its recent multi-month context and overlays the median 60-day seasonal path.
What should traders watch as the Sep 5 window opens?
For traders focused on the Amphenol seasonal trend, the first marker is the Sep 5 open, which defines the entry point for this 212-day midterm-year window. Price action around the 170 to 178 band will matter: a sustained push through the 52-week high with contained drawdowns would be consistent with prior strong windows, while a sharp rejection from that zone would echo years like 2002 and 2018, when the stock dipped deeply before recovering. Intraperiod behavior relative to the historical maximum adverse moves is key, since past windows have tolerated double-digit drawdowns and still finished higher.
Fundamentally, investors will be watching whether the earnings revision trend that supported the recent rally continues into the next couple of quarters, especially as macro conditions and capital spending plans evolve.[1] Any shift in guidance or order commentary could either reinforce the bullish historical seasonality or blunt it. The insider selling backdrop is another variable: if the pace of sales slows or reverses into modest insider buying, that would ease one of the few clear caution flags; if selling accelerates as the stock retests highs, it would strengthen the case that some insiders view this seasonal window as an opportunity to lock in gains.[3]
Finally, the broader policy calendar matters because this window bridges the back half of the midterm election year and the early part of the year before the presidential election, a phase that has often coincided with improving risk appetite in equities. If Amphenol continues to trade with strong volume on up days, holds above its 50-day moving average and treats pullbacks as consolidation rather than trend breaks, that behavior would line up with the 8-for-8 historical record. A decisive break below recent support with expanding downside volume would be an early sign that this cycle might diverge from the past, even in a historically favorable seasonal window.
Sources
- Zacks.com - Bull of the Day: Amphenol (APH) - August 13, 2026
- GuruFocus - Amphenol Corp (APH) Shares Fall 4.4% -- What GF Score of 96 Tells Investors
- GuruFocus - Amphenol Corp (APH) Shares Surge 3.1% -- What GF Score of 94 Tells Investors
- Barchart - APH Options Prices for Amphenol Corp Stock - Barchart.com
- Barchart - Amphenol Stock Outlook: Is Wall Street Bullish or Bearish?
About this seasonal analysis
Seasonal pattern data is sourced from TradeWave.ai, which analyzes historical price behavior across annual calendar windows going back up to 30 years. Read the full data methodology or the book The 100-Year Pattern by Afshin Moshrefi (2026 edition). Past performance of seasonal patterns does not guarantee future results. This article is for informational purposes only and does not constitute investment advice.