13-for-13: Lilly (Eli) (LLY) Has Rallied in Every Midterm Aug-Apr Window, Averaging 15.81% Gains
Lilly (Eli) is approaching a historically powerful 238-day seasonal window just as GLP-1-fueled earnings and fresh regulatory wins keep the stock pinned near record highs.
Price as of Aug 13, 2026: $1,209.00 (last close).

What is the seasonal pattern for Lilly (Eli) (LLY)?
Lilly (Eli) has risen in 13 of 13 midterm-year Aug 31 to Apr 25 windows, with an average gain of 15.81% in winning years.
- 13 for 13 in this window, averaging 15.81% gains in winning years across the last 13 midterm election cycles.
- Percent Profitable is 100%, with 13 winners and 0 losers for long trades in the Aug 31 to Apr 25 window.
- Average profit of 15.81% compares with a 15.59% annualized return and a Sharpe ratio of 1.74 for this specific seasonal setup.
- Trade Direction is long, and the TradeWave Ratio of 2.08 signals that price has typically traveled meaningfully in the trade direction within the window.
- Individual years have seen strong upside bursts, with historical best point-to-peak moves reaching as high as 49.41% before the window closed.
- The pattern sits in the midterm election year phase, a part of the presidential cycle where policy and healthcare spending debates often intensify.
According to historical data from TradeWave.ai, this upcoming stretch for Lilly (Eli) behaves very differently from an average calendar period, with a distinct election-cycle flavor that most traders never see quantified.
How has Lilly (Eli) (LLY) traded in past midterm-year Aug–Apr windows?
Lilly (Eli) has risen in 13 of 13 midterm election years during the Aug 31 to Apr 25 window, averaging 15.81% gains for long positions. Shares finished the prior session at 1,209.00, down 0.9% on the day and sitting close to their 52-week high of 1,249.45. That combination of a clean historical seasonal trend and a stock already priced for perfection gives this next 238-day stretch unusual weight for a mega-cap healthcare leader.
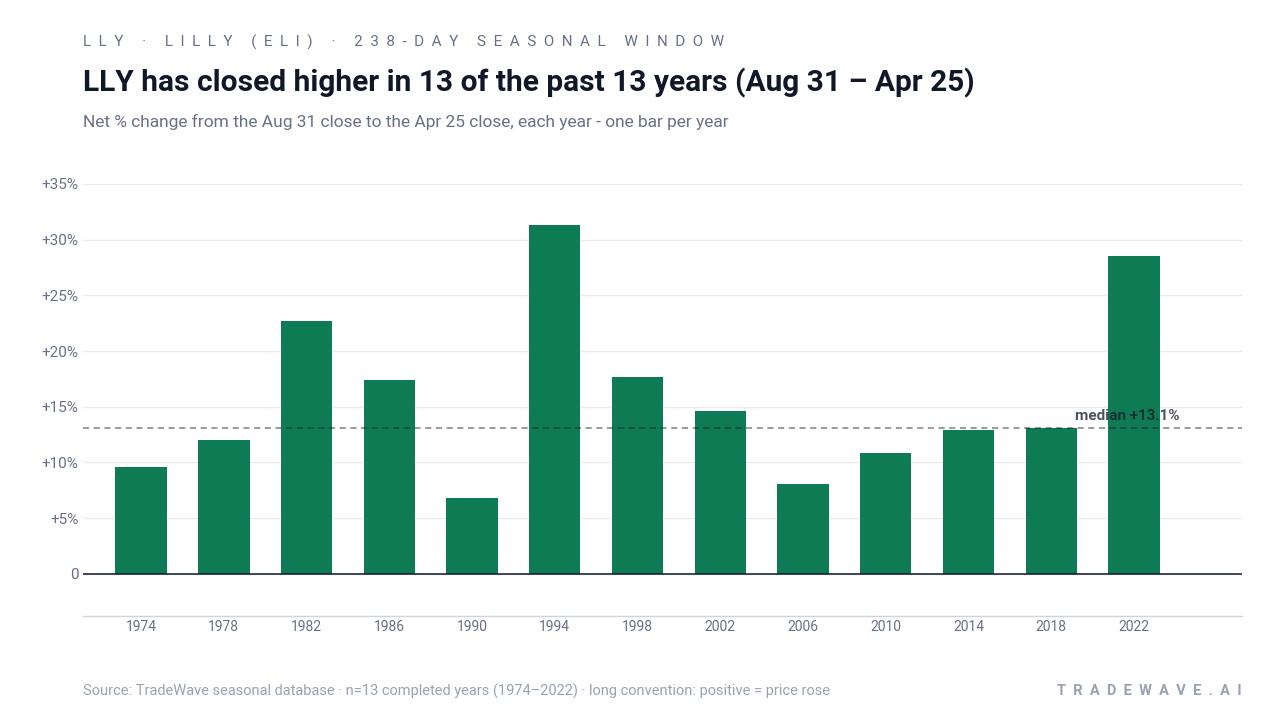
Grouping the data by the presidential election cycle matters here because this pattern only looks at midterm election years, when Washington is debating spending, drug pricing and regulation ahead of the next presidential race. For a company as exposed to U.S. healthcare policy as Lilly, that policy calendar can shape both sentiment and flows in ways that repeat from cycle to cycle.
The raw stats are striking. Percent Profitable is 100%, with 13 winners and 0 losers across the last 13 midterm-year iterations of this 238-day window. Average profit for those winning years is 15.81%, with a median gain of 13.08%, and the annualized return for the pattern clocks in at 15.59%.
Individual years show a wide range of upside outcomes. The strongest net gain in the sample came in 1994, when Lilly advanced 31.28% between the Aug 31 entry and the Apr 25 exit, while 2022 delivered a 28.51% net return over the same calendar slice. On the softer side, 1990 still finished higher by 6.83%, underscoring that even the weakest years in this LLY seasonal trend have historically been positive for long exposure.
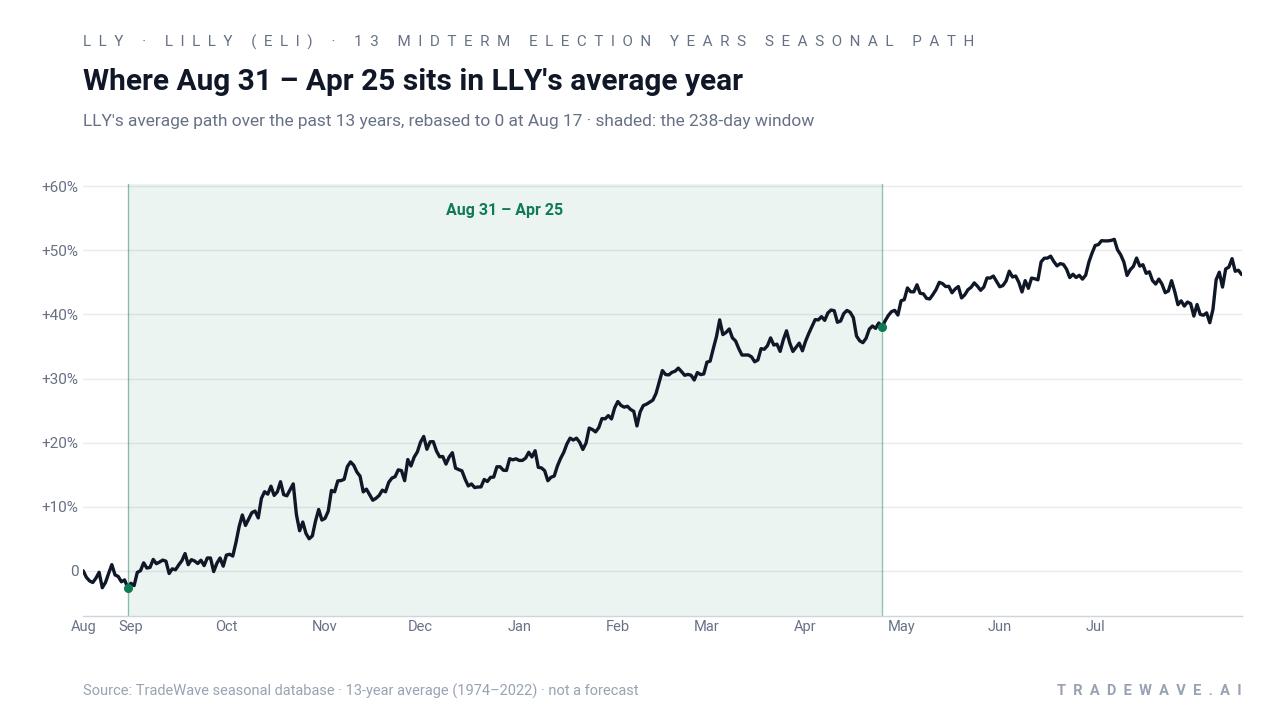
The next view layers in both the best rallies and the worst drawdowns that have occurred inside each of those windows.
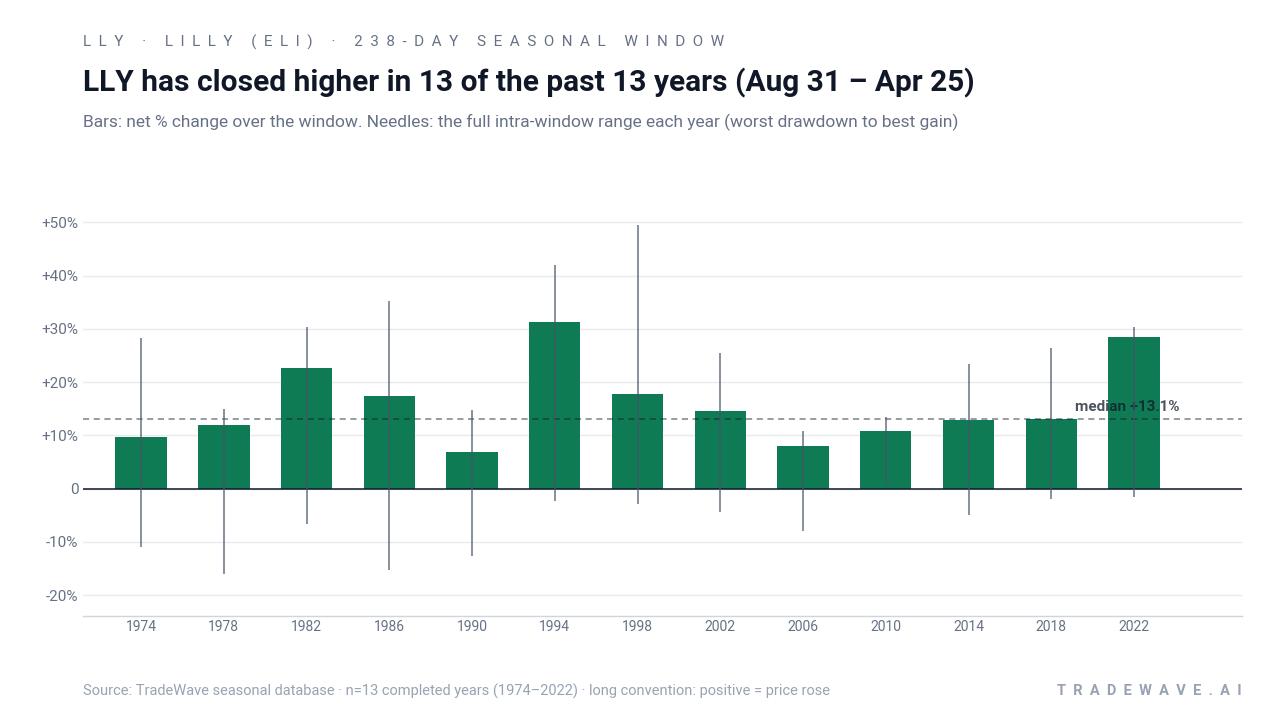
The maximum favorable move, or best point-to-peak gain within the window, has reached as high as 49.41% in 1998 and 42.02% in 1994, showing how powerful some years have been before the final close. On the downside, the worst intraperiod drawdowns have still been material, with maximum adverse excursions of around 15.37% in 1986 and 12.65% in 1990, reminding traders that even a strong LLY seasonal trend can involve sharp pullbacks along the way.
The cumulative view is just as eye-catching. Compounding this 238-day midterm-year window across the 13 completed cycles produces a 557% cumulative return, which reflects how consistently the pattern has added to long exposure over time rather than relying on one or two outlier years. Add it up: 13 straight wins and more than fivefold cumulative gains across these specific midterm-year slices.
History does not guarantee future results; adverse excursions can be large even in winning windows, and a 100% hit rate in the past does not mean the next iteration will behave the same way.
Why does Lilly (Eli) (LLY) follow this seasonal pattern?
One likely driver is the way earnings and guidance updates cluster for big pharma around the back half of the year and into the following spring, which lines up with this Aug 31 to Apr 25 window. Analysts have also pointed to institutional portfolio repositioning around the midterm election year, when healthcare policy and drug pricing debates often push investors toward or away from large-cap drug makers as a group. For Lilly specifically, recurring themes like obesity drug data, regulatory milestones and capital spending plans tend to surface in this stretch, which may help explain why the LLY seasonal trend has been so consistently favorable in prior midterm cycles.
What is driving Lilly (Eli) (LLY) today?
Lilly (Eli) closed Thursday at 1,209.00, down 11.28 points on the day, leaving the stock about 3.2% below its 52-week high of 1,249.45 on heavy trading volume of roughly 1.9 million shares. The pullback comes just days after the company reported Q1 2026 revenue of $19.8 billion, up 56% year over year, with non-GAAP EPS jumping 156% and full-year guidance raised to $82.0 billion to $85.0 billion in sales and $35.50 to $37.00 in EPS, driven largely by explosive GLP-1 demand for Mounjaro and Zepbound.[1][13]
Lilly’s GLP-1 obesity franchise remains the core of the story, with recent coverage highlighting how the company is pulling ahead of Novo Nordisk in key segments of the $100 billion obesity market and commanding a premium valuation as a result.[1][4] On Aug 12, regulators in the U.K. cleared Foundayo, Lilly’s once-daily oral weight-loss pill, giving the company its first approval for the treatment outside the U.S. and setting up a new front in the obesity-drug race, even as reimbursement decisions from NICE will determine how quickly the pill reaches NHS patients.[2]
Competitive and legal tensions are rising alongside that growth. Novo Nordisk’s CEO publicly defended a lawsuit against Lilly on Aug 12, arguing that “competition has to be fair” as the two companies battle for share in injectables and prepare for a wave of oral obesity drugs.[7] At the same time, Lilly is suing pharmacies and peptide vendors over unauthorized sales of its next big weight-loss candidate, retatrutide, while preparing to file the drug with U.S. regulators early next year, with an FDA decision expected in 2027 or early 2028.[3][6]
Policy and manufacturing strategy are another layer. Coverage this week underscored how U.S. efforts to encourage domestic drug manufacturing play to Lilly’s strengths, given more than $55 billion in U.S. capital expansion commitments since 2020 that position the company as a key onshore supplier of advanced therapies.[5] That backdrop helps explain why short interest sits at roughly 1.15% of float, a low level that signals limited outright bearish positioning despite the stock’s rich multiple and recent run.[13]
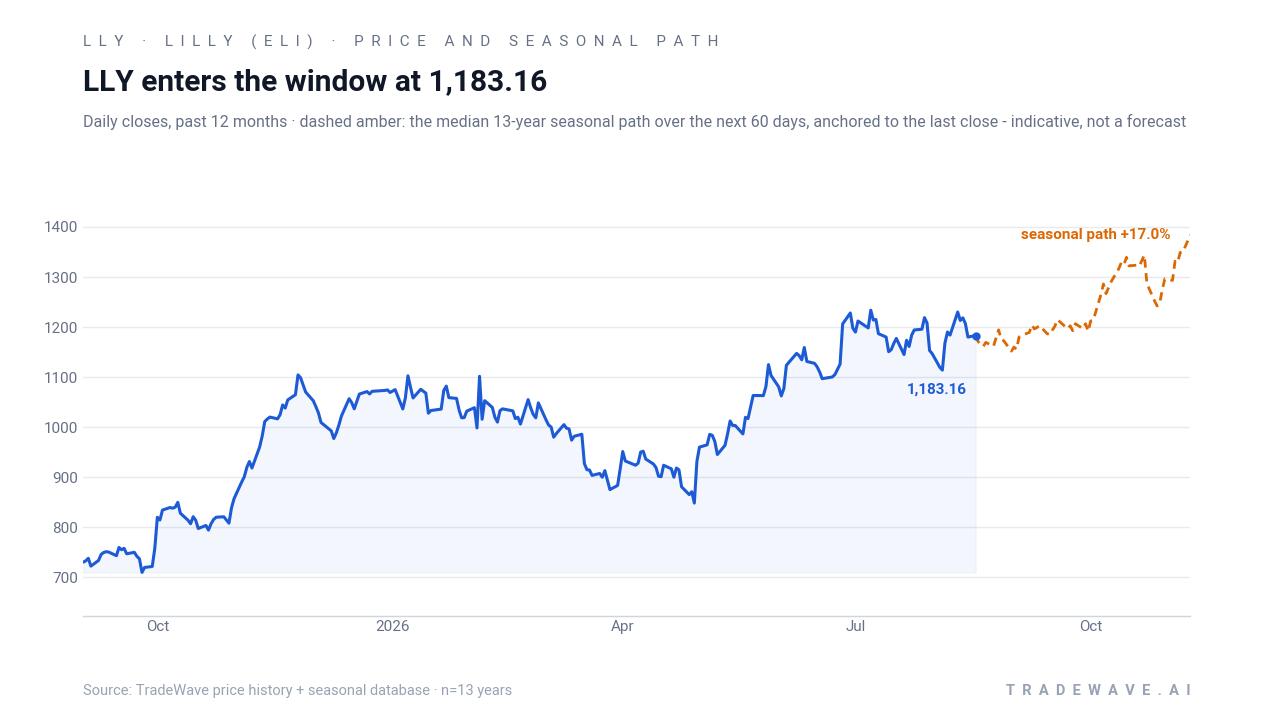
The chart below situates the latest move in its recent multi-month context and overlays the median 60-day seasonal path.
What should traders watch as this seasonal window approaches?
First, the calendar. The next iteration of this 238-day window opens on Aug 31, placing it squarely in the back half of the midterm election year and running deep into the year before the presidential election, when risk appetite for growth and healthcare has often improved. How Lilly behaves into and through that date will show whether the historical LLY seasonal trend is still in play or if the stock’s recent surge has already pulled forward some of that typical strength.
Second, watch how earnings and guidance evolve against that backdrop. The raised 2026 outlook sets a high bar, and any signs that GLP-1 demand, manufacturing ramp or pricing power are diverging from the current narrative could matter more than usual inside a window that has historically rewarded long exposure.[1][13] Strong follow-through on Foundayo launches and clear timelines for retatrutide filings would align with the pattern’s prior tendency to see positive news flow and price drift during this stretch.[2][3][6]
Third, keep an eye on policy and legal headlines. U.S. manufacturing incentives, drug pricing debates and the ongoing legal sparring with Novo Nordisk can all shift sentiment quickly in a midterm election year, especially for a stock that has become a poster child for non-tech innovation.[4][5][7] If volatility around those themes stays contained and pullbacks remain shallow relative to past maximum adverse moves, it would be consistent with how prior cycles have traded inside this window.
Finally, positioning and short interest will be important tells. With short interest currently low, a meaningful build in bearish bets or a spike in hedging activity would signal that investors are starting to push back against the “can’t-miss” narrative just as the historically strong window opens.[13] If, instead, demand for exposure remains steady and dips are quickly bought, traders will be watching to see whether Lilly can extend its 13-for-13 record in this specific midterm-year Aug–Apr stretch.
Sources
- Yahoo Finance: Eli Lilly and Company (LLY) vs. Novo Nordisk A/S (NVO): Is Lilly Pulling Ahead in the $100 Billion Obesity Market? (Aug 12, 2026)
- GuruFocus via Yahoo Finance: Eli Lilly Scores Major Win in Weight-Loss Drug Race (Aug 12, 2026)
- Seeking Alpha: I Underestimated Eli Lilly: Retatrutide Changes The Risk/Reward (Rating Upgrade) (Aug 12, 2026)
- Yahoo Finance: Jim Cramer Highlights Pharmaceutical Giants as Non-Tech Innovation Plays Like JNJ and LLY (Aug 11, 2026)
- Yahoo Finance / Insider Monkey: Eli Lilly vs. Novo Nordisk: Which Company Is Better Positioned for America’s New Drug Manufacturing Policies? (Aug 11, 2026)
- MarketWatch: Eli Lilly is suing pharmacies and peptide vendors over sale of its next big weight-loss drug: retatrutide (Aug 12, 2026)
- CNBC: Novo Nordisk CEO defends lawsuit against Eli Lilly: 'Competition has to be fair' (Aug 12, 2026)
- Yahoo Finance: Eli Lilly (LLY) Posts Blowout Growth And Raises Its Outlook (Aug 10, 2026)
About this seasonal analysis
Seasonal pattern data is sourced from TradeWave.ai, which analyzes historical price behavior across annual calendar windows going back up to 30 years. Read the full data methodology or the book The 100-Year Pattern by Afshin Moshrefi (2026 edition). Past performance of seasonal patterns does not guarantee future results. This article is for informational purposes only and does not constitute investment advice.