Thermo Fisher Scientific (TMO) Has Risen in 10 of 10 Midterm Windows, Averaging 30% Gains
Thermo Fisher Scientific is approaching a 310-day midterm-election-year seasonal window with a perfect win record, just as the stock cools after a powerful post-earnings run.
Price as of Aug 14, 2026: $588.29 (last close).

What is the seasonal pattern for Thermo Fisher Scientific (TMO)?
Thermo Fisher Scientific has risen in 10 of 10 midterm-election-year windows starting around Sep 16, with an average gain of 30.02% in winning years.
- 10 for 10 in this window, with Thermo Fisher Scientific averaging 30.02% gains across all winning years.
- Seasonal window runs roughly Sep 16 through Jul 22, spanning 310 days in the midterm election year into the pre-election year.
- Percent Profitable is 100%, with 10 winners and 0 losers across the last 10 midterm-election-year cycles.
- Average winner gain of about 30% stacks to a 1,180% cumulative return when the window is repeated across all 10 cycles.
- TradeWave Ratio of 1.69 suggests price has typically traveled meaningfully in the long direction within the window, beyond just the final close.
- Sharpe ratio of 1.6 points to a historically strong risk-adjusted profile for this specific Thermo Fisher Scientific trading window.
According to historical data from TradeWave.ai, this midterm-election-year stretch has behaved very differently from an average year for Thermo Fisher Scientific, and the next iteration is less than a month away.
How has Thermo Fisher Scientific (TMO) traded in this midterm-year window?
Thermo Fisher Scientific has closed higher in every one of the last 10 midterm-election-year windows starting around Sep 16, averaging a 30.02% gain over 310 days. Shares finished Monday at $588.29, down 1.3% on the day and consolidating below a 52-week high of about $641.43 after a sharp post-earnings rally.[1] Multiple recent filings also show modest insider selling by Chief Operating Officer Gianluca Pettiti in late July, a signal some investors watch for sentiment shifts after strong runs.[13]
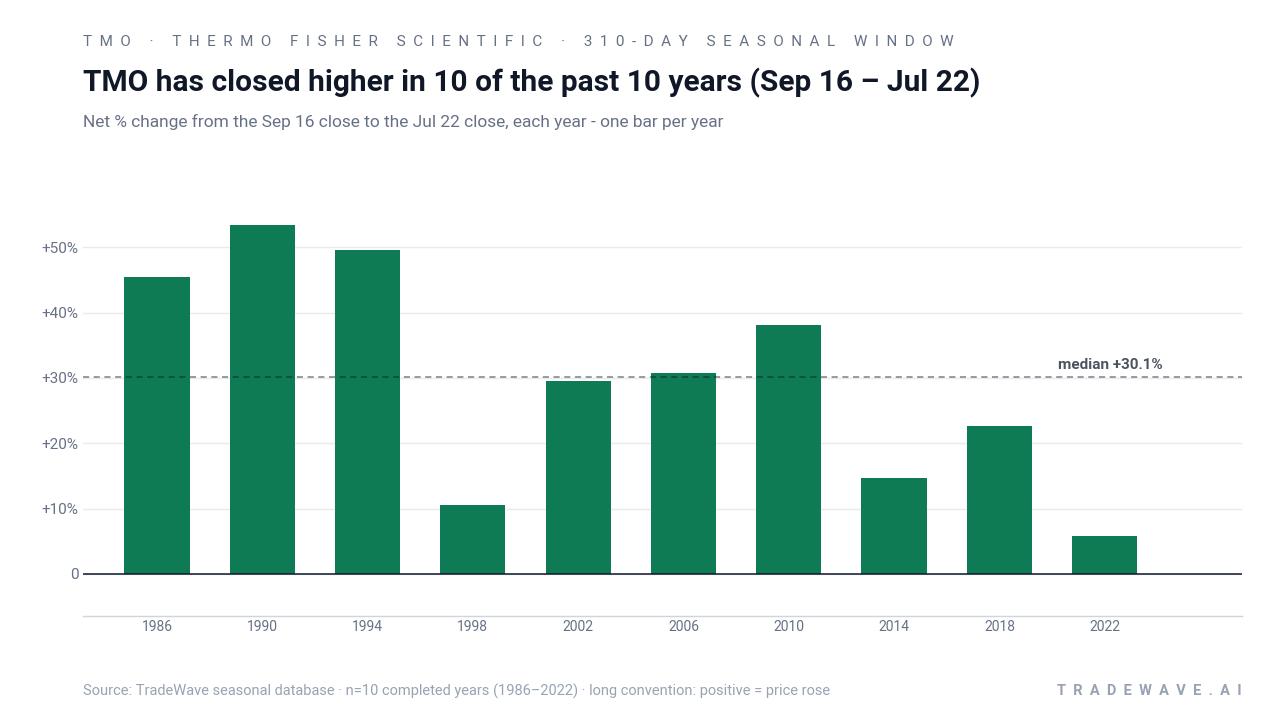
Grouping the data by the presidential election cycle matters here because this window always starts in a midterm election year and runs deep into the year before the presidential election, a phase that has often coincided with clearer policy visibility and stronger risk appetite across equities. For Thermo Fisher Scientific, that election-cycle filter isolates 10 prior midterm years where the same Sep 16 to Jul 22 slice of the calendar produced gains every time, even when the broader market backdrop varied.
The trade direction for this pattern is long, and the track record is unusually clean. Percent Profitable is 100%, with 10 winners and 0 losers, and the average profit across those winning years is 30.02%. The median outcome is similar at 30.12%, which tells you the distribution is not being skewed by a single outlier year.
Individual years still show a wide range of outcomes. The strongest midterm-year window in this sample was 1990, when Thermo Fisher Scientific gained 53.37% between the Sep 16 entry and the Jul 22 exit, after reaching a maximum favorable move of 65.8% at the best point in the window. The softest year was 2022, which still finished up 5.78% but saw a best intraperiod gain of 12.73% and a worst drawdown of 12.1% from the entry level.
The maximum favorable move, or best run-up from entry within the window, has ranged from 12.73% to 75.25% across the 10 cycles. The maximum adverse move, or worst drawdown from entry, has ranged from less than 1% to about 25.09%. That mix points to a window where upside has historically dominated by the finish, but where double-digit pullbacks inside the path have been common in several years.
Trend metrics back up the idea of a persistent upward bias. The long-trend score of 61 versus a short-trend score of 6, and an even stronger 74 versus 0 on a shorter-horizon trend view, indicate that in most years the stock has spent the bulk of this 310-day stretch grinding higher rather than chopping sideways. The Sharpe ratio of 1.6, based on end-of-window outcomes, is high for a single-stock seasonal pattern and reflects that the average 30% gain has come with volatility that, while real, has been compensated by returns.
The cumulative return chart shows how those individual windows stack when compounded. Repeating the Sep 16 to Jul 22 trade across the 10 midterm-election-year samples would have produced a cumulative gain of 1,180%, with no interruptions from losing years. Add it up: this is one of the cleaner long-biased seasonal regimes in the healthcare equipment space over the last four decades.
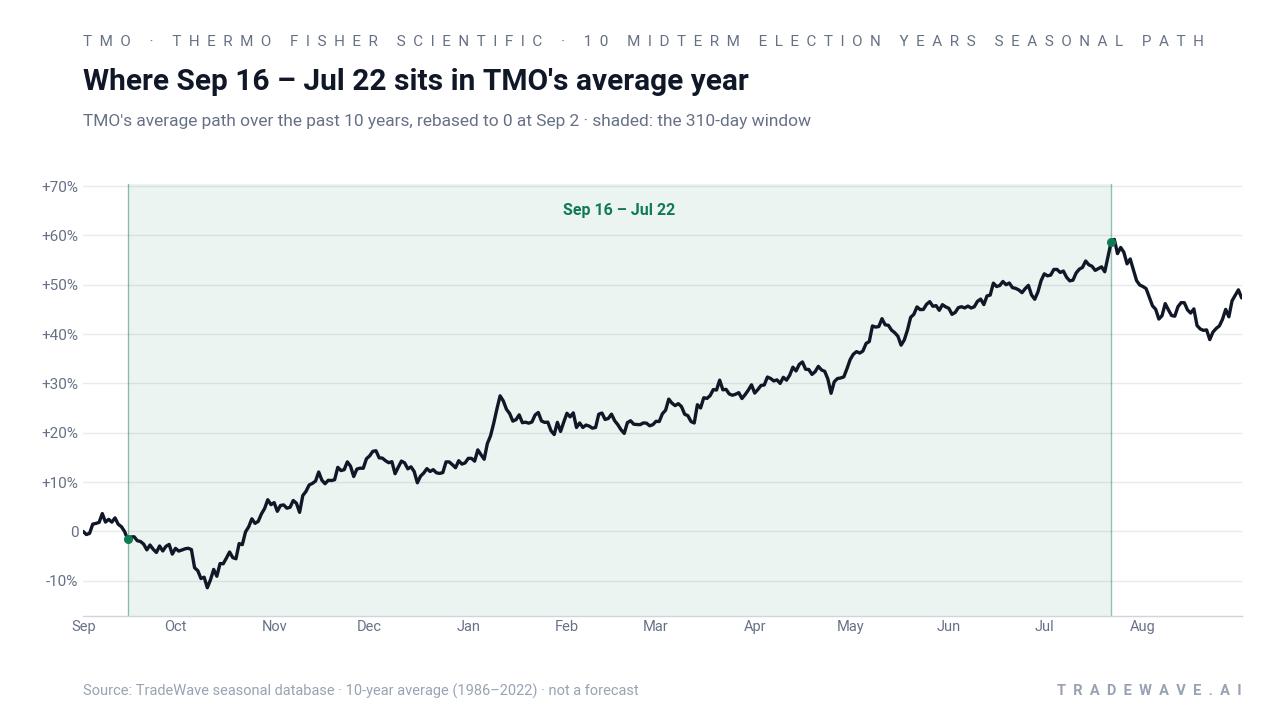
The next chart shows how each year’s net result lines up with its best and worst intraperiod swings.
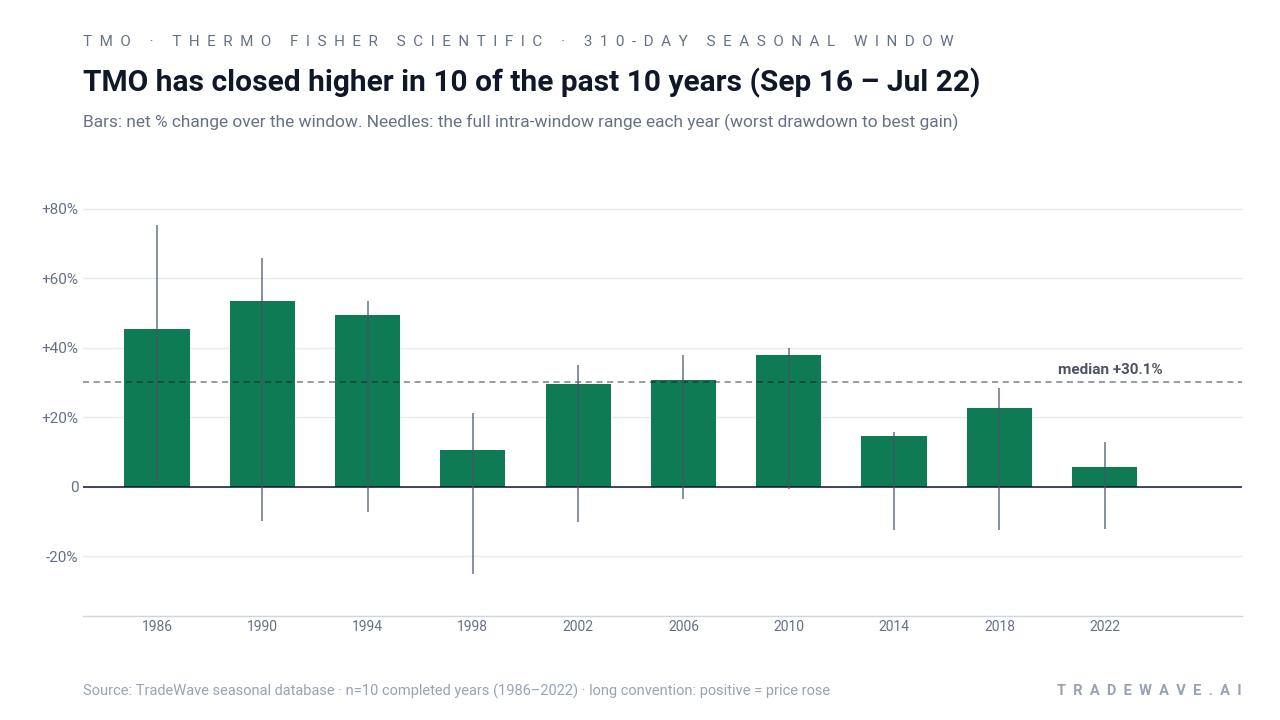
The stacked net, best-case and worst-case bars underline the key message: every bar ends above zero, but the needles show that several years included 10% to 25% drawdowns on the way to strong finishes. History does not guarantee future results; adverse excursions can be large even in winning windows.
Why does Thermo Fisher Scientific (TMO) follow this seasonal pattern?
One likely driver is the way Thermo Fisher’s earnings and capital spending cycles line up with the broader policy and funding backdrop in midterm and pre-election years. Analysts have pointed to a recovery in pharmaceutical and biotechnology research spending as a key tailwind, and those budgets often get clearer as Washington’s fiscal stance and regulation path settle after the midterms.[10] The pattern may also reflect institutional portfolio repositioning into high-quality healthcare equipment names as visibility on the next presidential election year improves.
What is driving Thermo Fisher Scientific (TMO) today?
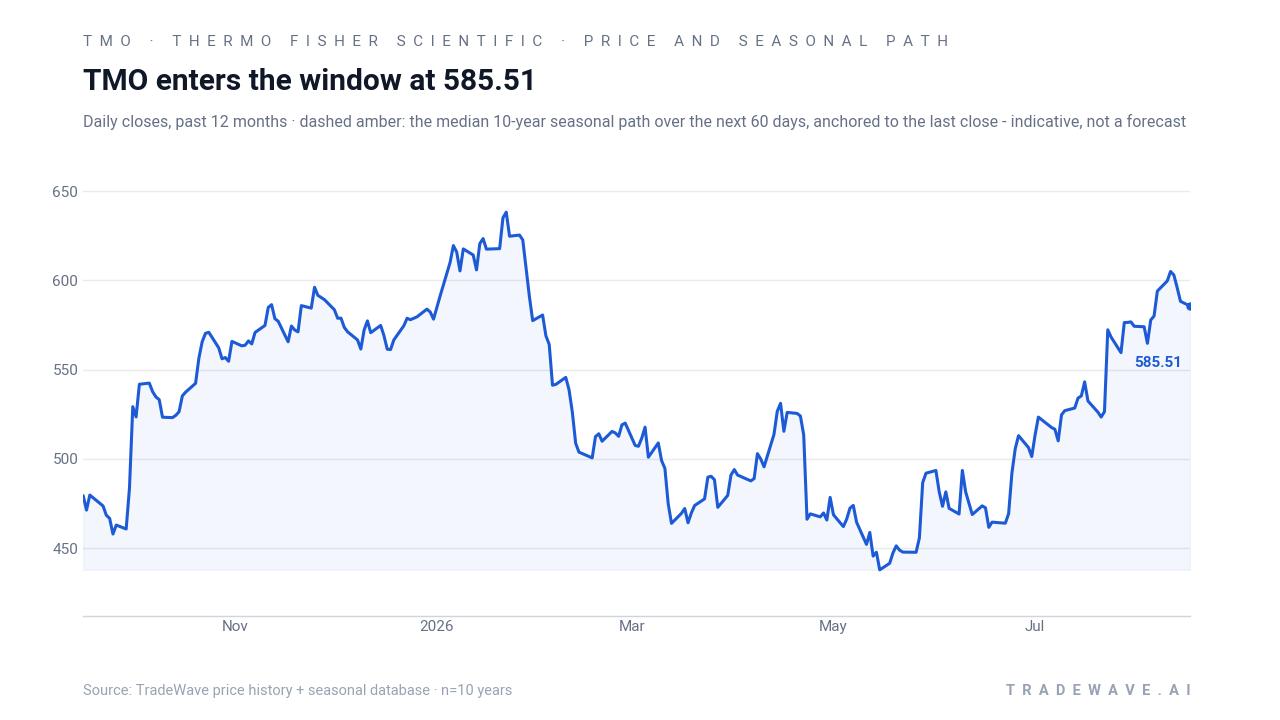
Thermo Fisher Scientific slipped 1.3% Monday to $588.29, easing back from a 52-week high near $641.43 but still well above its 50-day moving average around $528.66 and its recent 52-week low near $434.40.[1] The stock is digesting a powerful move that began on Jul 27, when Thermo Fisher reported adjusted Q2 earnings of $5.36 per share on $10.85 billion in revenue, topping estimates and prompting a guidance raise that sent the shares up about 8.7% in a single session.[4][6]
The earnings beat and higher full-year outlook reinforced the story that Thermo Fisher is a prime way to play a recovery in pharmaceutical and biotech research spending, as labs refresh equipment and expand capacity.[6][10] Analysts covering the stock, aggregated by MarketBeat, keep a “Moderate Buy” stance, and the company screens well on sector rankings, sitting near the top of the healthcare equipment and services group with a valuation multiple below the sector average.[1][9]
Flows around the name have been active on both sides. On Aug 12, Annex Advisory Services disclosed buying 2,756 shares, part of a broader pattern of institutional interest in the stock this summer.[10] At the same time, MarketBeat’s filings recap show that insiders, including COO Gianluca Pettiti, have sold roughly $226,000 worth of stock over the past three months, with Pettiti’s latest 400-share sale reported around late July at average prices of $565.00 and $462.66.[13][14] Insider ownership remains low at about 0.33%, so these transactions are small in the context of Thermo Fisher’s market value, but they give traders another data point as the stock trades near record territory.
From a macro and policy angle, Thermo Fisher sits at the intersection of healthcare, life sciences and industrial technology, sectors that tend to benefit when research budgets and capital spending are expanding. MarketBeat’s recent commentary on the name and its peers highlights how investors are weighing valuation against exposure to a potential multi-year upcycle in R&D spending, particularly if funding conditions stay supportive into the year before the presidential election.[1][10] That backdrop makes the upcoming midterm-to-pre-election seasonal window more than just a calendar quirk; it lines up with a phase when policy uncertainty often fades and risk appetite in quality growth names has historically improved.
The chart below situates the latest pullback against the past year’s rally and the indicative seasonal path.
What should traders watch as this seasonal window approaches?
The next key date on the calendar is Sep 16, when the 310-day midterm-election-year window begins and runs through late July of the pre-election year. Historically, the strongest years have seen Thermo Fisher start building gains relatively early in the window, while weaker years like 2022 still finished positive but with more pronounced mid-window drawdowns. Traders watching the TMO seasonal trend will be looking to see whether the stock respects that pattern by stabilizing and turning higher into the fall, or whether a deeper pullback breaks the historical script.
On the fundamental side, any updates on research spending from large pharma and biotech customers, along with Thermo Fisher’s next earnings commentary, will be critical for confirming whether the macro backdrop that supported prior midterm-year rallies is still in place.[5][6][10] Price-wise, the band between the 50-day moving average near $528.66 and the recent 52-week high around $641.43 is likely to be the key range: holding above the moving average into the window would be consistent with past strong cycles, while a sustained break below it would be a first sign that this time could look different.[1]
Finally, the insider and institutional activity bears watching. If insider selling slows and institutional buying like the Annex Advisory purchase continues or accelerates as the window opens, that would align with the historical long bias in this period.[10][13][14] A reversal, with heavier insider sales or visible fund outflows, would be a sign that the current cycle may not track the 10-for-10 record as closely, even if the long-term Thermo Fisher Scientific seasonal trend in midterm years remains one of the strongest on the calendar.
Sources
- MarketBeat, “Thermo Fisher Scientific (TMO) Stock Price, News & Analysis” (Aug 7, 2026).
- Yahoo Finance, “Thermo Fisher (TMO) Climbs 8.7% on Solid Earnings, Price Target Upgrades” (Jul 27, 2026).
- Yahoo Finance (Zacks), “Exploring Analyst Estimates for Thermo Fisher (TMO) Q2 Earnings, Beyond Revenue and EPS” (Jul 20, 2026).
- Yahoo Finance, “Why Is Thermo Fisher (TMO) Stock Rocketing Higher Today” (Jul 27, 2026).
- MarketBeat, “Balefire LLC Sells 2,144 Shares of Thermo Fisher Scientific Inc. $TMO” (Aug 6, 2026).
- MarketBeat, “Aristotle Atlantic Partners LLC Sells 2,566 Shares of Thermo Fisher Scientific Inc. $TMO” (Jul 26, 2026).
- MarketBeat, “Annex Advisory Services LLC Buys 2,756 Shares of Thermo Fisher Scientific Inc. $TMO” (Aug 12, 2026).
About this seasonal analysis
Seasonal pattern data is sourced from TradeWave.ai, which analyzes historical price behavior across annual calendar windows going back up to 30 years. Read the full data methodology or the book The 100-Year Pattern by Afshin Moshrefi (2026 edition). Past performance of seasonal patterns does not guarantee future results. This article is for informational purposes only and does not constitute investment advice.