Near 52-Week Highs, Target Corporation (TGT) Enters a 100% Win Late-Summer Midterm Window
Target Corporation is trading near 52-week highs ahead of earnings as a historically bullish Aug 30–Sep 10 seasonal window approaches in this midterm election year.
Price as of Aug 11, 2026: $152.29 (last close).

What is the seasonal pattern for Target Corporation (TGT)?
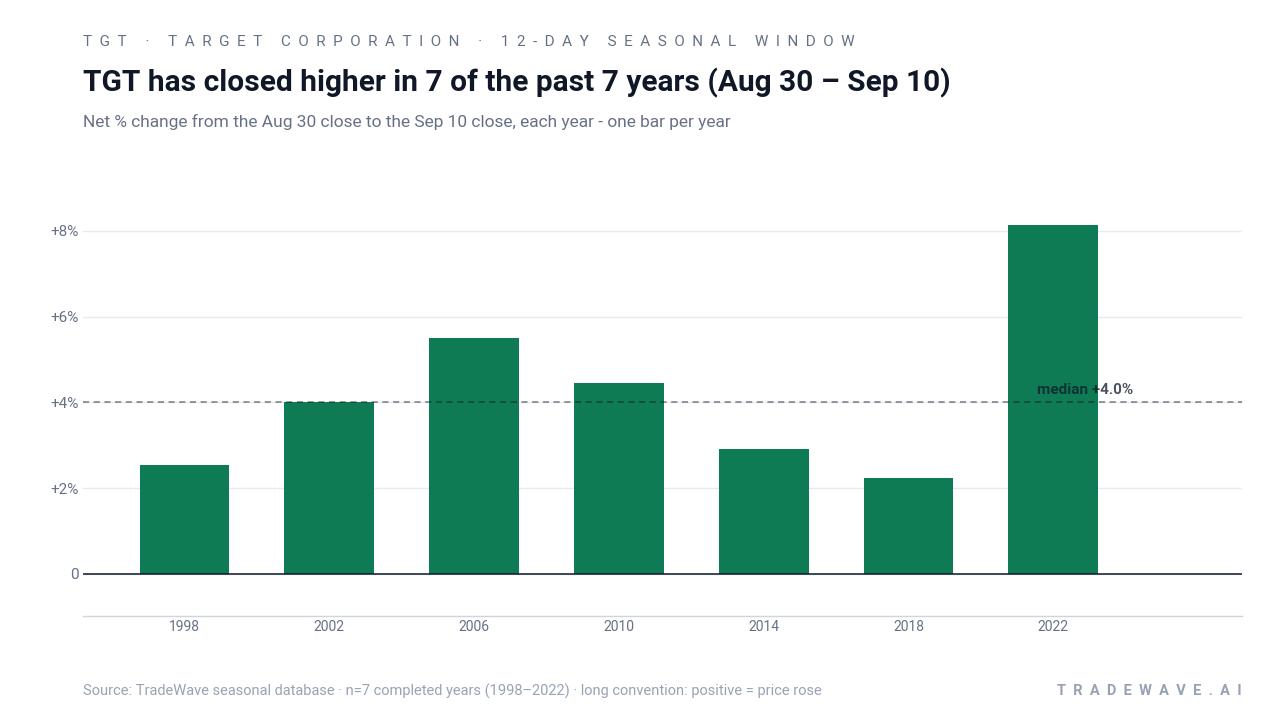
Target Corporation has risen in 7 of 7 midterm-year Aug 30–Sep 10 windows, with an average gain of 4.26% in winning years.
- 7 for 7 in this window, with Target averaging 4.26% gains across winning years from Aug 30 to Sep 10.
- Percent Profitable is 100%, with 7 winners and 0 losers across the last 7 midterm election years in this slice of the calendar.
- The trade direction is long, aligning the TGT seasonal trend with upside moves during this late-summer retail window.
- The TradeWave Ratio is 1.44, indicating price has typically traveled meaningfully in the trade direction within the 12-day span.
- The Sharpe ratio of 2.01 points to a historically strong risk-adjusted profile for this specific trading window.
- Intraperiod swings have included both sharp rallies and notable drawdowns, so timing and risk controls still matter even in a clean win streak.
According to historical data from TradeWave.ai, this late-August stretch has behaved very differently for Target in midterm election years than an average month on the calendar.
How has Target Corporation (TGT) traded in the late-August midterm-year window?
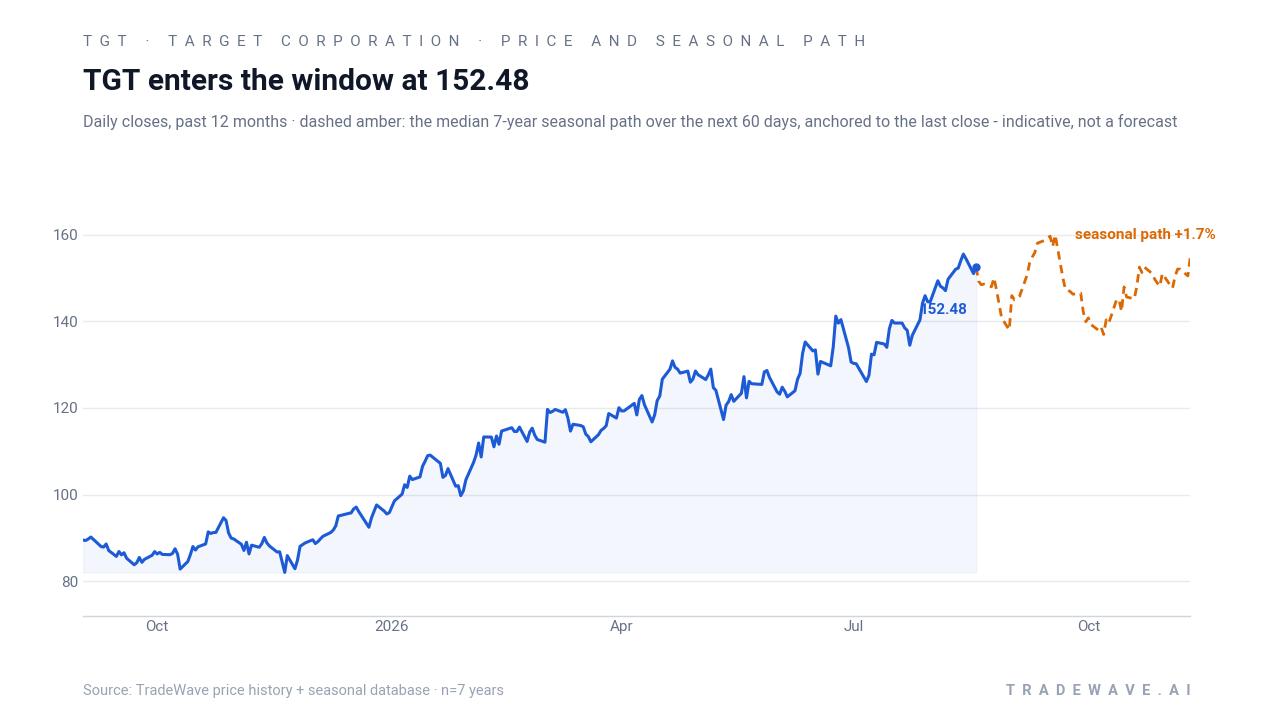
Target Corporation has risen in every single Aug 30 to Sep 10 window across the last seven midterm election years, averaging a 4.26% gain for long positions. Shares finished Wednesday at 152.29, up 0.18% on the day and sitting just about 1.7% below their 52-week high of 154.87. That puts a historically strong TGT seasonal trend on a collision course with a stock already pressing the top of its one-year range.
Grouping the data by the presidential election cycle matters here because consumer and policy backdrops tend to rhyme from one midterm year to the next. Retailers like Target often feel the impact of shifting fiscal debates, regulatory noise and Fed policy expectations in the middle of a presidential term, so a midterm-year seasonal pattern can capture behavior that a simple calendar-year average would miss.
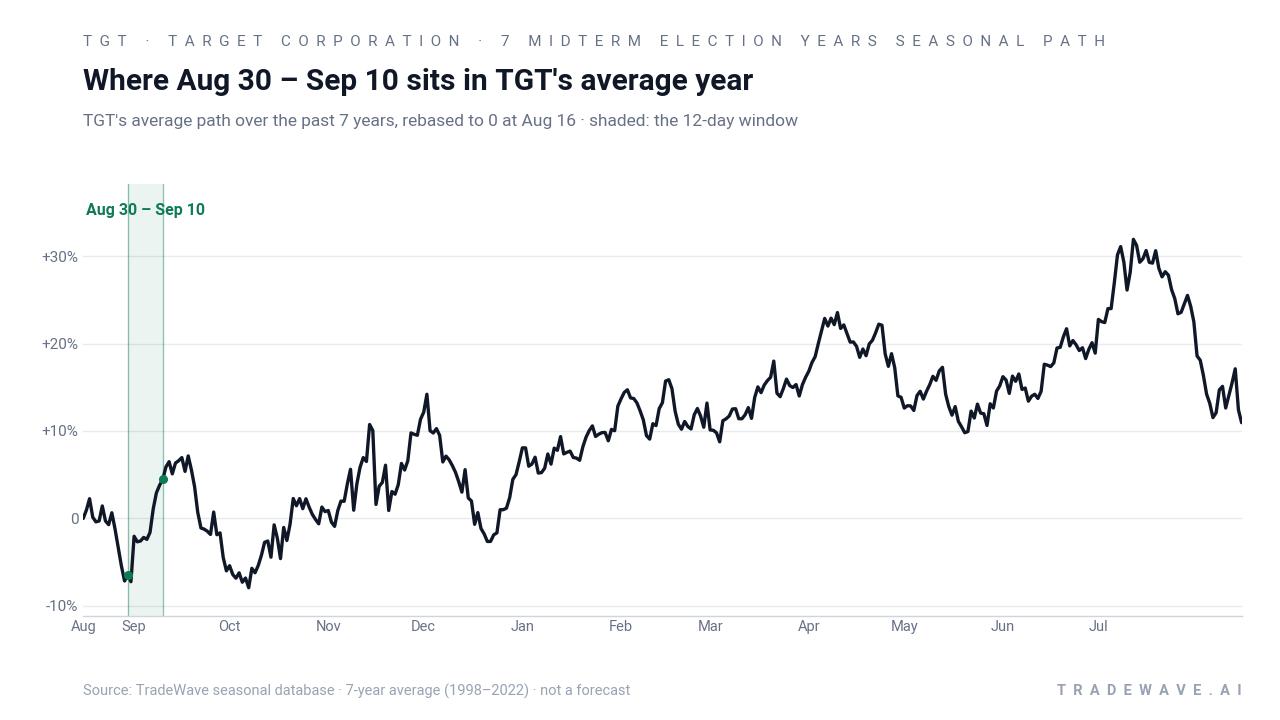
Year-by-year ranges show how much TGT has typically swung inside the window before finishing higher.
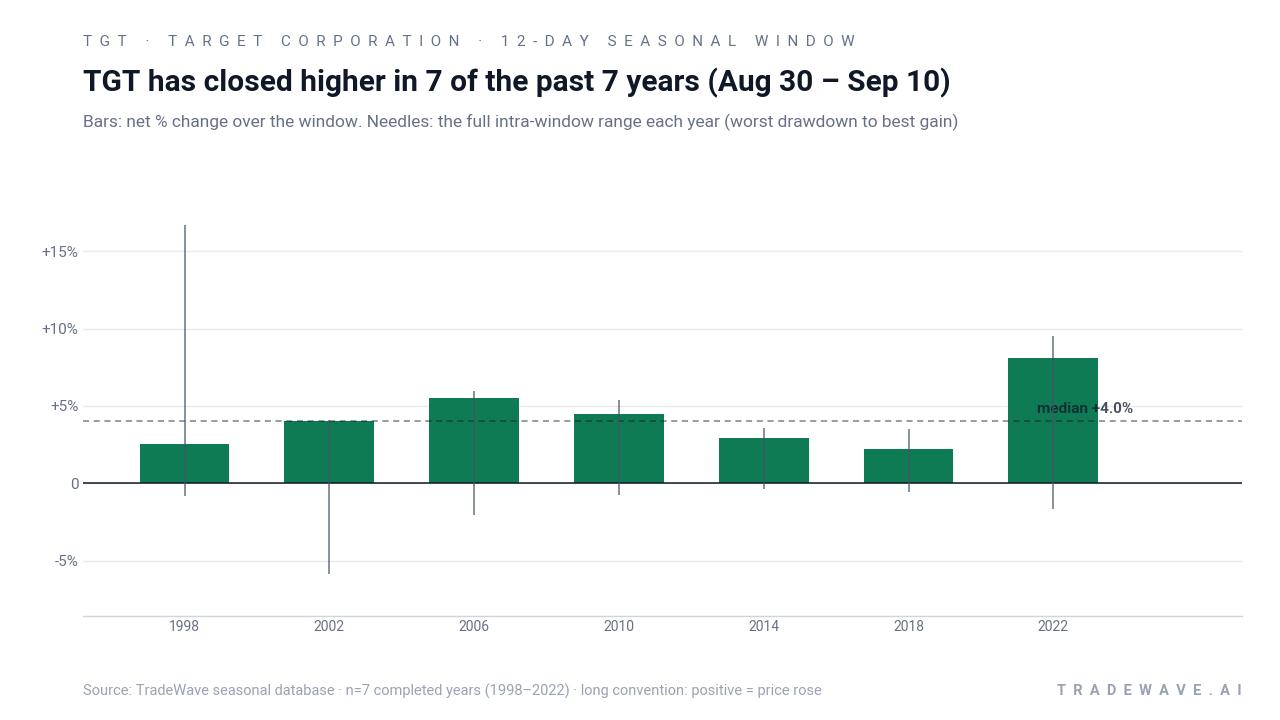
Across the seven midterm-year samples, the strongest late-summer run came in 2022, when TGT gained 8.13% from Aug 30 to Sep 10 and at one point was up 9.55% from the entry before giving back a bit into the close. The softest outcome was still positive: a 2.23% gain in 2018, with a maximum favorable move of 3.53% and only a shallow 0.58% intraperiod drawdown. The worst adverse move in any year was a 5.85% dip in 2002 before the stock recovered to finish the window up 4.01%, a reminder that even a clean win streak has required sitting through some volatility.
The cumulative chart of this Target Corporation trading window shows how those individual slices stack up. Compounding the Aug 30–Sep 10 results across the seven midterm election years produces a 33% cumulative gain, which is unusually strong for a 12-day seasonal regime. Add it up: seven short windows, all positive, and a third more value for a long-only approach that only shows up in this specific election-cycle slice.
For a long trade direction, that combination of 100% Percent Profitable, 4.26% average profit and a 2.01 Sharpe ratio is rare in a single stock pattern analysis. The TradeWave Ratio of 1.44 suggests that within the window, price has typically moved a meaningful distance in the trade direction, not just drifted higher by a few basis points. The MFE and MAE profile shows that while upside spikes have often been larger than the worst drawdowns, the path has not been a straight line, especially in years like 2002 where the stock first sank before snapping back.
History does not guarantee future results; adverse excursions can still be large even in winning windows, and a 12-day pattern is no substitute for a full risk plan.
Why does Target Corporation (TGT) follow this seasonal pattern?
This midterm-year late-August pattern may reflect a mix of back-to-school spending, early holiday inventory positioning and institutional portfolio tweaks ahead of the pre-election year. One likely driver is that Target’s fiscal calendar and guidance cadence often put investors’ focus on the second-half demand picture around this time, which can support a retail sector seasonal outlook when macro fears ease. Analysts have also pointed to midterm-year policy uncertainty giving way to a more constructive risk tone into the pre-election year, which can favor value-leaning consumer names like Target.
What is driving Target Corporation (TGT) today?
Target shares closed at 152.29 on Wednesday, up 0.27 points or 0.18% on the day, after trading between 150.46 and 154.89 on volume of about 4.0 million shares. That leaves the stock about 1.7% below its 52-week high of 154.87 and well above its 52-week low near 80.04, capping a roughly 13.65% gain over the past month as investors lean into a 2026 turnaround story.[5]
The fundamental backdrop has improved since management laid out an optimistic 2026 plan and delivered a Q4 2025 earnings beat with upbeat guidance in early March, which MarketBeat reported helped reset sentiment after a tougher stretch.[5] Q1 2026 results in May showed revenue up 6.7% year over year, nearly 30% growth in adjusted operating income and roughly 31.5% growth in adjusted EPS, but analysts have largely kept a “Hold” stance and a MarketBeat consensus price target of 136.89 that now sits below the market price and reflects an earlier valuation regime.[7] Several institutional holders, including Dimensional Fund Advisors and Callodine Capital Management, have added to positions in recent months, while others such as Glenview Trust and First Trust Advisors have trimmed exposure, underscoring a two-way debate around how far the recovery can run from here.[2][3][4][9]
On the positioning side, ChartMill data from late July showed a short float of 4.44% and days to cover at 4.06, a moderate level that can add fuel in either direction if volatility picks up around earnings or macro headlines.[8] MarketBeat has also highlighted that Target trades at roughly 16 times current-year earnings versus some peers above 40 times, a valuation gap that supports a value case but also reflects lingering skepticism about margin durability and traffic trends.[5] With the next earnings report scheduled for Aug 19, this mix of improving fundamentals, cautious analyst posture and active institutional reshuffling sets the stage for how the upcoming seasonal window could interact with fresh information.
The chart below situates the latest move in its recent multi-month context alongside the historical seasonal projection.
What should traders watch in the upcoming Aug 30–Sep 10 window?
The first marker is the earnings report on Aug 19, which lands just ahead of the seasonal window and will shape how investors interpret any late-August strength or weakness. If Target can sustain its recent revenue and EPS momentum while keeping guidance intact, a constructive reaction into the 12-day window would line up with the historical seasonality; a sharp disappointment would test how resilient the pattern really is.[5][7]
Price levels matter too. The 150 to 155 band has become a key zone as TGT flirts with its 52-week high, and how the stock behaves around that range into the end of August will signal whether buyers are still willing to pay up. A clean push through the prior high with controlled intraday swings would rhyme with the historical pattern of steady gains, while repeated failures or heavy reversals from that area would mark a break from the usual TGT seasonal trend.
Traders should also keep an eye on short interest and institutional flows. If the 4.44% short float and 4.06 days to cover begin to climb while large holders trim positions, that would suggest growing skepticism into the window and could amplify any downside moves even in a historically bullish stretch.[2][3][4][8][9] Conversely, stable or falling short interest alongside continued buying from long-only funds would support the idea that this midterm-year late-summer window is once again aligning with a constructive consumer retail recovery narrative.
Finally, behavior inside the window itself will be telling. A familiar pattern of early drawdowns followed by strong recoveries, as seen in 2002, would fit the historical MFE/MAE profile and keep the TGT seasonal trend intact. A clean, low-volatility grind higher would mark an even stronger iteration of the pattern, while a decisive break lower that fails to recover by Sep 10 would be the first real outlier in this seven-sample history and a sign that the midterm-year playbook for Target may be changing.
Sources
- MarketBeat: Swiss National Bank Has $161.06 Million Stake in Target Corporation TGT (Jul 20, 2026)
- MarketBeat: Glenview Trust Co Trims Stock Position in Target Corporation TGT (Jul 21, 2026)
- MarketBeat: First Trust Advisors LP Reduces Stock Holdings in Target Corporation TGT (Jul 24, 2026)
- MarketBeat: Dimensional Fund Advisors LP Boosts Stock Holdings in Target Corporation TGT (Jul 20, 2026)
- MarketBeat: TGT Stock Jumps on Q4 Earnings Beat and 2026 Guidance (Mar 4, 2026)
- Finviz: Analysts Estimate Target (TGT) to Report a Decline in Earnings (Feb 24, 2026)
- MarketBeat: TGT Stock – Analysts Unmoved by Target's Q1 Beat and Raised Guidance (May 21, 2026)
- ChartMill: TGT Fundamental Analysis & Valuation | Fair Value & Financial Strength (Jul 30, 2026)
- MarketBeat: Callodine Capital Management LP Raises Stock Holdings in Target Corporation TGT (Jul 26, 2026)
- MarketBeat: Target Corporation TGT Shares Sold by KBC Group NV (Jul 22, 2026)
About this seasonal analysis
Seasonal pattern data is sourced from TradeWave.ai, which analyzes historical price behavior across annual calendar windows going back up to 30 years. Read the full data methodology or the book The 100-Year Pattern by Afshin Moshrefi (2026 edition). Past performance of seasonal patterns does not guarantee future results. This article is for informational purposes only and does not constitute investment advice.