Eaton Corporation (ETN) Has Rallied in 10 of 10 Midterm Aug 15-Jun 10 Windows, Averaging 23.3%
Eaton Corporation is approaching a 300-day midterm-election-year seasonal window that has never been negative in the last 10 cycles, just as the stock trades 11.6% below its 52-week high ahead of earnings.
Price as of Jul 28, 2026: $386.26 (last close).

What is the seasonal pattern for Eaton Corporation (ETN)?
Eaton Corporation has risen in 10 of 10 midterm-election-year windows starting Aug 15 and lasting 300 days, with an average gain of 23.3% in winning years.
- 10 for 10 in this window, with Eaton Corporation averaging 23.3% gains in winning years across the last 10 midterm election cycles.
- Percent Profitable is 100%, with 10 winners and 0 losers in the Aug 15 to Jun 10 Eaton Corporation trading window.
- The typical winning year shows a median profit of 25.05%, while the compounded effect across cycles adds up to a 680% cumulative return.
- The TradeWave Ratio of 1.89 indicates that price has historically traveled meaningfully in the long direction within this window, beyond just the final close.
- A Sharpe ratio of 1.74 for this pattern points to strong risk-adjusted returns compared with many stock pattern analyses.
- Intraperiod swings have still been sizable, with some years seeing double-digit drawdowns before finishing higher, underscoring the need to respect volatility.
According to historical data from TradeWave.ai, this upcoming stretch for Eaton Corporation behaves very differently from an average year, especially when viewed through the presidential election cycle lens.
How strong is the upcoming seasonal window for Eaton Corporation (ETN)?
Eaton Corporation has closed higher in every one of the last 10 midterm-election-year windows that start around Aug 15 and run roughly 300 days, averaging 23.3% gains for long positions. Shares finished the prior session at 386.26, down 3.1% on the day and about 11.6% below the 52-week high of 436.74, but still up 21.27% year to date.[3] That mix of a strong year-to-date run, a pullback from the highs and a historically powerful ETN seasonal trend gives this window more weight than a typical calendar quirk.
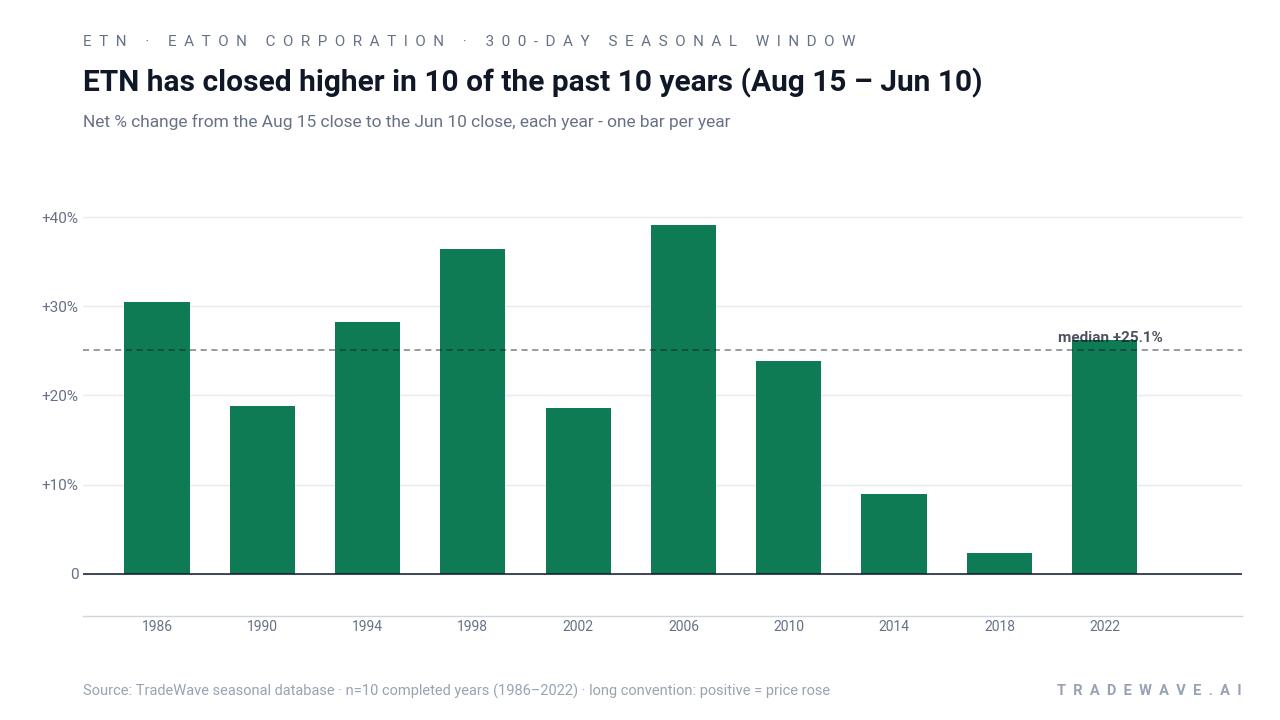
Because this pattern is grouped by the presidential election cycle, it only looks at midterm election years, not every calendar year. That matters for an industrial and electrical name like Eaton, where policy, infrastructure spending and tariff headlines can swing order books and valuations differently in mid-cycle years than in election or pre-election years.[6]
A second view shows how each midterm-year window balanced upside runs with intraperiod drawdowns.
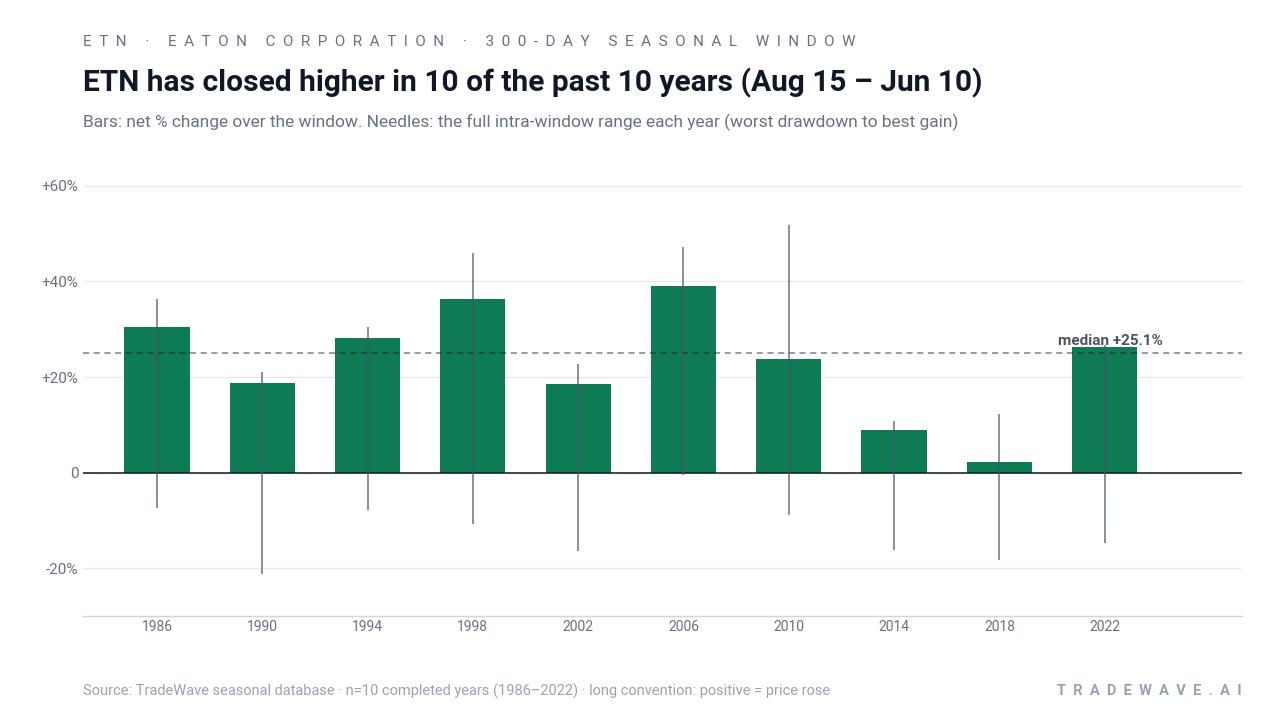
Across the 10 completed midterm-election-year windows, every single one finished positive for a long ETN position, with the strongest net gain of 39.07% in 2006 and the softest at 2.31% in 2018. The average winner gained 23.3%, while the median outcome of 25.05% shows that results have skewed toward solid double-digit advances rather than a few outliers carrying the series. Stacking those windows compounds to a 680% cumulative return, which is unusually high for a single recurring slice of the calendar.
The intraperiod profile is more volatile than the clean win-loss record suggests. Maximum favorable moves have reached as high as 51.72% in 2010, while maximum adverse moves have run as deep as a 21.15% drawdown in 1990 before the stock recovered to finish the window higher. Several years, including 2014 and 2018, saw mid-teens pullbacks inside the window even though the final net result was positive, which is exactly what the TradeWave Ratio of 1.89 is flagging: price tends to travel a long way in the trade direction, but not in a straight line.
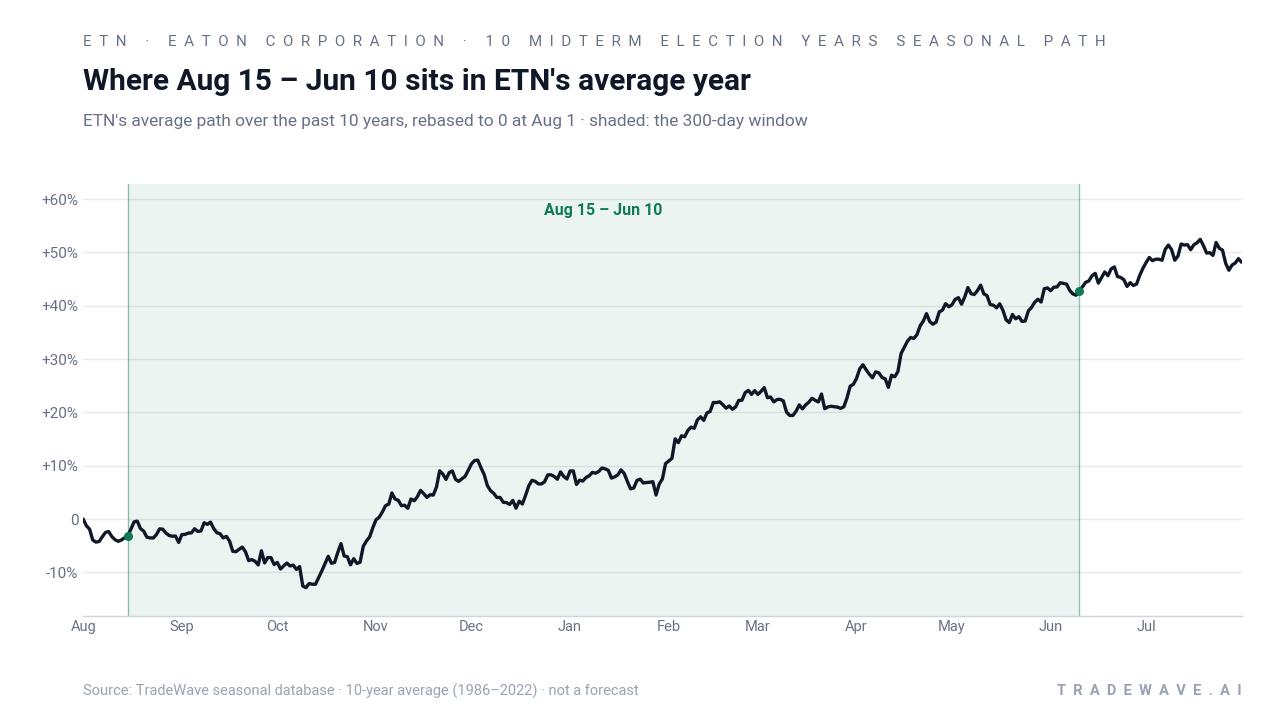
The trend chart shows that, on average, the ETN seasonal trend in this window starts with a modest climb in the early months, then accelerates into the back half of the period as the calendar moves from the midterm election year into the year before the presidential election. That timing lines up with the broader pattern many investors know from the S&P 500, where late-midterm into pre-election has historically been one of the strongest stretches for equities. For Eaton, the per-year table suggests that the weakest net outcomes tended to occur when early drawdowns were larger and recoveries took longer to stick.
Put together, the message is simple: in the last 10 midterm election years, this 300-day Eaton Corporation trading window has been 10 for 10 on the long side, with meaningful average gains but also enough intraperiod downside to punish anyone who forgets how choppy the ride can be.
Why does Eaton Corporation (ETN) follow this seasonal pattern?
One likely driver is the way infrastructure and industrial spending tends to ramp after midterm elections, as new budgets, grid projects and data center investments move from policy talk to purchase orders.[4] Analysts have also pointed to Eaton’s earnings calendar, where strong electrical demand from data centers, utilities and AI-related infrastructure has recently clustered around this part of the year, reinforcing the historical seasonality.[4] The pattern may also reflect institutional portfolio rotation into quality industrials as visibility on regulation and tariffs improves in the back half of the presidential cycle.[6]
History does not guarantee future results; even in a 100% winning window, adverse excursions can be large and timing mistakes can be costly.
What is driving Eaton Corporation (ETN) today?
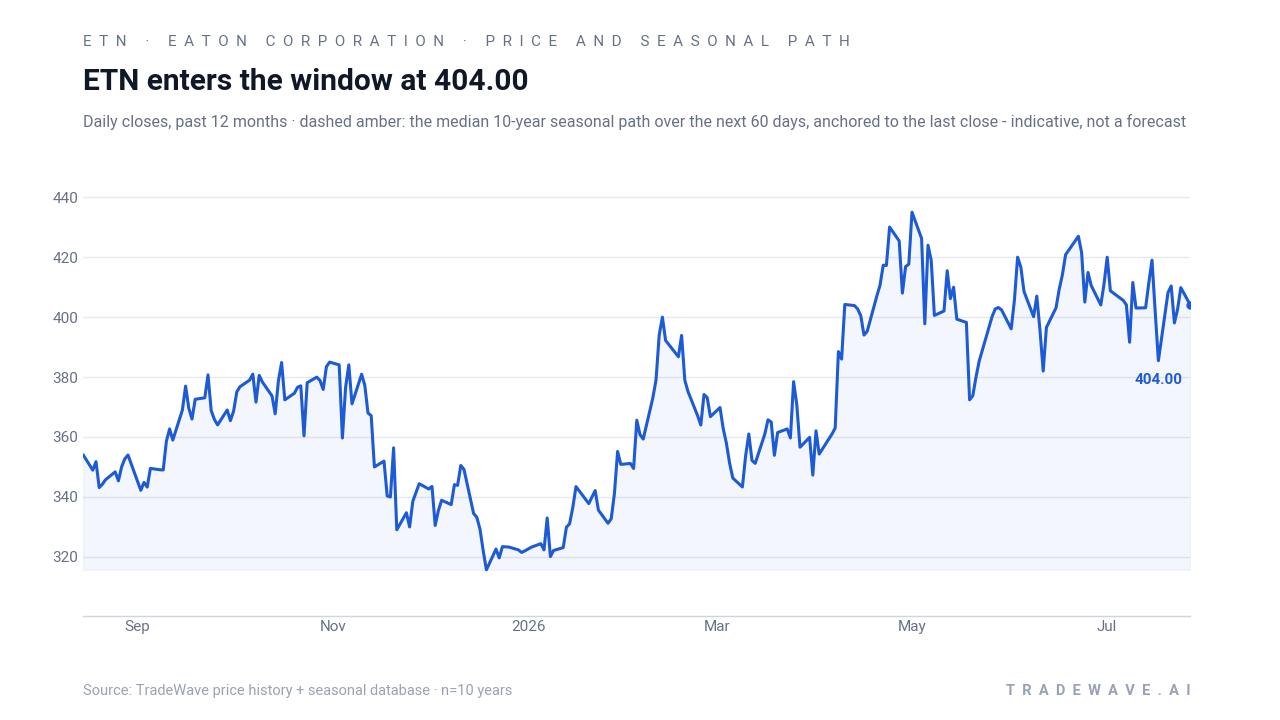
Eaton Corporation shares closed at 386.26 in the prior session, down 3.1% on the day, leaving the stock about 11.6% below its 52-week high of 436.74 but still up 21.27% year to date.[3] The pullback comes just ahead of the company’s next earnings report, scheduled for Jul 31, 2026, where Zacks expects quarterly EPS of $3.08, a 4.41% increase from a year earlier.[5] In Q1 2026, Eaton delivered net sales of $7.45 billion, up 16.8% year over year, and adjusted EPS of $2.81, helped by strong demand in its electrical businesses tied to data centers, utilities and AI-related infrastructure.[4] Street research characterizes the stock as a “Moderate Buy,” with a consensus price target around $449.38 from Barchart’s aggregated analyst data, implying upside from current levels if those targets prove durable.[2],[4]
In the background, Eaton has already been a notable outperformer versus both the S&P 500 and the industrials sector over the past year, helped by its positioning in power management, grid modernization and AI-related infrastructure themes.[4] Some investors remain sensitive to policy risk after Trump-era tariffs were cited as a headwind to sentiment in 2025 coverage, but the current focus is squarely on whether the upcoming earnings print can sustain double-digit revenue growth while margins hold up.[6] Earlier in 2026, the company guided to full-year adjusted EPS of $13.00 to $13.50, and analysts now cluster around $13.31 to $13.33, setting a relatively tight bar for execution.[1],[4]
The chart below situates the latest move in its recent multi-month context and overlays the median 60-day seasonal path.
What should traders watch as the Aug 15 seasonal window approaches?
The first checkpoint is the Jul 31 earnings report, which will set the tone for how Eaton enters the Aug 15 seasonal window: a clean beat and reaffirmed guidance would align with the historically bullish ETN seasonal trend, while a miss or cautious outlook could test that pattern.[1],[5] Price-wise, traders will be watching whether the stock can reclaim its 50-day moving average near 403.65 and then challenge the 52-week high around 436.74 as the window opens, or whether it instead drifts back toward the low 300s where the last major base formed.[3] Behavior inside the window will matter: a familiar script would see early volatility and drawdowns followed by a stronger second-half climb, while a failure to recover from any early weakness would mark a clear break from the last 10 midterm-year cycles.
Macro and policy headlines will also be in focus, especially around tariffs, infrastructure funding and industrial demand, given how closely Eaton’s order book is tied to electrical and power-management spending.[4],[6] If the historical ETN seasonal trend is going to repeat, traders would expect to see continued strength in data center and utility demand, stable or improving analyst sentiment, and a stock that can absorb midterm-year volatility without losing its longer-term uptrend. Add it up: the Aug 15 to Jun 10 Eaton Corporation trading window has been one of the cleanest long-side patterns in the stock’s history, and how ETN behaves through this next iteration will tell investors whether that 10-for-10 streak still has life.
Sources
- Barchart – Earnings Preview: What to Expect From Eaton's Report (Apr 12, 2026)
- Barchart – ETN Analyst Ratings for Eaton Corp Stock (Jul 22, 2026)
- MarketWatch – Eaton Corp. PLC Stock Quote (accessed Jul 28, 2026)
- Barchart – Is Wall Street Bullish or Bearish on Eaton Stock? (May 15, 2026)
- Zacks – Eaton (ETN) Earnings Calendar and Estimates (Jul 28, 2026)
- CNBC – Eaton's stock sat out the AI boom this year. What can spark a rally in 2026 (Dec 31, 2025)
- Yahoo Finance / Simply Wall St – Eaton Insiders Sold US$22m Of Shares Suggesting Hesitancy (Apr 4, 2026)
- ChartMill – Eaton Corp. PLC: A Quality Power Management Leader for Long-Term Growth (Apr 22, 2026)
About this seasonal analysis
Seasonal pattern data is sourced from TradeWave.ai, which analyzes historical price behavior across annual calendar windows going back up to 30 years. Read the full data methodology or the book The 100-Year Pattern by Afshin Moshrefi (2026 edition). Past performance of seasonal patterns does not guarantee future results. This article is for informational purposes only and does not constitute investment advice.