Ford Motor Company (F) Has Dropped in 9 of 10 Midterm Aug 16-Sep 14 Windows
Ford Motor Company is climbing after a Q2 earnings beat and guidance hike, just weeks before a midterm-year seasonal window that has historically leaned lower and added volatility risk.
Price as of Jul 29, 2026: $15.28 (last close).

What is the seasonal pattern for Ford Motor Company (F)?
Ford Motor Company has fallen in 9 of 10 years during this Aug 16 to Sep 14 midterm-year window, with an average gain of 5.2% in winning years.
- 9 for 10 in this window, with Ford closing lower in nine midterm-year cycles and posting a 5.2% average move in winning years.
- The upcoming 30-day trading window runs from Aug 16 to Sep 14 and has historically favored short setups in Ford.
- Percent Profitable is 90%, with 9 winners and 1 loser for the short-side pattern across the last 10 midterm election years.
- Average Profit in winning years is 5.2%, while Avg Profit - All, including the one losing year, is 4%.
- The worst individual year saw a 10.77% loss for shorts, while several years featured double-digit favorable moves before the window closed.
- A TradeWave Ratio of 2.61 and a Sharpe ratio of 0.57 point to a historically active but risk-aware short window rather than a one-way trade.
According to historical data from TradeWave.ai, this late-summer stretch in midterm election years has behaved very differently from an average month for Ford, and the next iteration is approaching quickly.
How has Ford Motor Company (F) traded in the late-summer midterm-year window?
Ford Motor Company has closed lower in 9 of the last 10 midterm election years during the Aug 16 to Sep 14 window, a pattern that has historically rewarded short exposure. Shares finished Thursday at $15.28, up 2.1% on the day and roughly 57.6% above the 52-week low of about $9.70, leaving the stock well off the bottom of its recent range.[3] That combination of a strong year-to-date rebound and a historically weak late-summer window gives traders a clear calendar line to watch as the midterm-year phase gives way to the typically stronger pre-election year.
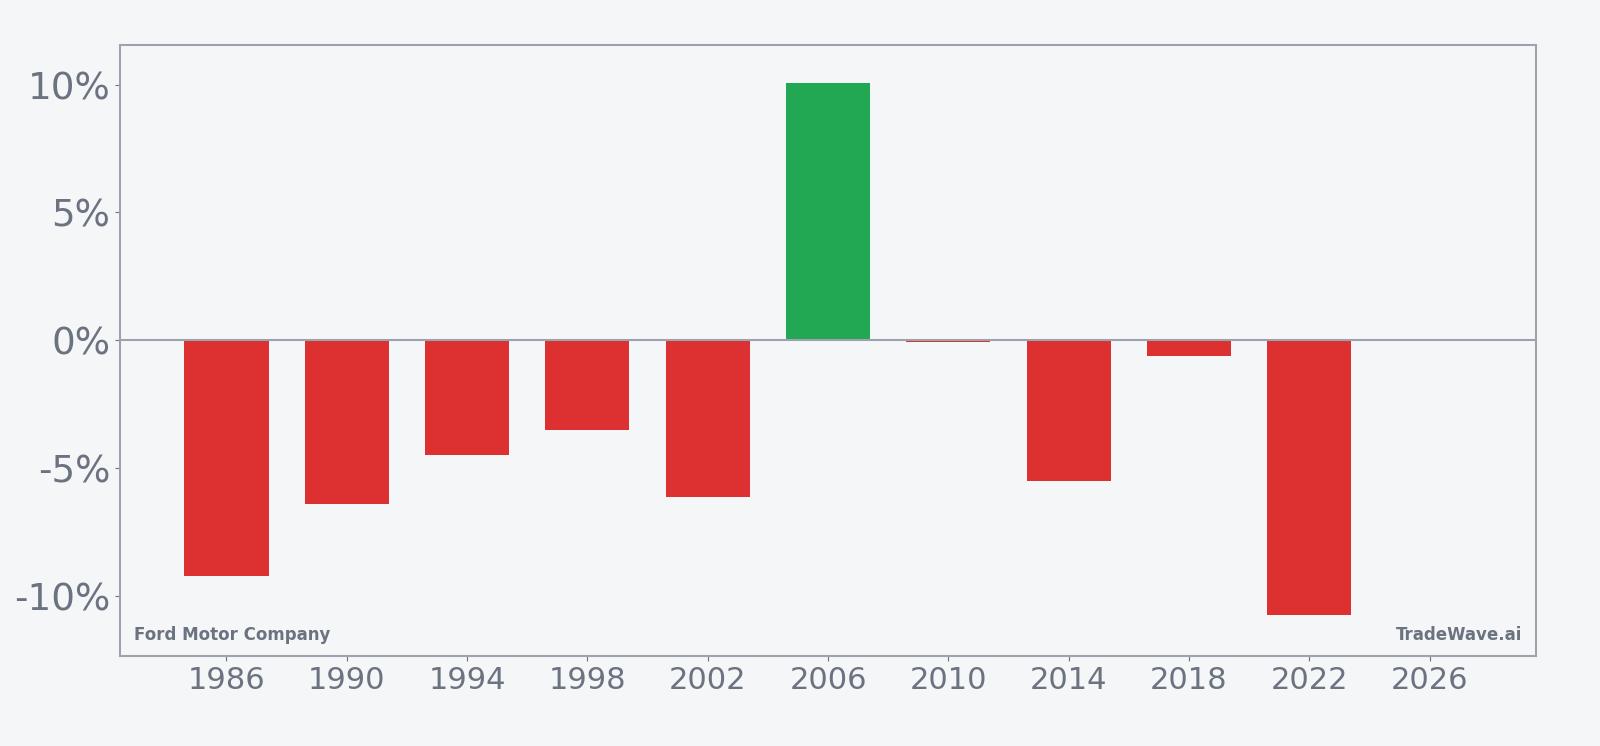
Because this pattern is grouped by the presidential election cycle, it reflects how Ford has behaved specifically in the last 10 midterm election years rather than in a run of consecutive calendar years. That matters in 2026, which is itself a midterm election year in this framework, with the market set to transition into the year before the presidential election, a phase that has often been more supportive for cyclicals and autos.
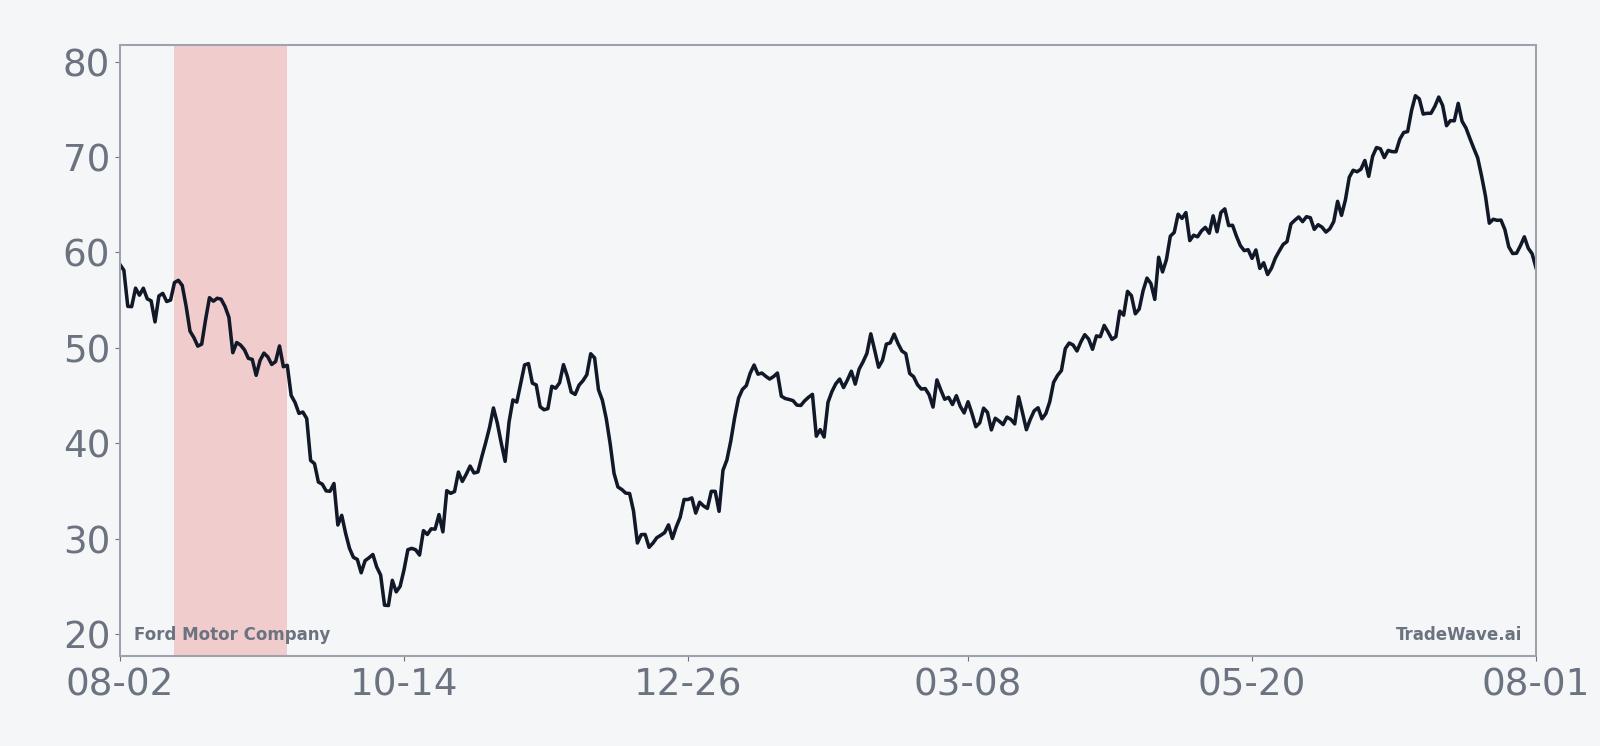
The historical stats line up with what the charts show. For short trades initiated at the Aug 16 close and exited 30 days later, 9 of 10 midterm-year windows have been profitable, with an average winner of 5.2% and an all-years average of 4% once the single losing year is included. The median outcome is a 5.01% gain for shorts, which suggests the pattern has not been driven by just one or two outliers.
Looking at individual years, 2022 stands out as the toughest environment for shorts, with a 10.77% loss as Ford rallied through the window despite the broader midterm-year volatility. On the other side of the ledger, 2006 delivered a 10.05% gain for shorts, helped by a 14.77% maximum favorable move at one point during the 30 days. That spread between the best and worst years is a reminder that even a strong seasonal tendency can flip when the fundamental backdrop is powerful enough.
The cumulative chart of this Ford Motor Company trading window shows how stacking the same 30-day short pattern across the last 10 midterm election years would have compounded to a 41% gain. The line does not move in a straight diagonal, but the drift is clearly downward for the stock price across the sample, which is what a short seller wants to see.
Yearly net and peak moves highlight how much Ford has tended to swing inside this window before the final close.
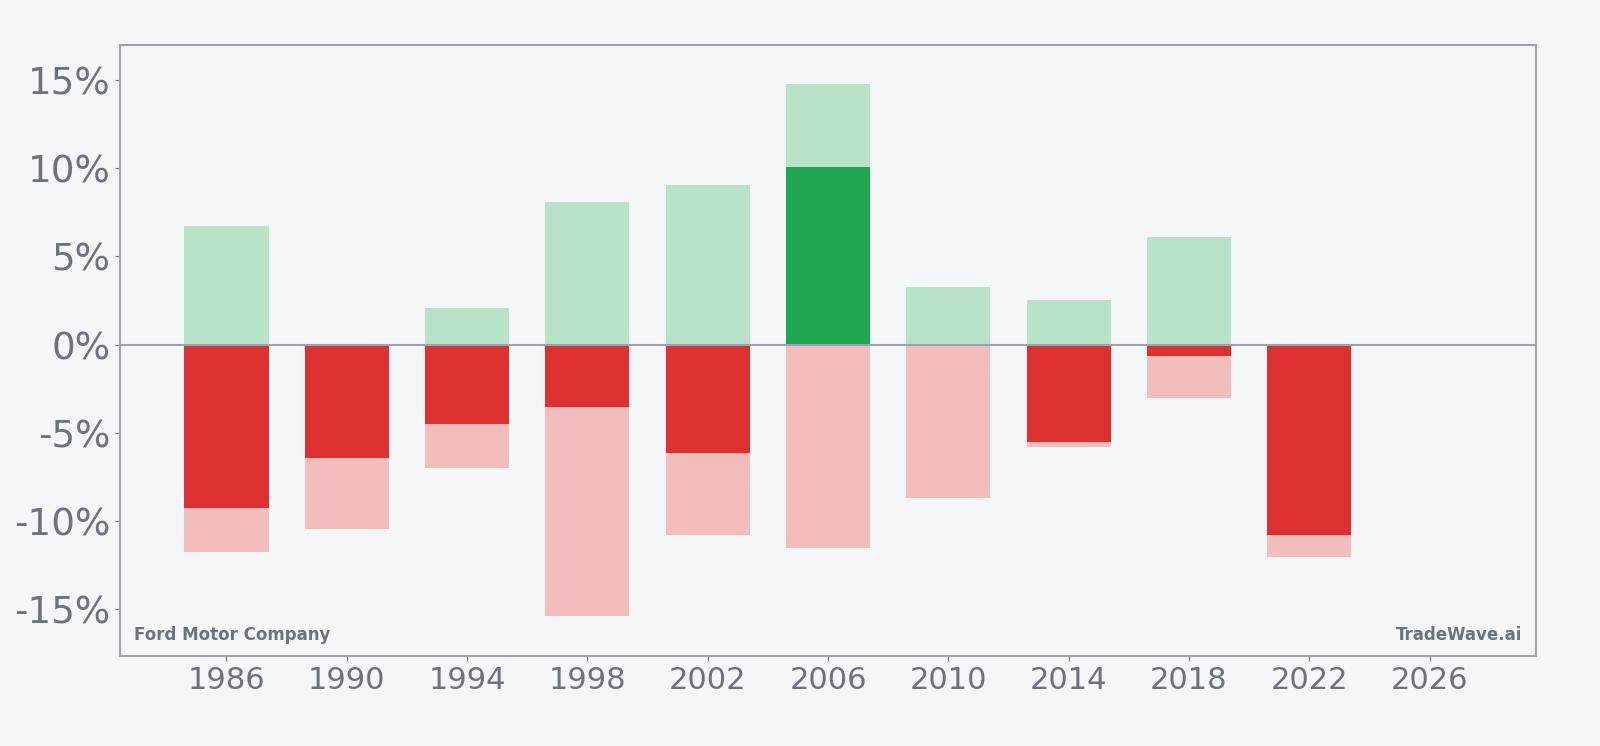
The bar-and-needle view of maximum favorable and maximum adverse excursions shows why this window has appealed to active traders. In several years, Ford has offered shorts a double-digit maximum favorable move at some point during the 30 days, even when the final net result was smaller. At the same time, the worst adverse excursions have often been in the high single digits, and in 2006 the stock rallied more than 11% against shorts at one point before rolling back over, underscoring the need for risk controls.
Put together, the pattern is clear: in the last 10 midterm election years, this late-summer window has favored short positions in Ford in 9 out of 10 cases, with enough intraperiod volatility to reward nimble traders but also to punish anyone who treats seasonality as a guarantee.
History does not guarantee future results; adverse excursions can be large even in winning windows, and traders can lose money following a pattern that has worked in most prior years.
Why does Ford Motor Company (F) follow this seasonal pattern?
One likely driver is the way midterm election years cluster macro and policy uncertainty into late summer, which can weigh on cyclical names like autos as investors de-risk ahead of fall events. Analysts have also pointed to model-year changeovers, inventory resets and fleet-order timing as reasons why August and early September can be choppy for automakers, especially when pricing power is in flux.[4] This Ford seasonal trend may therefore reflect a mix of political calendar jitters and industry-specific production and demand cycles that tend to converge in the same part of the year.
What is driving Ford Motor Company (F) today?
Ford shares closed at $15.28 on Thursday, up 2.1% on the session and roughly 9.5% higher year to date as investors digested a stronger-than-expected Q2 earnings report and a higher full-year profit outlook.[1] The stock is trading well above its 20-day average volume of about 51.9 million shares, with nearly 98 million shares changing hands, and sits above its 50-day moving average of $14.42, signaling that the recent bounce has some momentum behind it.[3]
The immediate catalyst was Ford’s Q2 2026 release on Jul 29, where the company posted adjusted EPS of $0.42, topping both Wall Street estimates and last year’s $0.37, even as revenue slipped to $44.89 billion and missed consensus.[1][3][4] Management raised full-year adjusted EBIT guidance to a range of $10 billion to $11 billion from a prior $8.5 billion to $10.5 billion, arguing that stronger pricing, cost discipline and a healthier mix of trucks and SUVs are offsetting softer volumes.[1][3][4][5] That guidance lift helped trigger upgrades from firms including Citigroup and Jefferies, which see room for further upside if Ford can sustain margins while navigating the EV transition and supply-chain normalization.[1][2]
On the operations side, the restart of a key Novelis aluminum plant is easing a bottleneck that had constrained F-150 production, a core profit driver for Ford’s North American business.[2] Better aluminum supply should support more stable output in the second half of the year, which matters for both revenue and fixed-cost absorption as the company leans on its truck and SUV franchise to fund EV and software investments.[2][4] The broader auto sector backdrop remains mixed, with pricing power still solid in profitable segments but competition intensifying in EVs and small cars, leaving investors focused on how long Ford can defend its margins.[4][5]
The chart below situates the latest move in its recent multi-month context and overlays the median seasonal path for the next 60 days.
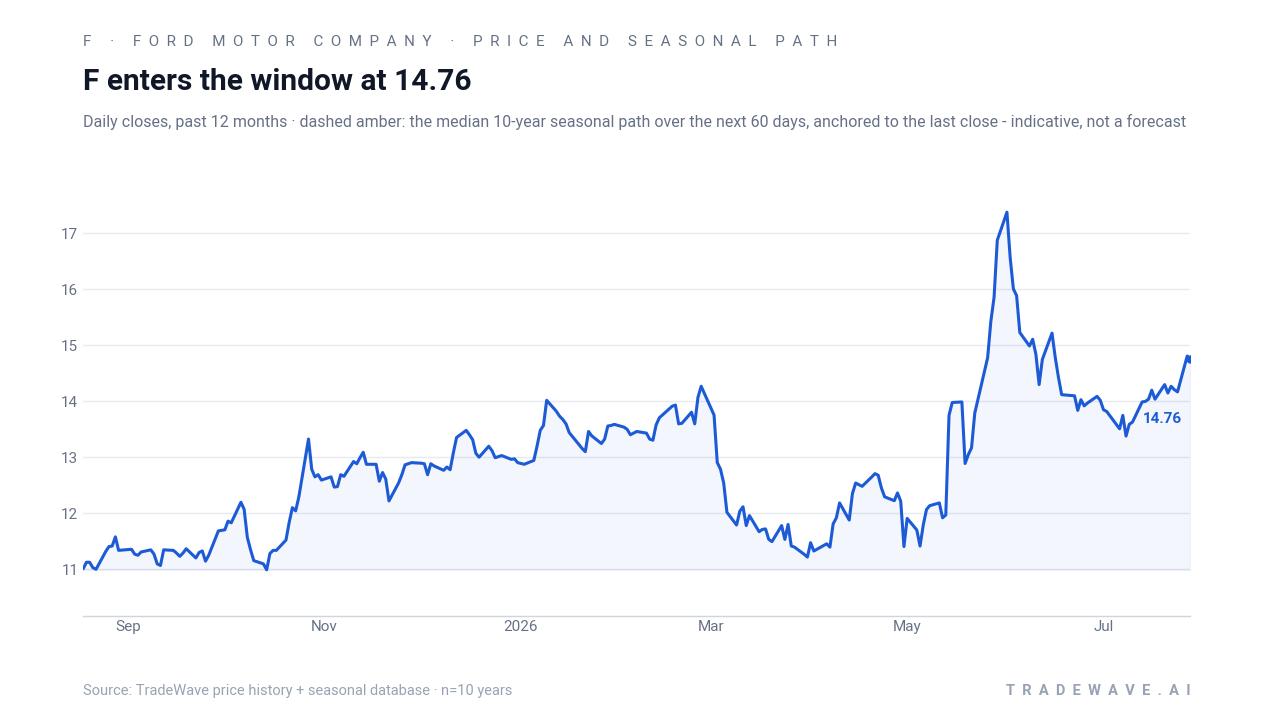
For traders, the tension is straightforward. Ford is enjoying a fundamental tailwind from better profitability, easing supply constraints and supportive analyst commentary, yet the stock is heading toward a late-summer window that has historically been a soft spot in midterm election years. The key question over the next few weeks is whether the improved earnings story can overpower that historical seasonality or whether the pattern reasserts itself as the calendar flips into the Aug 16 to Sep 14 stretch.
What should traders watch as this Ford seasonal window approaches?
First, the calendar: the seasonal window for this F seasonal trend opens on Aug 16 and runs through Sep 14, so price action in the days just before that start date will shape how stretched or supported the stock looks going in. A push toward the recent high near $16.29 would leave more room for a pullback, while a drift lower into the window could blunt some of the historical downside potential.[3]
Second, watch how Ford trades around any follow-up commentary on its raised EBIT guidance, especially if management updates on truck and SUV demand, EV pricing or the impact of the Novelis restart on F-150 production.[1][2][4][5] Stronger-than-expected order trends or further cost wins could keep buyers engaged even in a historically weak stretch, while any wobble in those metrics might align more closely with the midterm-year seasonal pattern.
Third, monitor volume and options positioning as the window opens. In May 2026, institutional investors were reported to be buying unusually large volumes of long-dated Ford call options, a sign of longer-term bullish positioning that could cushion near-term dips if it persists.[9] If that kind of activity fades or reverses into the late-summer window, it would remove a layer of support and make it easier for the historical short-side pattern to play out; if it builds further, it could instead set the stage for squeezes against shorts even in a seasonally weak period.[9]
Finally, keep an eye on the broader policy and macro calendar as the midterm election year moves toward its back half. Any shift in rate expectations, fiscal headlines or auto-specific regulation could amplify moves in Ford during this 30-day stretch, and a decisive break of key levels such as the 50-day moving average near $14.42 or the recent high around $16.29 would offer an early read on whether 2026 is lining up with or bucking the last 10 midterm-year late-summer windows.[3]
Sources
- CNBC, "Citigroup upgrades Ford after better-than-expected earnings," Jul 29, 2026
- CNBC, "Ford and General Motors get upgraded by Jefferies, which sees sharp gains ahead," Jul 27, 2026
- Barchart, "Stocks Tumble Ahead of FOMC as Chipmakers Plunge," Jul 29, 2026
- Zacks, "GM vs. Ford Stock: Which Auto Giant Is the Better Buy After Q2 Earnings?," Jul 29, 2026
- The Wall Street Journal, "Ford’s Sales and Revenue Are Down. The Automaker Isn’t Sweating It.," Jul 28, 2026
- Barchart, "Institutional Investors Love Ford Stock - Buying Huge, Unusual Volume of Long-Term Call Options," May 26, 2026
About this seasonal analysis
Seasonal pattern data is sourced from TradeWave.ai, which analyzes historical price behavior across annual calendar windows going back up to 30 years. Read the full data methodology or the book The 100-Year Pattern by Afshin Moshrefi (2026 edition). Past performance of seasonal patterns does not guarantee future results. This article is for informational purposes only and does not constitute investment advice.