This 55-Day Midterm Window Has Hit M&T Bank (MTB) Shorts in 9 of 10 Years
M&T Bank is approaching a historically weak late-summer trading window even as the stock trades near record levels after a strong year-to-date run and earnings beat.
Price as of Aug 11, 2026: $252.16 (last close).

What is the seasonal pattern for M&T Bank (MTB)?
M&T Bank has fallen in 9 of 10 midterm-year late-summer windows from Aug 16 to Oct 9, with an average 7.77% gain in winning years for the short side.
- 9 for 10 in this window, with the short side averaging 7.77% profit in winning years and 7% across all years.
- The seasonal window runs from Aug 16 to Oct 9 over the last 10 midterm election years and has a clear bearish bias for MTB.
- Percent Profitable is 90%, with 9 winning short years and just 1 losing year in the sample.
- Avg Profit reflects winners only at 7.77%, while Avg Profit - All, which includes the lone losing year, comes in at 7%.
- The TradeWave Ratio of 1.62 suggests price has typically moved meaningfully in the trade direction within the window, with sizable intraperiod swings.
- A Sharpe ratio of 0.99 for this short pattern points to a historically consistent risk-adjusted edge during this specific late-summer stretch.
According to historical data from TradeWave.ai, this late-summer stretch for M&T Bank has behaved very differently from an average month on the calendar. The next section walks through how that pattern has played out across past midterm election years.
How has M&T Bank (MTB) traded in the late-summer midterm-year window?
M&T Bank has closed lower in 9 of the last 10 midterm election years during the Aug 16 to Oct 9 window, with the short side averaging a 7.77% profit and a 7% gain across all years. Shares finished the prior session at 252.16, up 0.4% on the day and about 1.1% below their 52-week high of 255.00, after rallying 25.1% year to date.
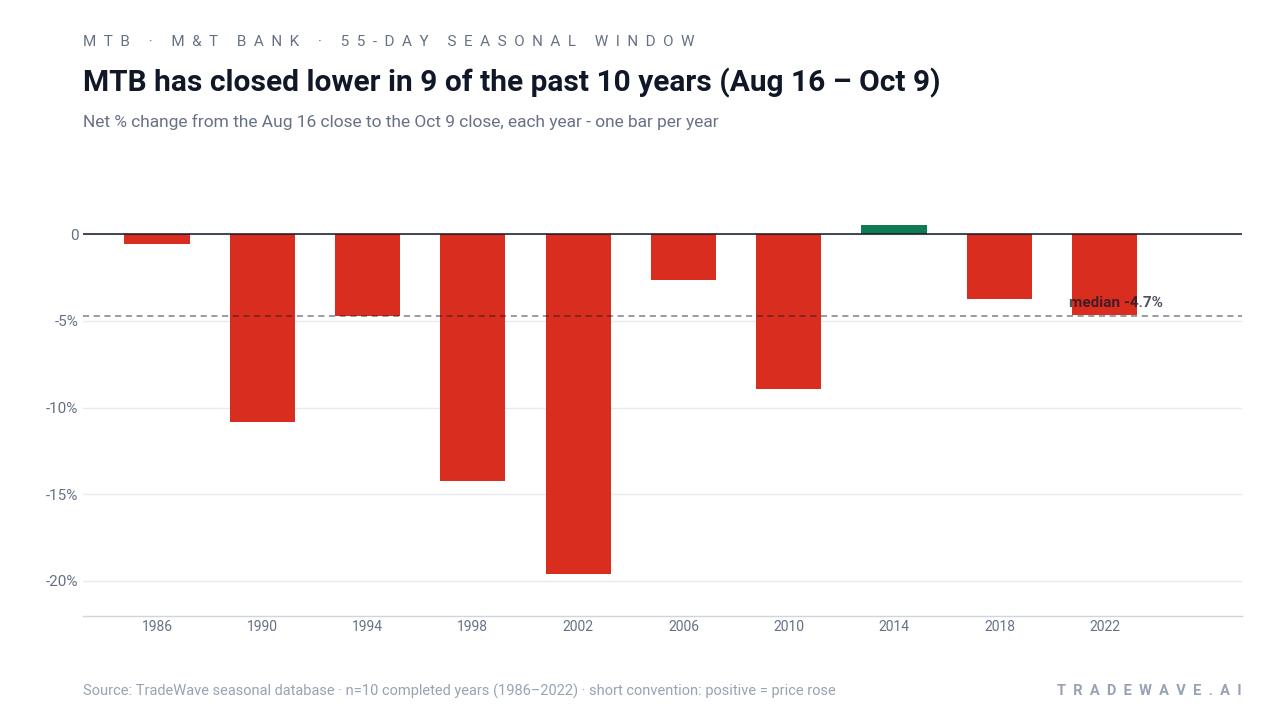
The pattern is grouped by the presidential election cycle, focusing on the last 10 midterm election years rather than consecutive calendar years. That matters because regional banks like M&T often feel policy and rate shifts most acutely in the middle of a presidential term, when Washington tends to pivot from stimulus to consolidation and regulatory fine-tuning.
Historically, this 55-day stretch has favored short exposure. Percent Profitable sits at 90%, with 9 winning short years against just 1 losing year, and the all-years average profit of 7% suggests the down moves have not been marginal. For context, the strongest short year in the sample was 2002, when the window delivered a 19.6% gain for the short side as the stock slid from 44.04 to 35.40. At the other end of the spectrum, 2014 was the lone losing year for shorts, with a modest 0.52% net rise in the stock over the window.
The average winning year profit of 7.77% shows that when the pattern works, it has tended to deliver a mid-single to high-single-digit decline in the share price over roughly two months. Because Avg Profit - All is only slightly lower at 7%, the single losing year has not meaningfully diluted the overall seasonal edge. That combination of a high win rate and relatively tight gap between winners-only and all-years averages is unusual for a single-stock seasonal pattern.
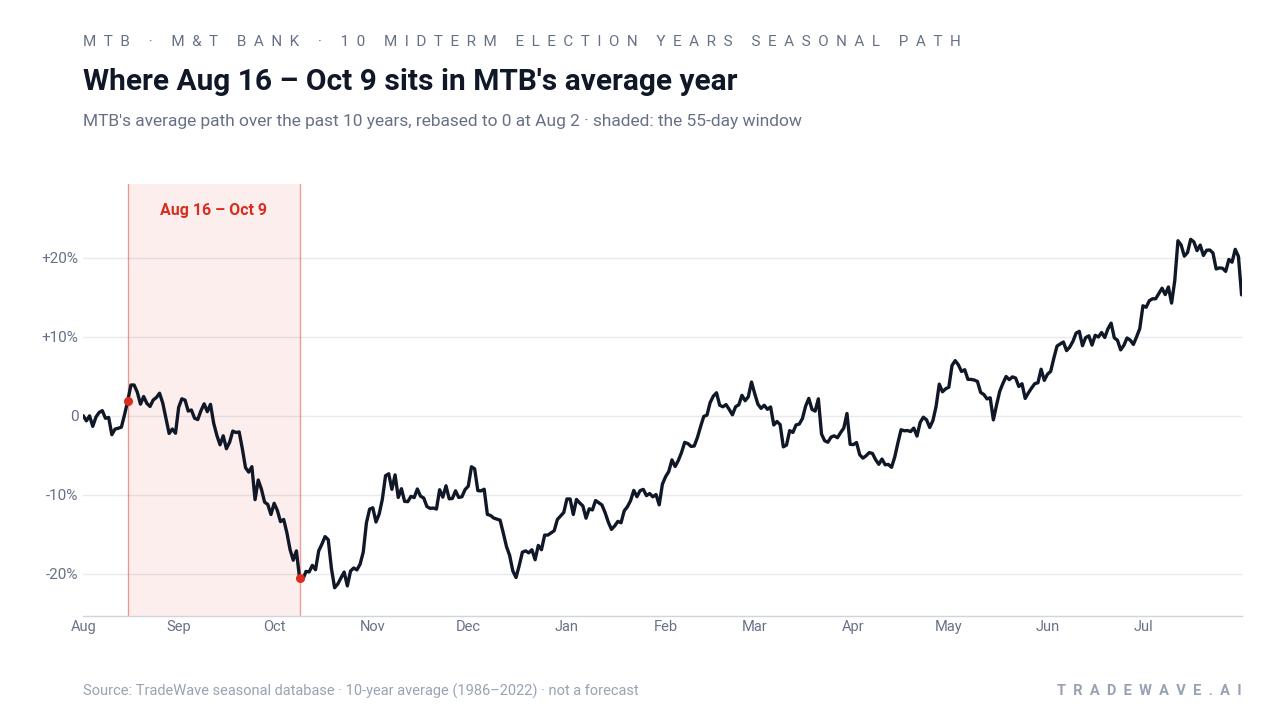
The historical seasonal average chart shows M&T Bank typically flattening and then drifting lower through this late-summer window in midterm years, rather than collapsing in a straight line. The average path suggests pressure tends to build gradually, with weakness often becoming more pronounced into the back half of the 55-day span as investors digest policy and rate headlines.
Year-by-year ranges show how far the stock has swung inside the window before settling at its final close.
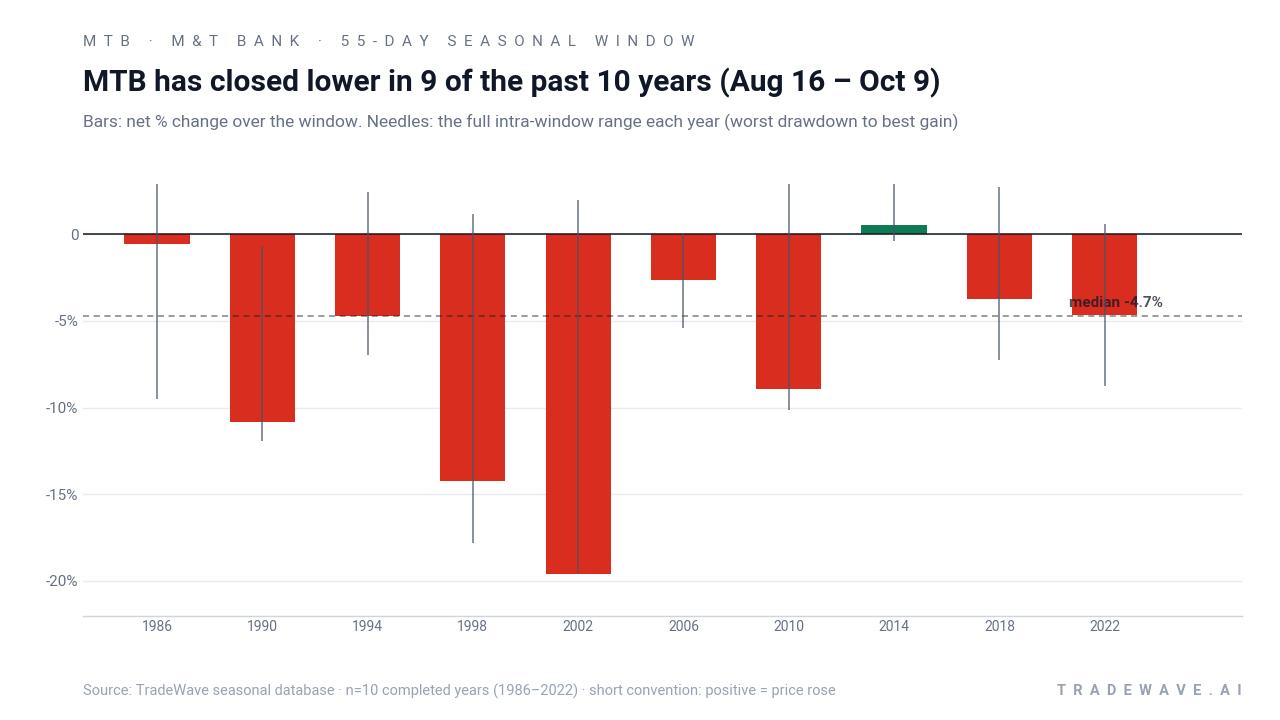
The bars-and-needles view makes clear that intraperiod swings have been meaningful. In 1998, for example, the stock’s worst drawdown from entry within the window reached 17.82% before finishing the period down 14.26%, while in 2010 the best point-to-peak move against the short side was a 12.07% rally even though the window still ended with an 8.9% gain for shorts. That is the essence of MFE and MAE in this context: the best favorable move for the trade and the worst adverse move from the entry, both of which have been sizable enough to matter for risk management.
Stacking the window year after year compounds to a 92% cumulative return for the short side across the 10 midterm-year samples. Add it up: a trader who only engaged with M&T Bank during this specific late-summer stretch in those years, and sat out the rest of the calendar, would have nearly doubled capital tied to the pattern. History does not guarantee a repeat, but a 9-for-10 record with that kind of cumulative profile is hard to ignore.
History does not guarantee future results, and adverse excursions within the window can be large even in years that ultimately finish as winners for the short side.
Why does M&T Bank (MTB) follow this seasonal pattern?
This midterm-year late-summer pattern may reflect a mix of earnings timing, rate expectations and portfolio repositioning. One likely driver is that investors often reassess regional bank exposure after midyear results, especially when policy debates around regulation and capital standards heat up in the middle of a presidential term. That can lead to profit-taking in names like M&T Bank that have rallied into the summer, creating a recurring soft patch between August and early October.
What is driving M&T Bank (MTB) today?
M&T Bank closed at 252.16 in the prior session, up 1.03 points or 0.4%, leaving the stock about 1.1% below its 52-week high of 255.00 and up 25.1% so far in 2026. The move caps a strong run that accelerated after the bank reported second-quarter EPS of roughly $5.35 versus estimates near $4.66, with revenue of $2.53 billion topping consensus around $2.46 billion and profitability metrics including a 22.72% net margin and 11.80% return on equity supporting the bull case.[7]
Analyst sentiment is more measured than the price action suggests. MarketWatch and MarketBeat data show a consensus “Hold” rating on the stock, with an average price target around 256.14, only slightly above the latest close and implying limited upside from here.[1][2][6] That cautious stance reflects both the strong year-to-date rally and the broader debate over how higher-for-longer interest rates and credit quality will shape returns for regional banks.[4]
Sector context also matters. M&T Bank screens as relatively inexpensive versus the broader finance sector, with a price-to-earnings multiple near 13.3 compared with roughly 29.1 for the sector, according to MarketBeat’s profile data.[1] That valuation gap has attracted interest from fundamental investors, but it also means a lot of “cheap bank” positioning is already in the stock as it trades near its highs.
Insider behavior has been a talking point as well. In late July, MarketBeat highlighted that insiders own only about 0.44% of M&T Bank shares and that EVP Christopher E. Kay sold 3,105 shares on May 7 at roughly $216.50, a transaction of about $672,232.50 that added to a broader pattern of insider selling over the past year.[7] Earlier in 2026, Simply Wall St pieces on Yahoo Finance also flagged roughly $20 million of insider stock sales and framed them as a potential bearish signal, though those articles predate the latest leg of the rally and should be read as background rather than a live trigger.[8][9]
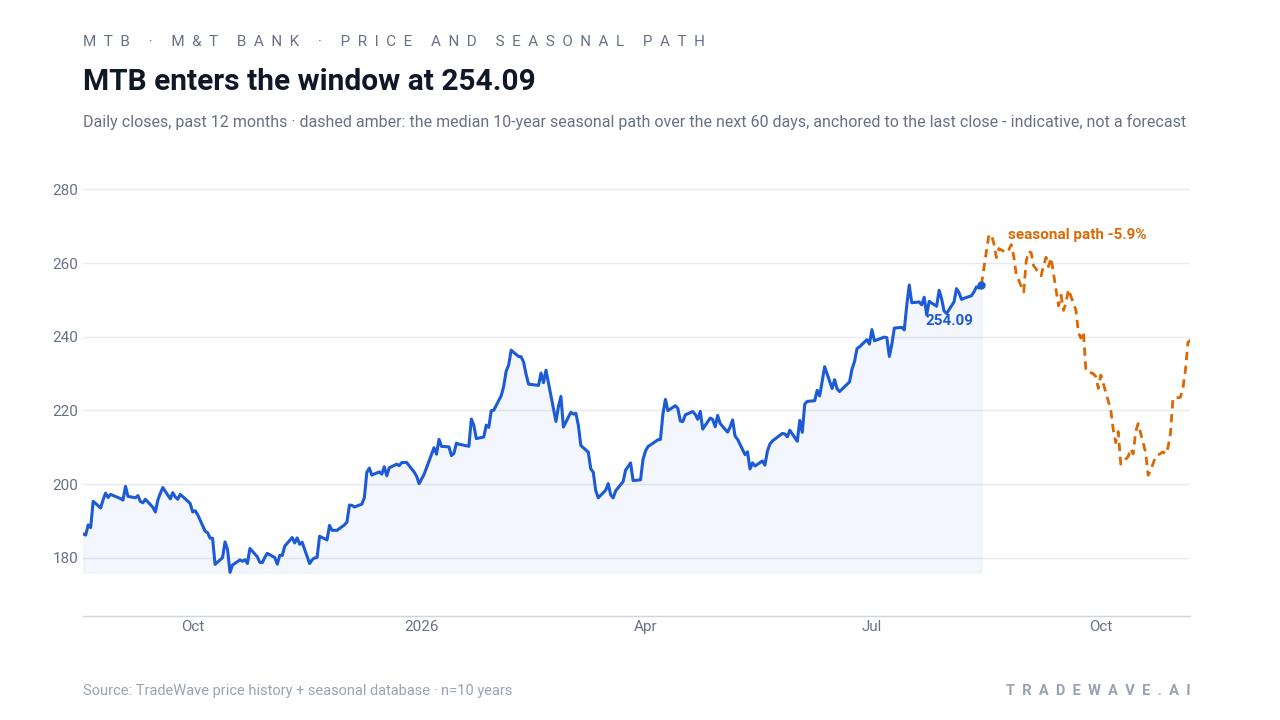
The chart below situates the latest move in its recent multi-month context and overlays the historical seasonal path for the coming weeks.
What should traders watch as this seasonal window approaches?
First, the calendar. The 55-day window begins on Aug 16 and runs through Oct 9, squarely in the mid part of the midterm election year, when policy noise around regulation, capital rules and fiscal priorities often picks up. If M&T Bank continues to hover near its highs into that start date, the historical pattern suggests a higher-than-usual risk of a late-summer fade.
Second, price levels. On the upside, the 52-week high near 255 is the obvious line in the sand; sustained closes above that level during the window would look more like the rare 2014-style miss for the short pattern. On the downside, traders will be watching how quickly any pullbacks develop once the window opens and whether intraperiod swings begin to resemble past years where maximum adverse moves for longs reached double digits.
Third, insider and positioning signals. The recent pattern of insider selling, including the May transaction by EVP Christopher E. Kay and the broader sales highlighted earlier in 2026, will be worth revisiting if the stock starts to roll over during the window.[7][8][9] A fresh wave of insider disposals or a visible cooling in analyst enthusiasm would rhyme with prior midterm-year episodes where investors used late summer to lock in gains.
Finally, the macro and policy calendar. Any shifts in rate expectations, credit quality headlines or regulatory proposals for regional banks could act as catalysts inside this historically weak stretch.[4] If M&T Bank shrugs off those crosscurrents and holds above recent support, it would mark a clear break from its usual midterm-year seasonal trend. If instead the stock starts to drift lower with expanding intraday ranges, it would look a lot like the pattern that has played out in 9 of the last 10 cycles.
Sources
- MarketBeat (via Google redirect) – M&T Bank (MTB) Stock Price, News & Analysis (Aug 12, 2026)
- MarketWatch – MTB | M&T Bank Corp. Analyst Estimates (Aug 12, 2026)
- Zacks (via Google redirect) – M&T Bank (MTB) Earnings Calendar & Announcement (Aug 12, 2026)
- MarketBeat – M&T Bank (NYSE:MTB) Stock Price Expected to Rise, Barclays Analyst Says (Jul 16, 2026)
- MarketBeat – Keefe, Bruyette & Woods Forecasts Strong Price Appreciation for M&T Bank (NYSE:MTB) Stock (Jul 16, 2026)
- ChartMill – MTB Stock Price, Quote & Chart | ChartMill (Aug 3, 2026)
- MarketBeat – M&T Bank Corporation $MTB Shares Sold by Entropy Technologies LP (Jul 26, 2026)
- Yahoo Finance (Simply Wall St) – Insiders At M&T Bank Sold US$20m In Stock, Alluding To Potential Weakness (Mar 26, 2026)
- Yahoo Finance (Simply Wall St) – Possible Bearish Signals With M&T Bank Insiders Disposing Stock (May 26, 2026)
About this seasonal analysis
Seasonal pattern data is sourced from TradeWave.ai, which analyzes historical price behavior across annual calendar windows going back up to 30 years. Read the full data methodology or the book The 100-Year Pattern by Afshin Moshrefi (2026 edition). Past performance of seasonal patterns does not guarantee future results. This article is for informational purposes only and does not constitute investment advice.