Cintas (CTAS) Has Risen in 15 of 15 Years During This 323-Day Seasonal Window
Cintas shares are hovering near $199 as the stock approaches a long industrial seasonal window that has delivered gains every year for the past decade and a half.
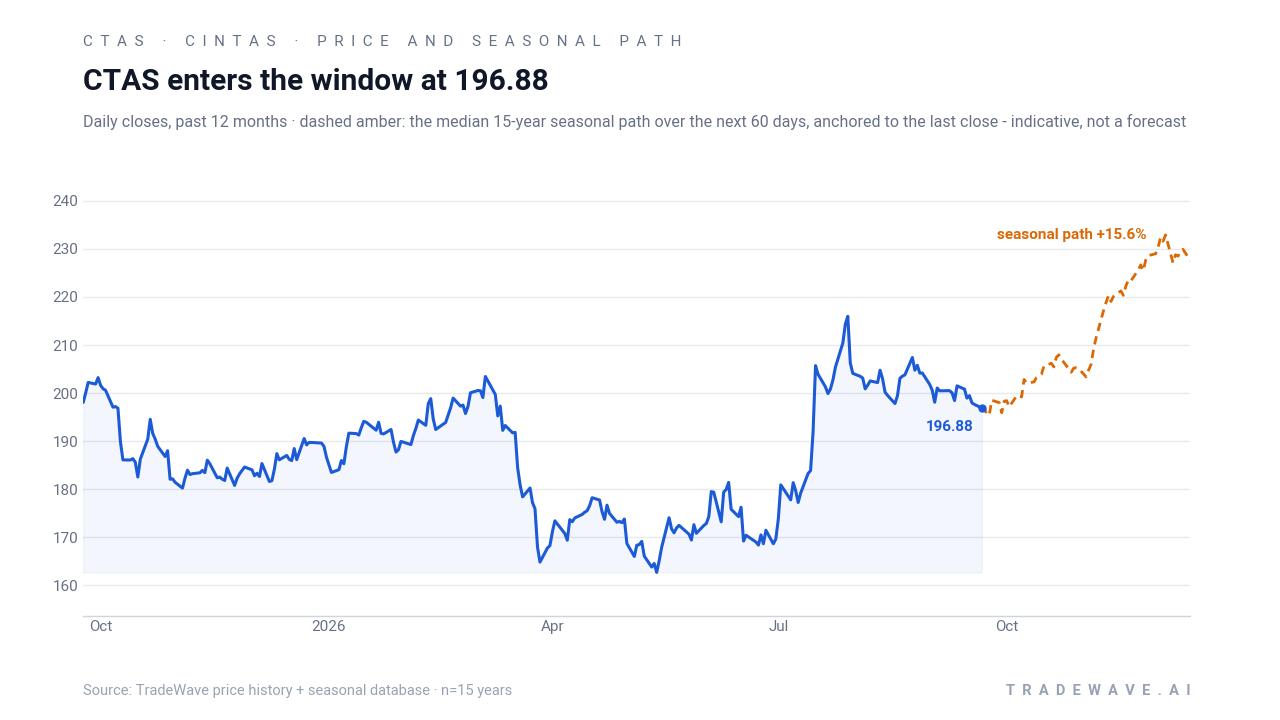
Price as of Sep 22, 2026: $198.80 (last close).

What is the seasonal pattern for Cintas (CTAS)?
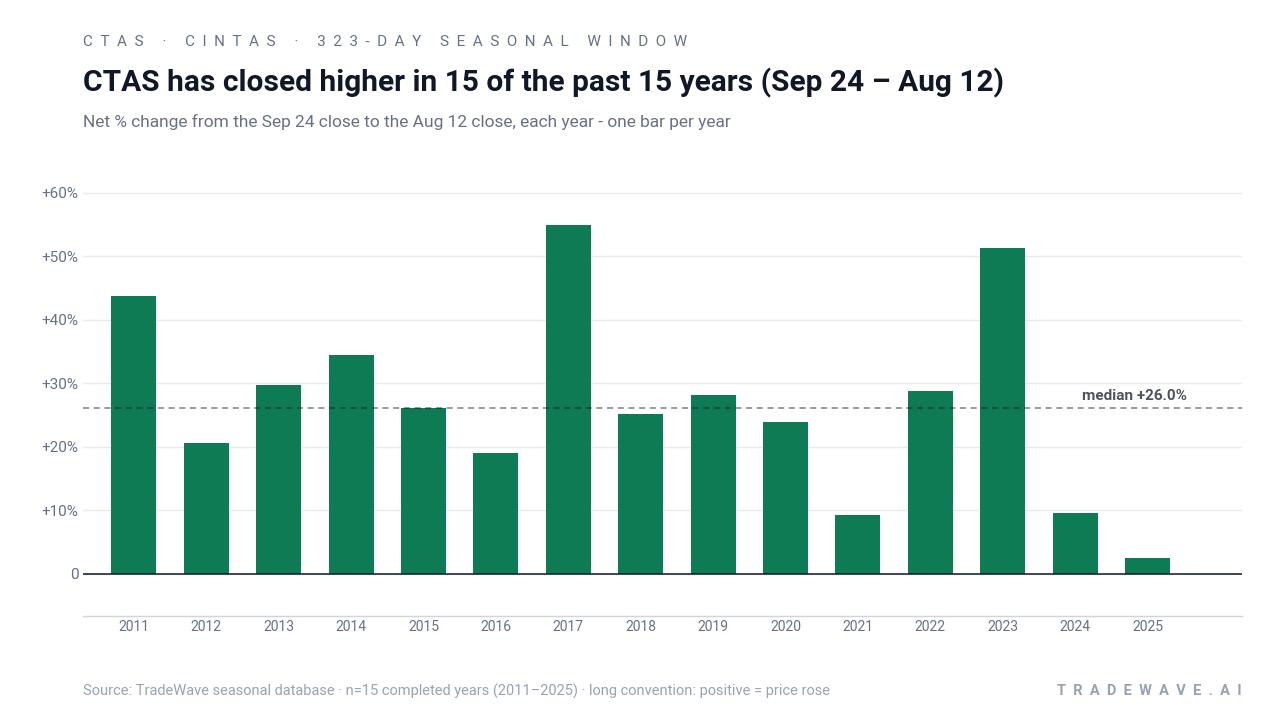
Cintas has risen in 15 of 15 years during this Sep 24 to Aug 12 window, with an average gain of 27.13% in winning years.
- 15 for 15 in this window, averaging 27.13% gains in winning years across the past 15 cycles.
- The upcoming 323-day Cintas trading window runs from Sep 24 to Aug 12 and has historically favored long positions.
- Percent Profitable is 100.0%, with 15 winners and 0 losers over the lookback period.
- Avg Profit in winning years is 27.13%, with individual years ranging from about 2.49% to 54.87% gains.
- The TradeWave Ratio of 1.94 suggests price has typically traveled meaningfully in the trade direction within the window.
- A Sharpe ratio of 1.6 for this window points to strong risk-adjusted returns compared with typical single-stock seasonality.
According to historical data from TradeWave.ai, this long Cintas window has behaved very differently from an average year, and the next iteration begins in a matter of hours.
How strong is the upcoming seasonal window for Cintas (CTAS)?
Cintas has risen in 15 of 15 years during the Sep 24 to Aug 12 seasonal window, posting an average gain of 27.13% and a cumulative return of 3234.33% when the window is stacked year after year. The next 323-day stretch opens on Sep 24 with the stock last changing hands at $198.80, about 8.8% below its 52-week high and roughly 24.7% above its 52-week low. That combination of a clean win streak and mid-range price positioning makes this industrial seasonal pattern hard for traders to ignore.
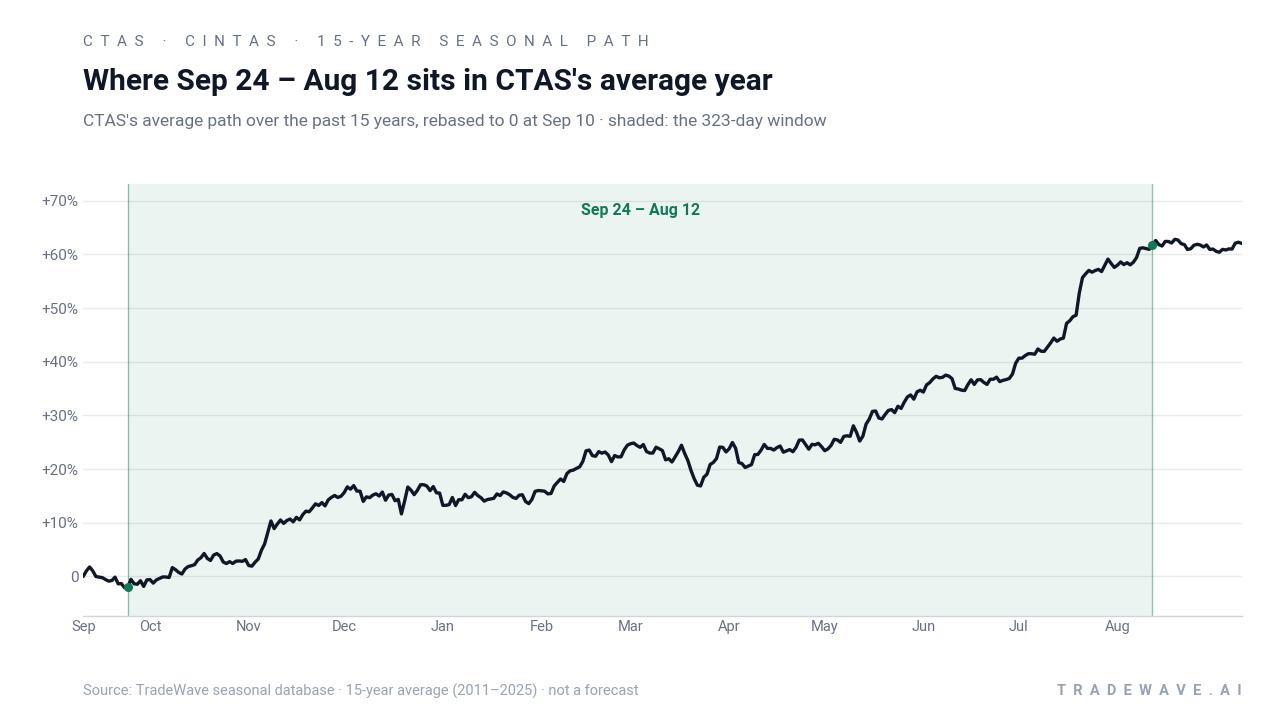
A second view of yearly ranges shows how upside and downside have played out inside this long window.
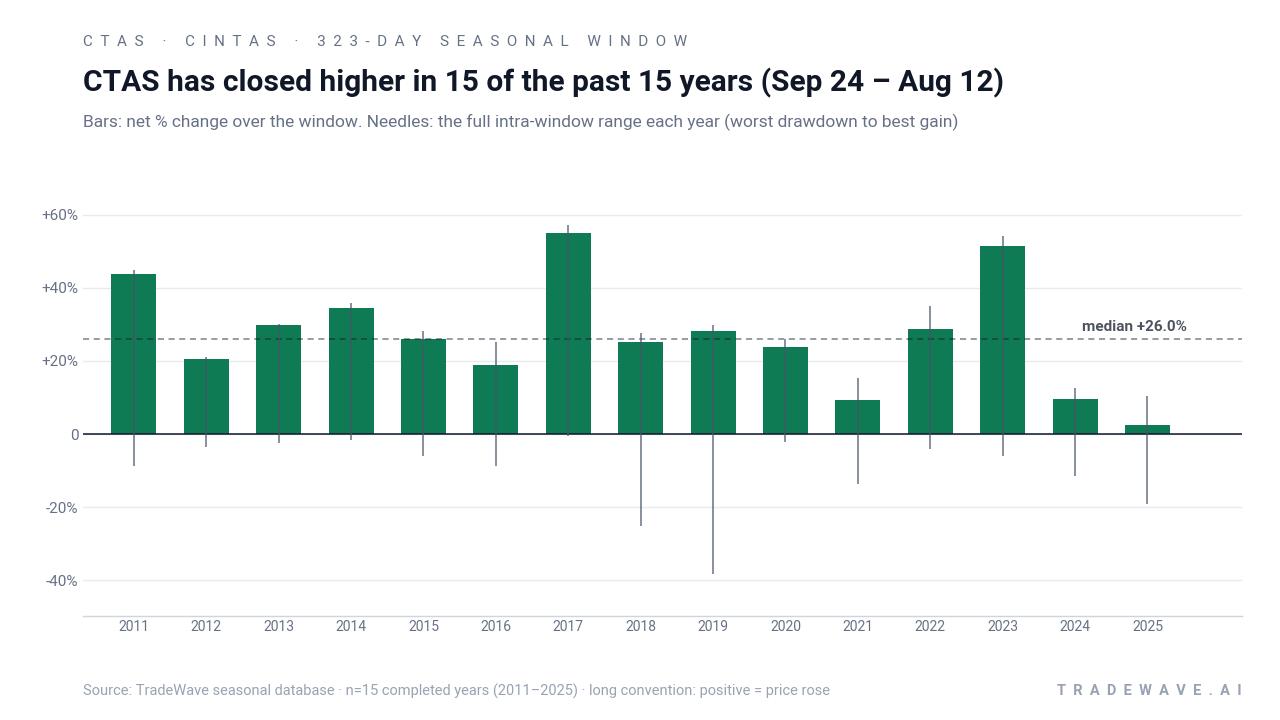
Across individual years, the strongest outcome in this Cintas trading window came in 2017, when the stock gained 54.87% with a best intraperiod run-up of 57.02% and only a shallow 0.58% drawdown from the entry. At the other end of the spectrum, 2025 still finished positive at 2.49% but saw a worst intraperiod decline of 19.06% before recovering, a reminder that a winning year for the pattern can still feel rough in real time. The maximum favorable excursions in many years, such as 35.0% in 2022 and 54.13% in 2023, show that upside has often extended well beyond the final close, while adverse moves like the 38.2% drawdown in 2019 underline the need to respect risk even in a historically bullish stretch.
The annualized return of 26.34% and Sharpe ratio of 1.6 for this window are high for a single-stock seasonal pattern, and the 3234.33% compounded gain from repeatedly holding only this slice of the calendar is striking. The TradeWave Ratio of 1.94 indicates that, within the window, price has typically traveled meaningfully in the long direction, not just drifted sideways. Add it up: 15 straight wins, double-digit average gains, and a long history of sizable intraperiod swings make this one of the more robust CTAS seasonal trends on the industrial calendar.
History does not guarantee future results; adverse excursions can be large even in winning windows, and past Cintas drawdowns inside this pattern have reached nearly 40% in some years.
Why does Cintas (CTAS) follow this seasonal pattern?
One likely driver is the company’s earnings and contract cycle, as uniform and facility-service agreements often renew on annual schedules that cluster revenue and margin inflection points. Analysts have also pointed to institutional portfolio rebalancing in industrials, where steady cash-flow names like Cintas can see flows build after early-year macro uncertainty fades. This pattern may also reflect broader business-spending seasonality, with workplace safety, cleaning and uniform budgets ramping as companies plan for calendar-year operations and regulatory compliance.
What is driving Cintas (CTAS) today?
Cintas closed at $198.80 in the latest session, up 0.98% on the day, after trading between $196.00 and $198.81 on volume of about 2.23 million shares. The stock sits roughly 8.8% below its 52-week high of $218.04 and about 24.7% above its 52-week low near $159.46, with a one-month return of -3.39% and a 50-day moving average around $201.33. The 20-day average volume of roughly 1.85 million shares suggests today’s activity was somewhat heavier than usual, but there are no fresh company-specific headlines or macro shocks in the latest dataset to explain the move.
In December 2025, Cintas drew attention with a $5.2 billion all-cash bid for rival UniFirst that included a $350 million reverse termination fee, a structure designed to address antitrust risk and signal confidence in closing the deal.[1] Coverage at the time noted that UniFirst shares jumped sharply on the offer while Cintas stock posted a modest gain, reflecting investor expectations for consolidation benefits in the industrial and workplace-services sector.[1][2] Those articles are now background rather than active catalysts, but they frame how investors think about Cintas as a consolidator with scale advantages in uniforms, facility services and safety products.[1][2]
Sector commentary has emphasized that Cintas sits at the center of a steady, recurring-revenue niche in industrials, supplying uniforms, cleaning services and safety gear to a wide range of businesses.[2] The proposed UniFirst acquisition was cast as a way to deepen that moat, expand route density and drive efficiency, themes that still shape how investors view the stock’s long-term story even as the market waits for updated deal and regulatory details.[1][2]
The chart below situates the latest move in its recent multi-month context and overlays the median 60-day seasonal path ahead of the new window.
What should traders watch in this Cintas (CTAS) seasonal window?
First, price levels matter. With CTAS sitting below its 52-week high but well above its 52-week low, how the stock behaves around the $200 area as the window opens will show whether buyers are willing to lean into the historical seasonality or wait for deeper pullbacks. A sustained move back above the 50-day moving average near $201.33 early in the window would be consistent with the long-biased historical pattern, while a break toward the mid-$180s would test how durable that 15-for-15 record really is.
Second, watch the cadence of earnings and any updates on the UniFirst bid or broader M&A strategy. In prior years, some of the biggest maximum favorable moves inside this window have lined up with positive earnings surprises or clearer visibility on growth and margins, while the worst drawdowns have tended to cluster around macro scares or company-specific disappointments. If Cintas delivers solid execution and clarity on capital allocation during this stretch, it would fit the historical script of strong industrial-seasonal performance; if not, the large historical adverse excursions show how quickly sentiment can swing.
Finally, monitor volatility and intraperiod swings rather than just end-of-window outcomes. The historical record shows that even in years that finished higher, Cintas has often experienced double-digit drawdowns before recovering, which can be painful for traders using leverage or tight stops. For investors tracking the CTAS seasonal trend, the key tell will be whether pullbacks inside this Sep 24 to Aug 12 window behave like prior years, with buyers stepping in after sharp drops, or whether selling pressure persists and breaks the pattern’s long winning streak.
Sources
About this seasonal analysis
Seasonal pattern data is sourced from TradeWave.ai, which analyzes historical price behavior across annual calendar windows going back up to 30 years. Read the full data methodology or the book The 100-Year Pattern by Afshin Moshrefi (2026 edition). Past performance of seasonal patterns does not guarantee future results. This article is for informational purposes only and does not constitute investment advice.