Walmart (WMT) Broadens Higher-Income Reach as a 199-Day Holiday Rally Window Nears
Walmart is trading about 18.1% below its 52-week high as it approaches a late-September seasonal window that has delivered gains in every year of the past decade, a stretch that has often coincided with its core holiday and post-holiday trading cycle.
Price as of Sep 22, 2026: $110.12 (last close).

What is the seasonal pattern for Walmart (WMT)?
Walmart has risen in 10 of 10 years during this Sep 29 to Apr 15 window, with an average gain of 11.75% in winning years.
- 10 for 10 in this window, with Walmart gaining an average 11.75% across all winning years.
- The upcoming 199-day stretch runs from Sep 29 to Apr 15 and has historically favored long positions in WMT.
- Percent Profitable is 100.0%, with 10 winners and 0 losers over the past decade in this specific window.
- Median profit of 12.13% shows that typical years have delivered double-digit gains, not just a few outliers.
- The TradeWave Ratio of 1.49 indicates that price has typically traveled meaningfully in the trade direction within the window.
- A Sharpe ratio of 1.8 for this window points to a strong risk-adjusted profile compared with many single-stock seasonal patterns.
According to historical data from TradeWave.ai, this late-September through mid-April stretch has behaved very differently from an average month in Walmart’s trading year. The next section looks at how that pattern has played out over the past decade and what it implies for the upcoming window.
How has Walmart (WMT) traded in the Sep 29 to Apr 15 window?
Walmart has closed higher in this Sep 29 to Apr 15 window in 10 of the past 10 years, averaging an 11.75% gain with a long bias. Shares finished the prior session at 110.12, up 2.5% on the day and sitting about 18.1% below the 52-week high of 134.52, leaving room above if the historical pattern repeats.
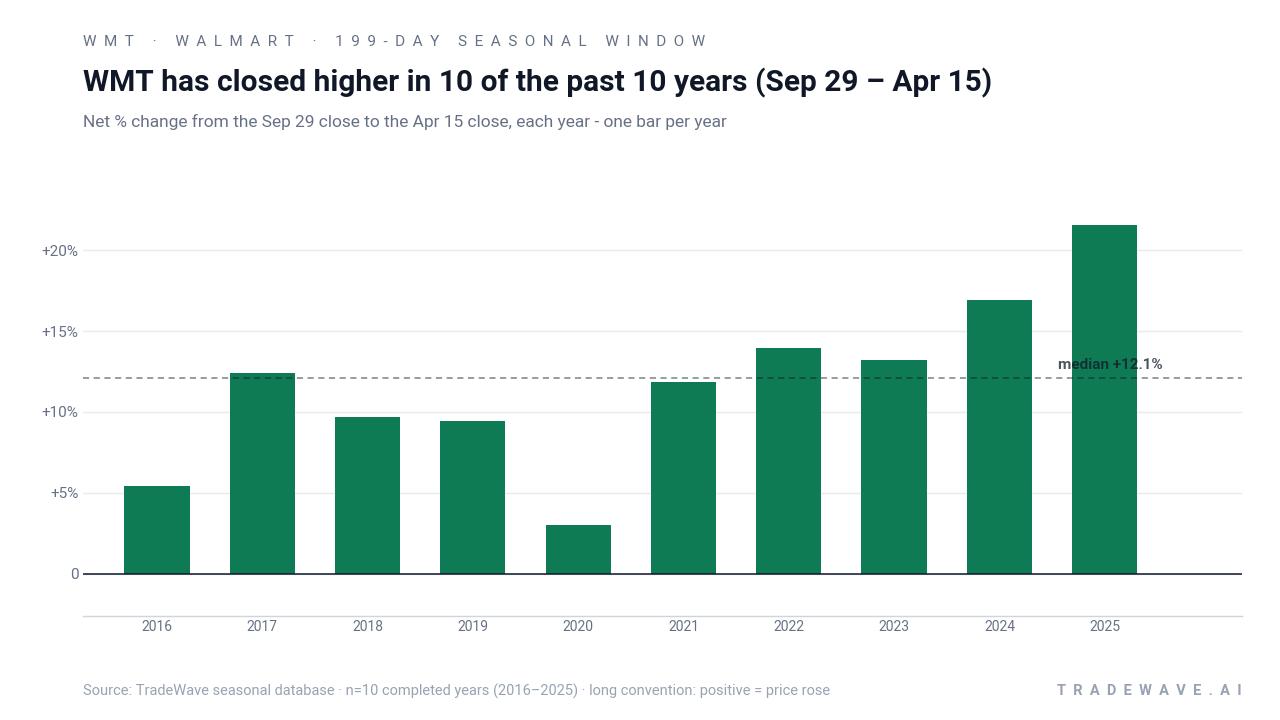
Across the 10-year sample, the trade direction is firmly long. Percent Profitable sits at 100.0%, with 10 winners and 0 losers, and the median profit of 12.13% shows that most years have delivered solid double-digit gains rather than relying on a single blockbuster outlier. The weakest year in the set was 2020, when the window still produced a 3.0% net gain, while the strongest was 2025 with a 21.53% rise from entry to exit.
Average profit of 11.75% across all years means the typical outcome has been a mid-teens style move in Walmart’s favor over roughly six and a half months. In 2017 and 2024, for example, the stock gained 12.39% and 16.95% respectively over the window, while 2019 and 2022 delivered 9.46% and 13.95%. Add it up and stacking this same window year after year would have compounded to a 200.57% cumulative return over the decade.
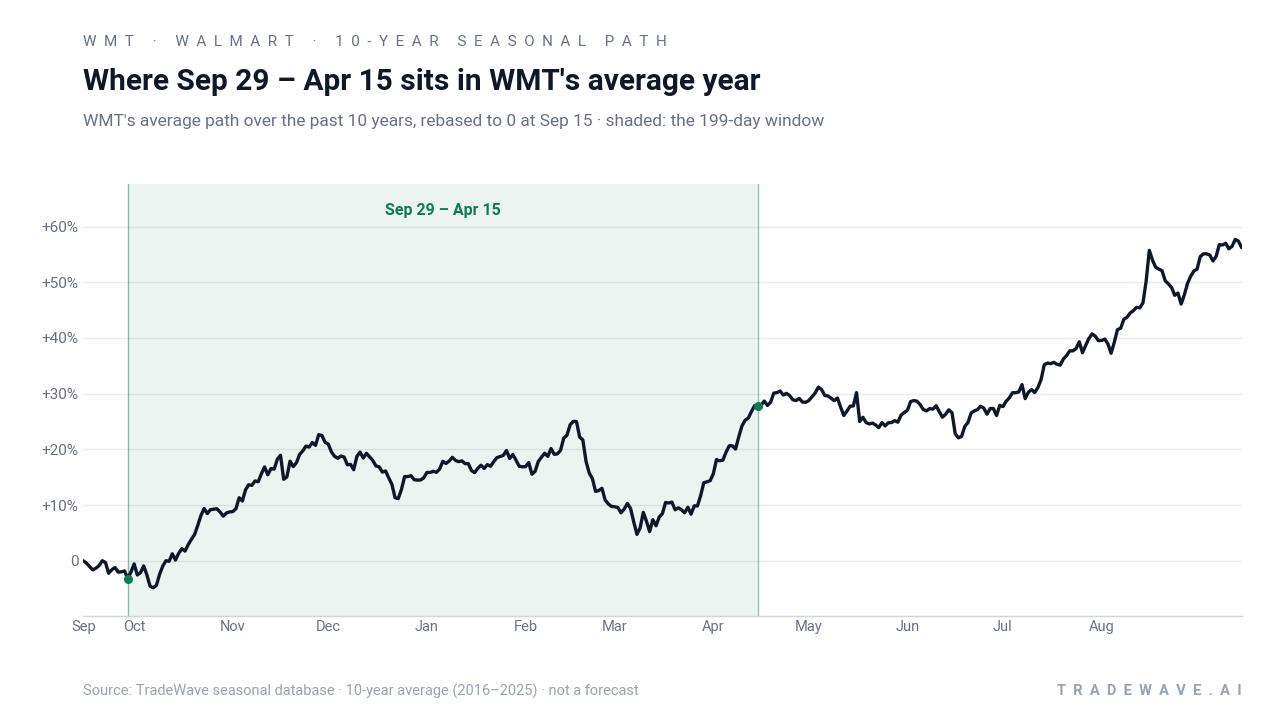
Yearly net and intraperiod swings show how upside and drawdowns have coexisted inside this bullish window.
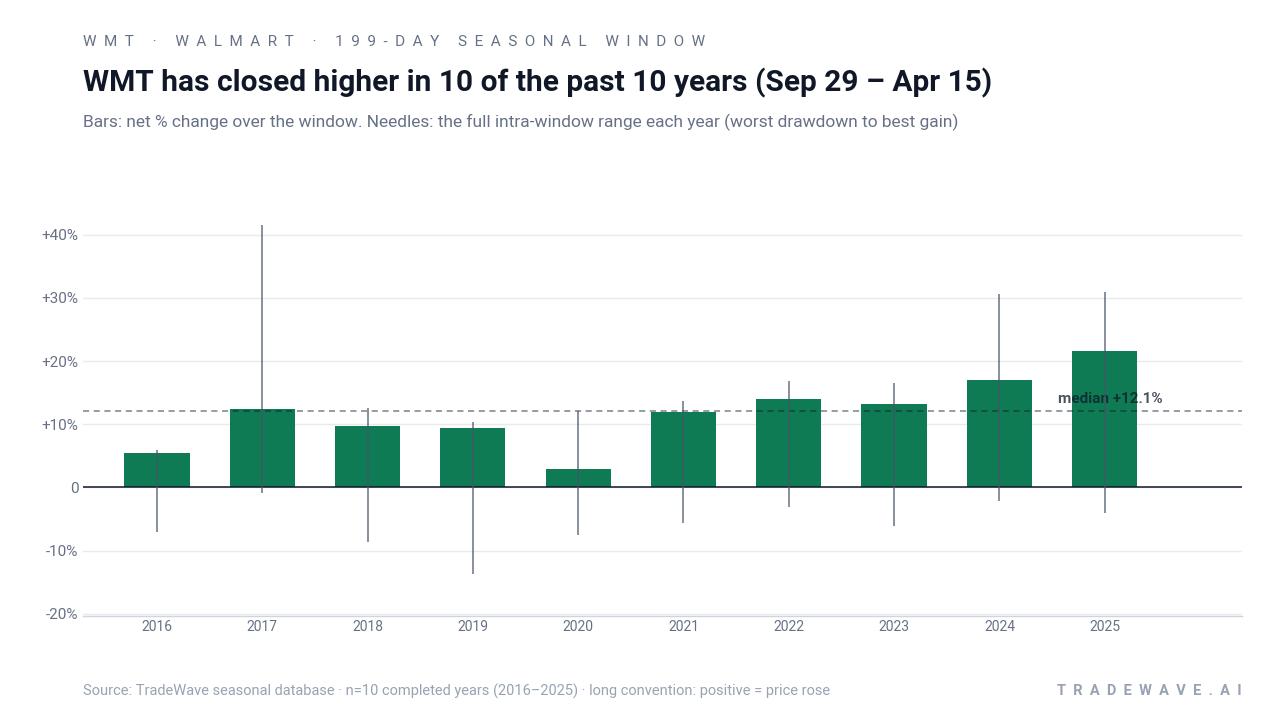
The maximum favorable move, or best intraperiod run-up, has often been much larger than the final net gain. In 2017 and 2024, for instance, Walmart’s best point-to-peak moves inside the window reached 41.49% and 30.69% even though the final closes were up 12.39% and 16.95%. On the downside, the maximum adverse move, or worst drawdown from entry, has ranged from a relatively mild -2.19% in 2024 to a deeper -13.67% in 2019, showing that even in winning years the stock has sometimes tested traders’ patience before recovering.
The trend profile suggests that strength has not been confined to a single month. Several years, including 2022 and 2025, show Walmart grinding higher through much of the window rather than spiking early and fading. The cumulative return chart for this seasonal slice climbs steadily from 2016 through 2025, with no major givebacks, which is unusual for a single-stock pattern over a decade.
History does not guarantee future results; adverse excursions can be large even in winning windows, and traders should respect the potential for double-digit drawdowns inside an otherwise bullish seasonal trend.
Why does Walmart (WMT) follow this seasonal pattern?
One likely driver is the way Walmart’s fiscal calendar lines up with consumer spending cycles, from back-to-school and holiday shopping through post-holiday clearance and early-year essentials. Analysts have pointed to the company’s role as a value retailer that captures both budget-conscious and higher-income shoppers during these periods, which can support steady traffic and sales growth.[3][5] The pattern may also reflect institutional portfolio positioning around Walmart’s earnings cadence and dividend flows, as large investors rebalance exposure to defensive retail heading into and out of the holiday quarter.
What is driving Walmart (WMT) today?
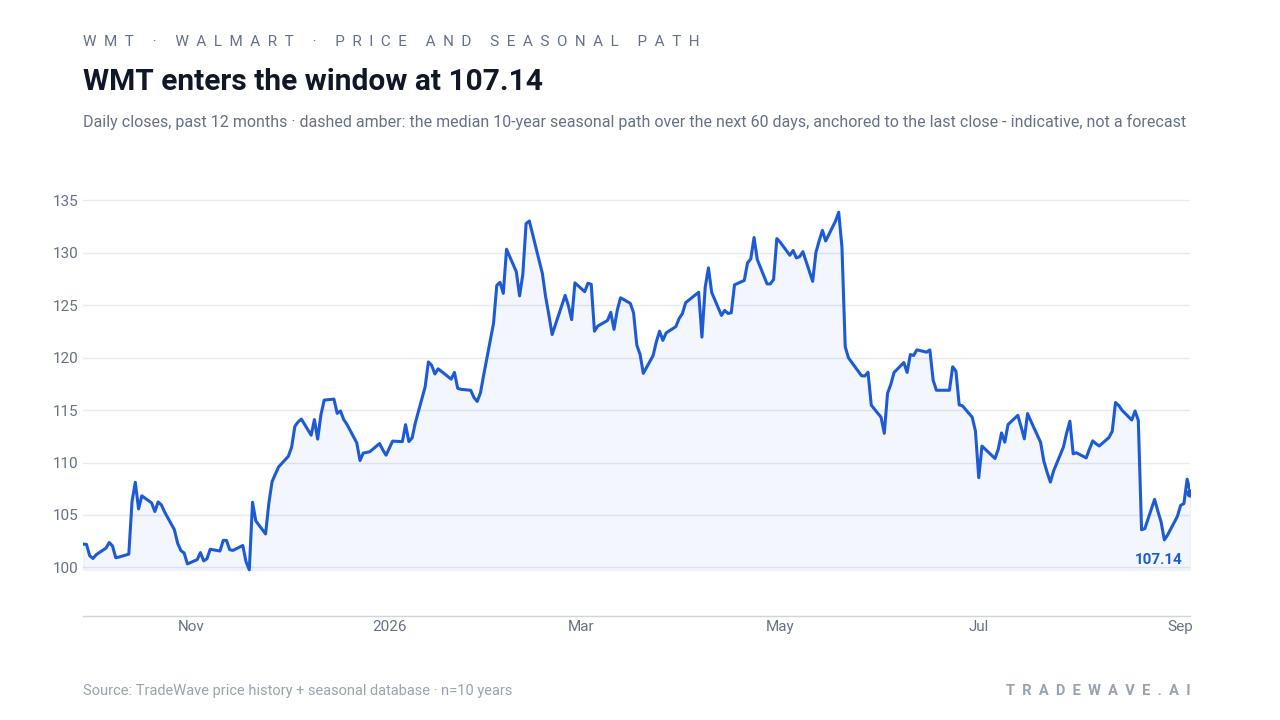
Walmart closed the latest session at 110.12, up 2.5% on the day, with the stock trading about 18.1% below its 52-week high of 134.52 and roughly 13.2% above its 52-week low of 97.24. The move comes as investors look ahead to the next earnings report scheduled for Feb 19, 2026, covering the holiday-heavy Q4 FY2026 period, after the company last reported strong revenue growth but paired it with a cautious forward outlook that weighed on sentiment at the time.[1][3]
In Feb 2026, Walmart posted revenue of about $190.7 billion for its prior holiday quarter, up 5.6% year over year, with GAAP net income of $4.24 billion and adjusted EPS a penny above FactSet estimates, but management’s guidance for the following fiscal year came in below consensus.[1][3] Around the same time, commentary highlighted that Walmart’s lower-price strategy had continued to attract higher-income shoppers, reinforcing its position as a defensive consumer staple with growing e-commerce sales above 20% in that quarter.[3][5] Sector analysis has since framed Walmart as a dominant discount retailer with moderate top-line growth and thin margins typical of the space, a profile that often keeps the stock in focus when investors rotate toward value and resilience.[5]
The chart below places the latest bounce in the context of Walmart’s past year of trading and the typical seasonal path over the next two months.
What are analysts watching in Walmart’s next earnings report?
Walmart’s upcoming Q4 FY2026 report on Feb 19, 2026 will again cover the critical holiday quarter, a period that has historically overlapped with the heart of this bullish seasonal window.[3] In Feb 2026, the company guided for current-quarter sales growth of 3.5% to 4.5% and EPS of $0.63 to $0.65, with full-year sales around $706.4 billion and EPS near $2.64, a stance that several outlets described as conservative relative to Street expectations.[1][3] The Street will be watching whether management maintains that cautious tone or leans more constructive on FY27, especially given ongoing share gains among higher-income shoppers and continued e-commerce momentum.[3][5]
How does the macro backdrop shape Walmart’s seasonal outlook?
Walmart’s seasonal strength from late September through mid-April lines up with a macro backdrop where value retail has often been a refuge when consumers feel pressure from inflation or economic uncertainty. In Feb 2026, reporting highlighted how Walmart’s low-price positioning had broadened its customer base to include more affluent households, helping sustain sales even as shoppers traded down from other retailers.[3] That dynamic can matter inside this window, since it spans the holiday season, tax refund period, and early spring, all times when household budgets and price sensitivity are front and center.
Within the consumer staples and retail sector, Walmart remains a heavyweight with moderate revenue growth around 4% to 5% and structurally low operating margins, a combination that tends to attract investors seeking stability rather than explosive upside.[5] The historical seasonality suggests that this defensive profile has not prevented the stock from delivering strong multi-month runs during this part of the calendar, especially when macro worries push flows toward large, diversified retailers.
How does valuation fit into Walmart’s seasonal pattern?
Valuation commentary earlier in 2026 framed Walmart as a steady compounder rather than a deep-value play, with investors paying up for its scale, cash generation, and defensive characteristics.[4][5] That backdrop matters for the seasonal pattern because a stock that rarely looks outright cheap can still deliver attractive returns if its strongest fundamental and sentiment tailwinds cluster in the same part of the year. The 11.63% annualized return and 1.8 Sharpe ratio for this 199-day window suggest that, historically, investors who were willing to own Walmart through the holiday and post-holiday stretch have been compensated for that valuation premium.
What should traders watch as Walmart (WMT) enters this window?
First, the calendar. The next iteration of this 199-day window begins on Sep 29 and runs through Apr 15, overlapping Walmart’s key holiday quarter, its February earnings release, and the early spring spending period. Historically, the stock has not needed a perfect macro backdrop to post gains in this stretch, but the timing of earnings and guidance updates has often shaped the path inside the window rather than the final outcome.
Second, levels. With Walmart closing at 110.12 and the 52-week high up at 134.52, traders will be watching how the stock behaves around recent support near the low 100s and whether it can build a base that allows any seasonal tailwind to play out. A pattern where pullbacks stay shallower than the worst historical drawdowns, such as the -13.67% seen in 2019, would be one sign that the current tape is tracking the stronger years in the sample.
Third, earnings and guidance tone. The Feb 19, 2026 report will land squarely inside the window and could either reinforce or challenge the historical pattern depending on how management frames FY27 sales and profit growth.[1][3] If Walmart continues to highlight share gains among higher-income shoppers and sustained e-commerce growth, that would echo the backdrop seen in several of the stronger seasonal years.[3][5]
Finally, sector and macro flows. Because Walmart sits at the crossroads of consumer staples and broad retail, any renewed rotation into defensive names or value-oriented consumer stocks could amplify the typical seasonal bias. Conversely, a sharp shift back toward high-growth cyclicals or a major macro shock that hits household budgets could test the durability of a pattern that has been flawless on paper for a decade. The history is clear: 10 for 10 is a rare record for a single-stock seasonal window, and how Walmart trades through this next cycle will show whether that streak can extend to year eleven.
Sources
- Seeking Alpha - Walmart turns lower after profit outlook overshadows solid holiday quarter
- CNBC - Check out Walmart's stock price (WMT) in real time - CNBC
- Associated Press - Walmart delivers another quarter of impressive sales but offers a muted outlook
- Forbes - Buy Or Sell Walmart Stock?
- Forbes - How Walmart Is Defending Its Crown Against Competitors
- Barchart - Walmart Stock’s Extended Downturn Could Trigger a Possible Comeback
- SEC / Walmart 10-K filing - EX-19 - 10-K: Annual report (Insider Trading Policy) | Walmart Inc. (WMT)
About this seasonal analysis
Seasonal pattern data is sourced from TradeWave.ai, which analyzes historical price behavior across annual calendar windows going back up to 30 years. Read the full data methodology or the book The 100-Year Pattern by Afshin Moshrefi (2026 edition). Past performance of seasonal patterns does not guarantee future results. This article is for informational purposes only and does not constitute investment advice.