Amphenol (APH) Has Risen in 8 of 8 Midterm Windows From Sep 18, Averaging 11.66% Gains
Amphenol just stepped into a historically strong 202-day seasonal window as shares trade about 8.2% below their 52-week high and investors digest AI-driven growth and a fresh stock split.
Price as of Sep 18, 2026: $77.55 (last close).

What is the seasonal pattern for Amphenol (APH)?
Amphenol has risen in 8 of 8 midterm-year windows starting around Sep 18, with an average gain of 11.66% in winning years.
- 8 for 8 in this window, averaging 11.66% gains in winning years across the last 8 midterm election cycles.
- Seasonal bias is bullish from Sep 18 for 202 days, covering the late midterm election year into the pre-election year.
- Percent Profitable is 100.0%, with 8 winners and 0 losers in the historical sample.
- Trade Direction is long, supported by a Sharpe ratio of 3.08 and a TradeWave Ratio of 2.46 that points to strong trend follow-through.
- Individual years have seen sizable swings, with best intra-window rallies above 30% and worst drawdowns deeper than 20% in some cycles.
- Cumulatively, repeating this Amphenol trading window would have compounded to about 140.99% across the eight completed midterm-year samples.
According to historical data from TradeWave.ai, this specific midterm-year stretch for Amphenol has behaved very differently from an average calendar period, and the latest iteration has just begun.
How strong is Amphenol (APH) in this Sep 18 to Apr 7 seasonal window?
Amphenol has risen in 8 of the last 8 midterm election years during the 202-day window that starts around Sep 18, posting an average gain of 11.66% across those cycles. The stock entered this year’s window at 77.55, about 8.2% below its 52-week high of 84.48 and more than double its 52-week low, after a powerful run that has left it up roughly 102.6% over the past month.
Because this pattern is grouped by the presidential election cycle, it captures how Amphenol tends to trade as markets wrap up a midterm election year and transition into the year before the presidential election. That phase often coincides with clearer policy visibility, steadier fiscal planning and, for large technology suppliers, a more confident capital spending backdrop as corporate budgets reset.
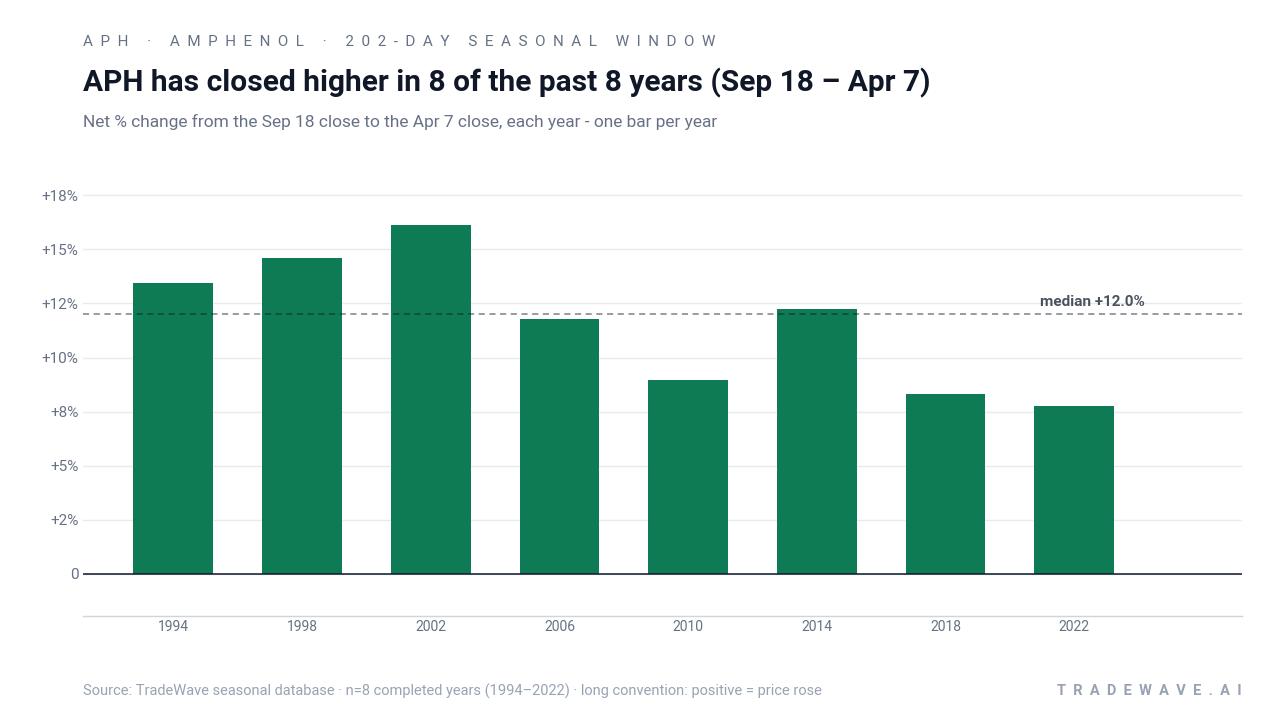
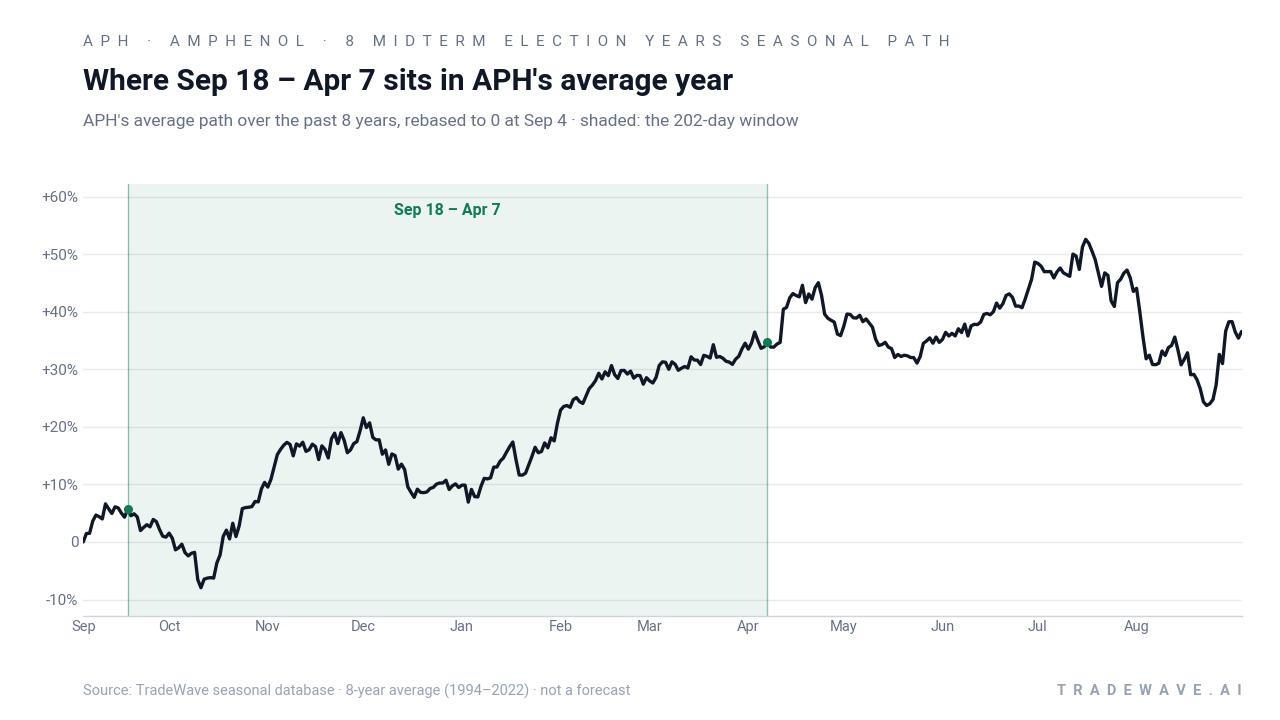
Year-by-year ranges show how much Amphenol has typically swung inside this window before finishing higher.
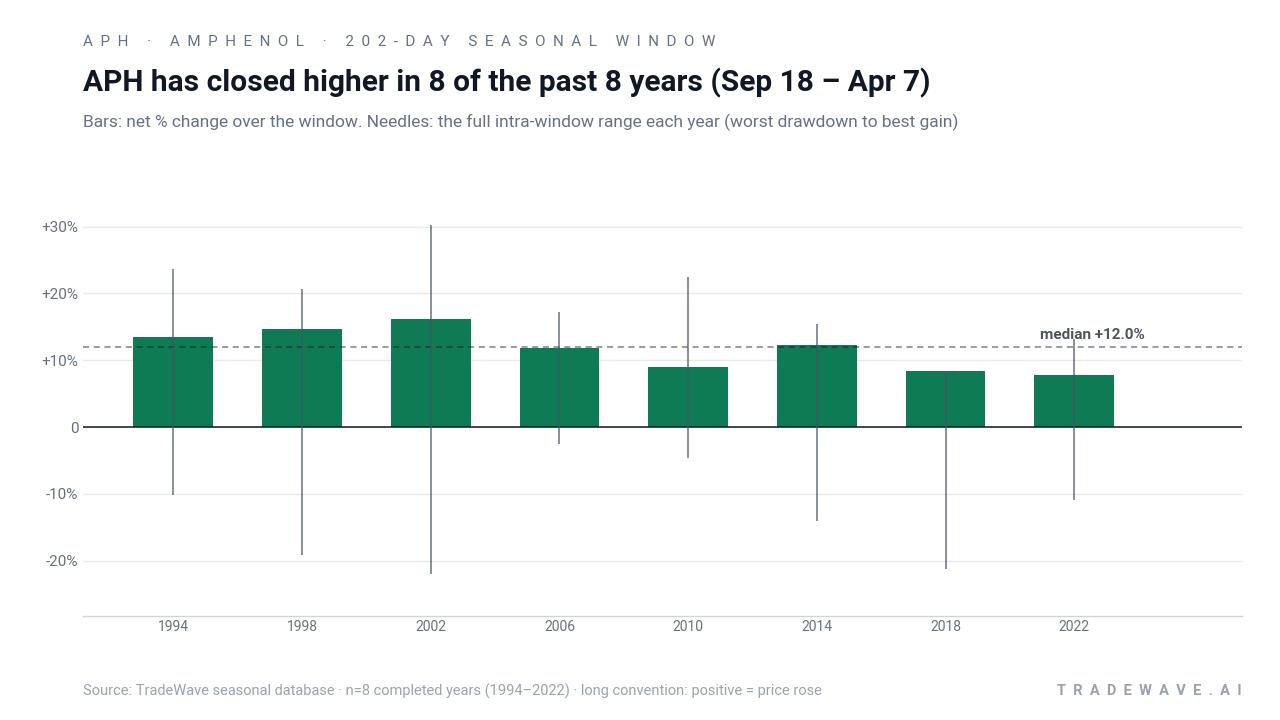
Across the eight completed midterm-year samples, the strongest year was 2002, when Amphenol gained 16.11% between the Sep 18 entry and the Apr 7 exit while its best intraperiod rally reached 30.18% and the worst drawdown from entry hit 21.94%. At the softer end, 2022 still finished up 7.76% but saw a maximum favorable move of 13.24% and an adverse excursion of 10.88%, underscoring that even “winning” years have involved meaningful swings.
The cumulative chart of this Amphenol trading window compounds to about 140.99% across the eight midterm-year iterations, which means that simply repeating this 202-day slice would have more than doubled capital over the sample. The Sharpe ratio of 3.08 reflects that the end-of-window outcomes have been unusually consistent for a single-stock pattern, even though the intraperiod path has sometimes been volatile.
From a trend perspective, the historical seasonal average suggests that gains have tended to build gradually rather than in a single burst, with several years showing early strength followed by consolidation and a second leg higher closer to the spring. That fits with a narrative where investors respond first to late-year macro clarity and then to early-year earnings and budget resets in the technology and electronic components sector.
History does not guarantee future results; adverse excursions can be large even in winning windows, and Amphenol has previously seen drawdowns of more than 20% inside this pattern before finishing higher.
Why does Amphenol (APH) follow this seasonal pattern?
One likely driver is the clustering of corporate IT and communications infrastructure budgets, which often get finalized late in the midterm election year and deployed through the following spring as policy uncertainty eases. Analysts have also pointed to sector rotation into technology hardware and electronic components as investors position for the historically stronger year before the presidential election, a phase that has often favored growth and capital spending. For a diversified connector and interconnect supplier like Amphenol, that combination of clearer policy, fresh budgets and sector flows may help explain why this specific Sep 18 to Apr 7 window has been so consistently positive in past midterm cycles.
What is driving Amphenol (APH) today?
Amphenol closed Monday at 77.55, down 1.0% on the day, after a blistering stretch that has left the stock more than 100% higher over the past month and about 8.2% below its 52-week high of 84.48. The move comes on the heels of a 2-for-1 stock split that took effect on Sep 3, 2026, a mechanical change that often boosts liquidity and broadens retail participation without altering the company’s underlying value.[1]
The fundamental backdrop remains tied to AI-driven demand and robust communications spending. In late July, Amphenol reported Q2 2026 results that beat expectations, with revenue around $8.30 billion and a double-digit EPS surprise, helped by a 43% surge in IT datacom sales and strong orders across communications solutions and harsh-environment systems.[4][6] Management’s guidance around that report framed the quarter as part of a broader upcycle in connectivity and sensor demand tied to cloud, data center and industrial applications.[6]
Short interest looks contained relative to the company’s size, with about 13.6 million shares sold short as of Aug 31, representing 0.56% of the float and a days-to-cover ratio of 2.4, according to MarketBeat.[7] That positioning suggests there is not a large cohort of bearish investors betting aggressively against the stock, even after its sharp run and the structural tailwinds from AI and digital infrastructure spending highlighted in recent coverage.[2][3]
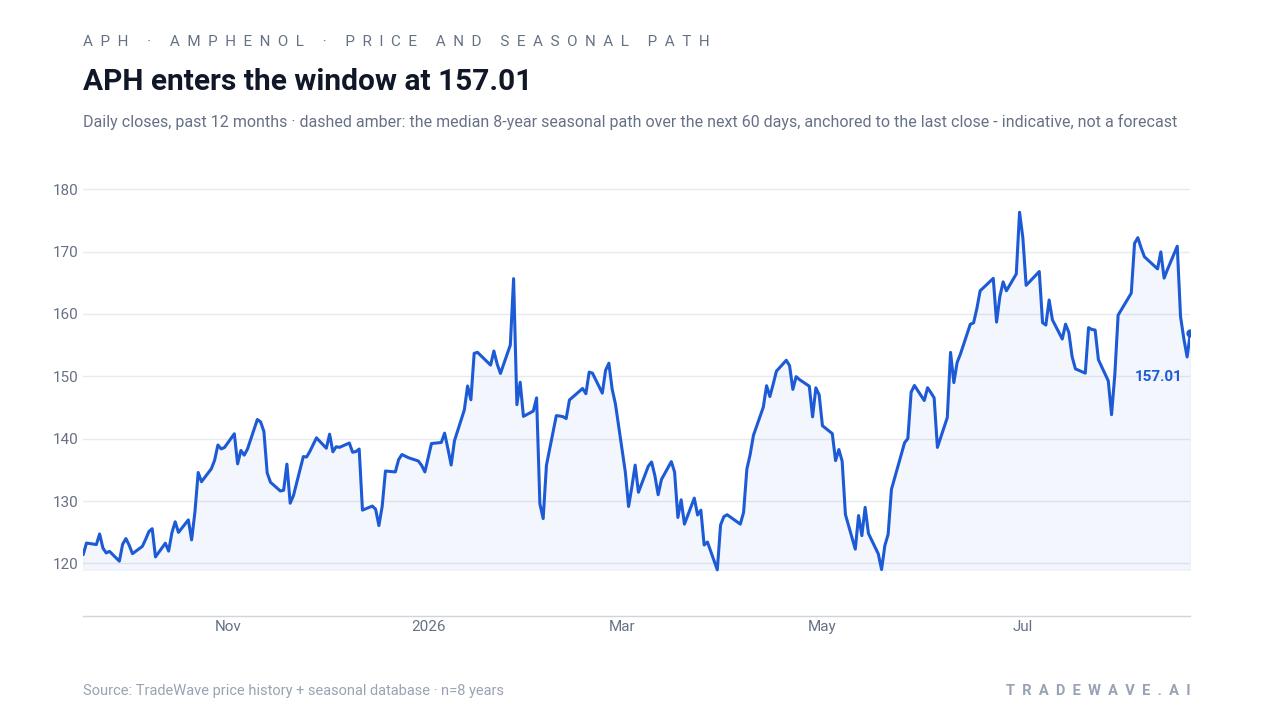
The chart below shows how Amphenol’s latest pullback fits into its 12-month rally, alongside the median 60-day seasonal path for this window.
What should traders watch in this Amphenol seasonal window?
First, watch how Amphenol trades around the 80 to 84 range, which brackets the recent highs and sits just below the 52-week peak. A sustained push back toward that band during the early part of the Sep 18 to Apr 7 window would be consistent with the historical pattern of gradual gains, while a deeper break below the recent low near 77 could signal a more volatile path than prior midterm cycles.
Second, keep an eye on the next set of earnings and any updates on AI-related demand, particularly in IT datacom and communications solutions, which drove much of the Q2 2026 upside.[4][6] If management continues to highlight strong order trends and capacity expansion, that would reinforce the sector backdrop that has historically supported this APH seasonal trend.
Third, monitor short interest and liquidity metrics in the wake of the stock split.[1][7] A meaningful build in short positioning or a sharp drop in trading volume would mark a departure from the relatively balanced setup seen heading into this window and could interact with the historical seasonality to either amplify rallies through squeezes or deepen drawdowns if sentiment turns.
Finally, because this window straddles the end of the midterm election year and the start of the year before the presidential election, policy headlines around fiscal spending, industrial policy and technology regulation will matter. If the market leans into a “risk-on” pre-election playbook with continued enthusiasm for AI infrastructure, behavior that tracks the historical pattern of steady gains would not be surprising. A sharp divergence from that script, especially if accompanied by weaker earnings or tighter policy, would be the clearest sign that this time is different from the last eight midterm-year windows.
Sources
- MarketBeat - Amphenol (APH) Stock Price, News & Analysis
- Yahoo Finance (Company Quote) - Amphenol Corporation (APH) Stock Price, News, Quote & History - Yahoo Finance
- Yahoo Finance / Zacks (article) - Surging Earnings Estimates Signal Upside for Amphenol (APH) Stock
- Yahoo Finance (article) - Is Amphenol Stock a Smart Buy Before Q2 Earnings Report?
- Morningstar - APH Stock Price Quote | Morningstar
- Yahoo Finance (Earnings recap) - Amphenol (APH) Q2 Earnings: Taking a Look at Key Metrics Versus Estimates
- MarketBeat (Short Interest) - Amphenol (APH) Short Interest & Short Float | Updated Sep 2026
About this seasonal analysis
Seasonal pattern data is sourced from TradeWave.ai, which analyzes historical price behavior across annual calendar windows going back up to 30 years. Read the full data methodology or the book The 100-Year Pattern by Afshin Moshrefi (2026 edition). Past performance of seasonal patterns does not guarantee future results. This article is for informational purposes only and does not constitute investment advice.