General Mills (GIS) Has Gained in 10 Straight Midterm Sep-May Windows, Averaging 16.6%
General Mills is stepping into a historically powerful Sep–May seasonal stretch just as the stock trades well below its 52-week high and heads into an earnings test.
Price as of Sep 18, 2026: $36.32 (last close).

What is the seasonal pattern for General Mills (GIS)?
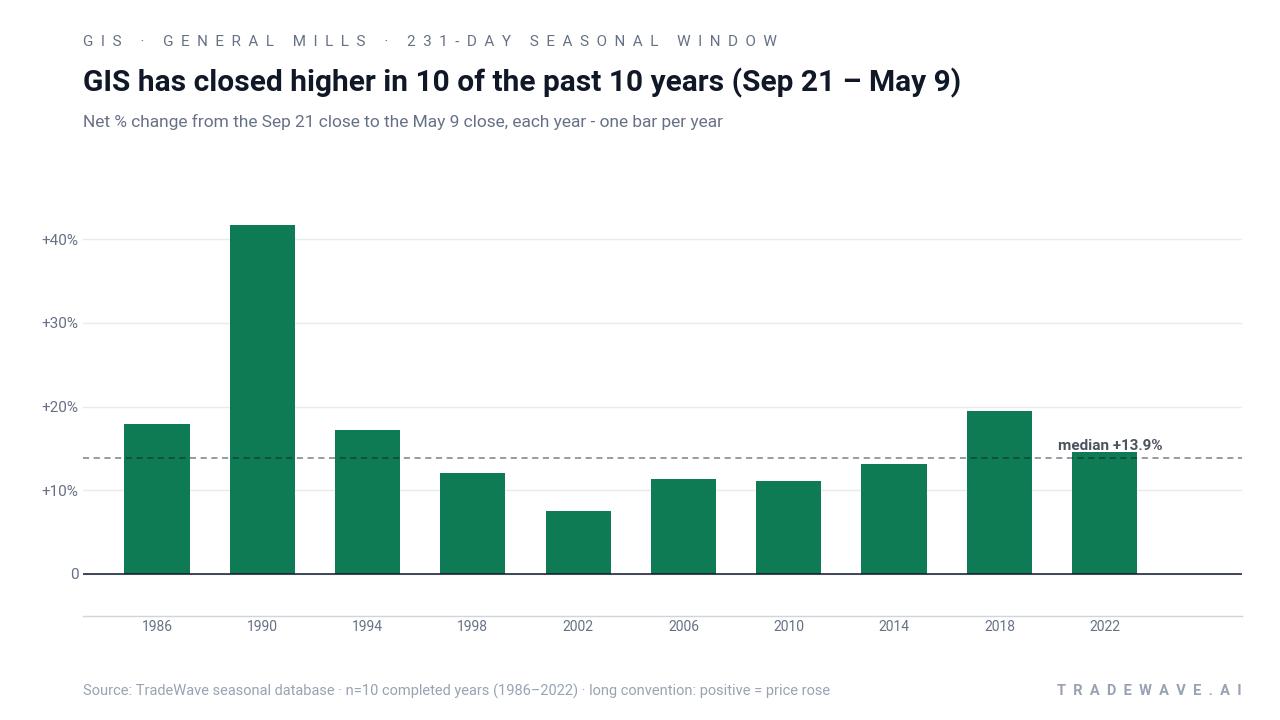
General Mills has risen in 10 of 10 midterm-year Sep 21–May 9 windows, with an average gain of 16.6% in winning years.
- 10 for 10 in this window, averaging 16.6% gains in winning years across the last 10 midterm election cycles.
- Percent Profitable is 100.0%, with 10 winners and 0 losers for long trades in the 231-day Sep 21–May 9 stretch.
- The window aligns with the concluding midterm election year and runs into the start of the pre-election year, a phase that has often favored Consumer Staples stocks.
- Average profit of 16.6% comes with meaningful swings inside the window, including historical worst drawdowns of up to 17.15% before recovering.
- Cumulative return from repeatedly holding only this window across the 10 midterm years reaches 351.72%, highlighting how concentrated the GIS seasonal trend has been.
- Trade Direction is long, with a TradeWave Ratio of 1.63 and a Sharpe ratio of 1.48, pointing to historically strong risk-adjusted performance for this specific calendar slice.
According to historical data from TradeWave.ai, this is not just another earnings week for General Mills but the opening day of a long-running seasonal regime that has behaved very differently from an average year. The next section looks at how that pattern has played out across past midterm election cycles and what it implies for the coming months.
How has General Mills (GIS) traded in this Sep–May midterm-year window?
General Mills has posted gains in every single Sep 21–May 9 window across the last 10 midterm election years, averaging a 16.6% rise for long positions. The stock enters this year’s iteration at 36.32, about 21.6% below its 52-week high and down 21.89% year to date, so the historical tailwind is arriving against a weak price backdrop. That combination of a beaten-up Consumer Staples name and a historically strong seasonal window is exactly the kind of setup election-cycle traders look for.
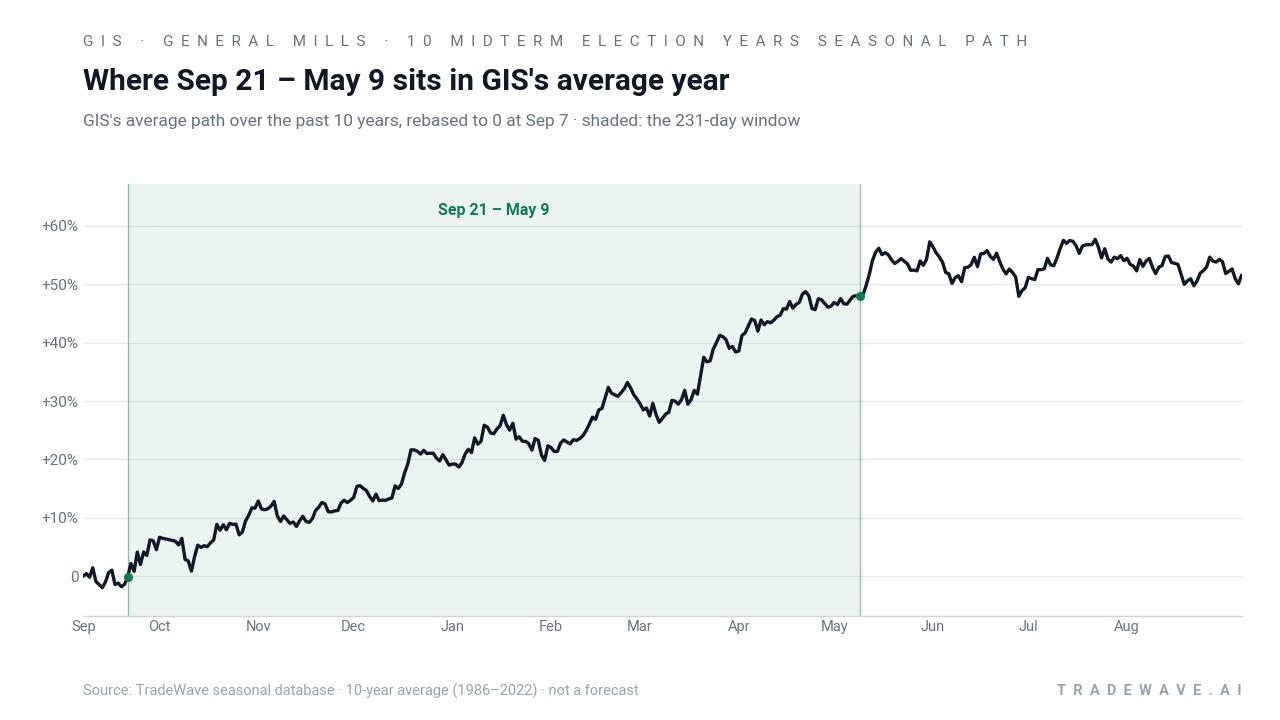
Grouping the data by the presidential election cycle matters here because Consumer Staples names like General Mills often behave differently when Washington is in mid-cycle rather than in the heat of a presidential race. The current pattern phase is the late part of the midterm election year, and this 231-day window runs from Sep 21 into early May of the year before the presidential election, a stretch that has historically lined up with more supportive policy tone and steadier risk appetite for defensive sectors.
Across the 10 midterm election years in the sample, the trade direction for this window is firmly long. Percent Profitable sits at 100.0%, with 10 winners and 0 losers, and the average profit of 16.6% means that even the “typical” year has delivered a double-digit gain by the time the window closes. Median profit of 13.87% shows that the distribution is not just skewed by one or two outliers, and the annualized return of 16.28% and Sharpe ratio of 1.48 point to a historically strong risk-adjusted profile for this specific slice of the calendar.
The per-year table shows how that plays out in practice. The strongest year in the sample was 1990, when General Mills gained 41.67% between the Sep 21 entry and the May 9 exit, with a maximum favorable move of 49.5% and a relatively shallow worst drawdown of 3.78% from the entry. The softest outcome was 2002, which still finished up 7.48% but saw a maximum adverse move of 6.69% before recovering, illustrating that even winning years can involve uncomfortable dips along the way.
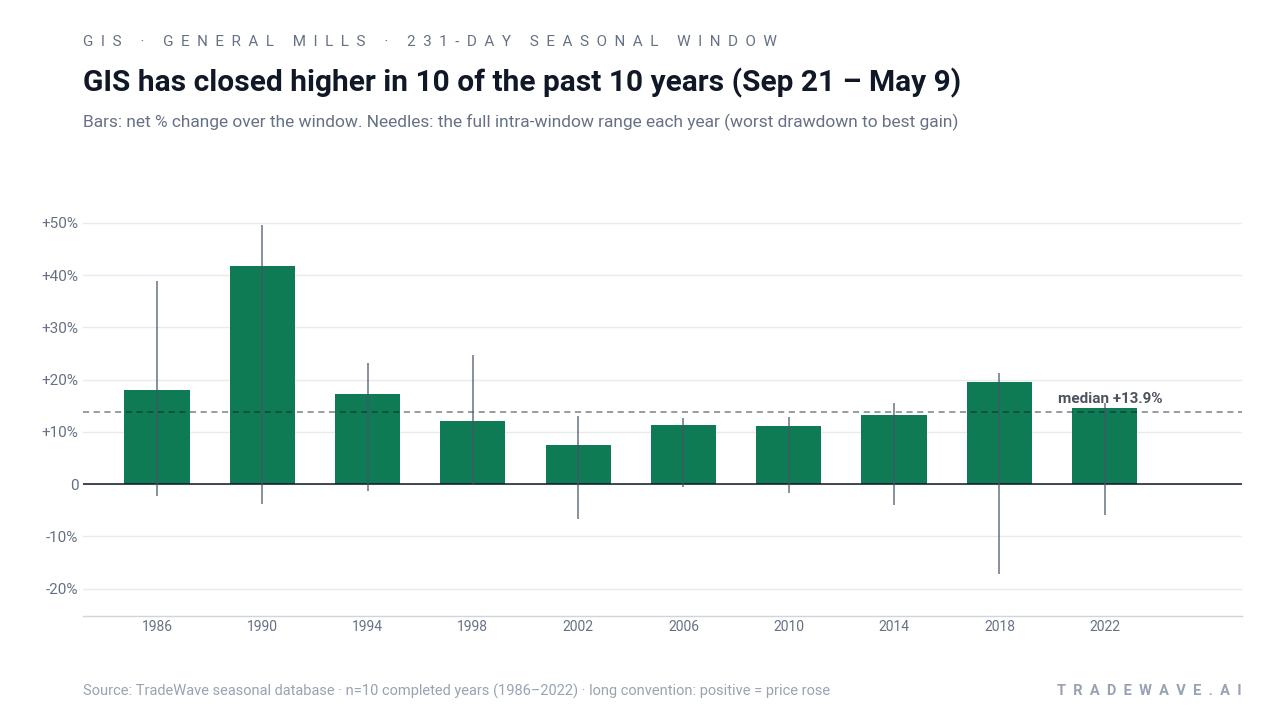
Looking at intraperiod swings, the maximum favorable move has ranged from 12.59% to 49.5% across the sample, while the maximum adverse move has stretched as far as a 17.15% drawdown in 2018 before the stock closed the window up 19.5%. That profile fits a long pattern where upside has tended to dominate by the end of the window, but where traders have had to sit through mid-course volatility. The TradeWave Ratio of 1.63 captures that tendency for price to travel meaningfully in the trade direction within the window, independent of the final close.
A second view stacks yearly net returns with their full intraperiod ranges, highlighting how upside and drawdowns have coexisted in this window.
The cumulative chart for this pattern compounds those 10 midterm-year windows into a 351.72% total return, underscoring how much of General Mills’ long-run performance has clustered in this specific part of the election cycle. Add it up: 10 for 10, double-digit average gains, and a long-only profile that has historically rewarded patience through drawdowns. History does not guarantee a repeat, but the consistency across decades is hard to ignore.
History does not guarantee future results; adverse excursions can be large even in winning windows, and past MAE levels show that drawdowns of more than 10% have occurred inside this pattern.
Why does General Mills (GIS) follow this seasonal pattern?
One likely driver is the way Consumer Staples earnings and guidance cluster around the late-year holiday season and early-year budgeting cycle, which often supports packaged-foods demand and visibility. Analysts have also pointed to institutional portfolio repositioning around the midterm-to-pre-election transition, when investors often lean back into defensive names as policy uncertainty shifts from Congress to the coming presidential race. For a company like General Mills, whose brands sit squarely in everyday grocery baskets, those consumer spending cycles and asset-allocation flows may help explain why this Sep–May window has been so consistently favorable in midterm election years.
What is driving General Mills (GIS) today?
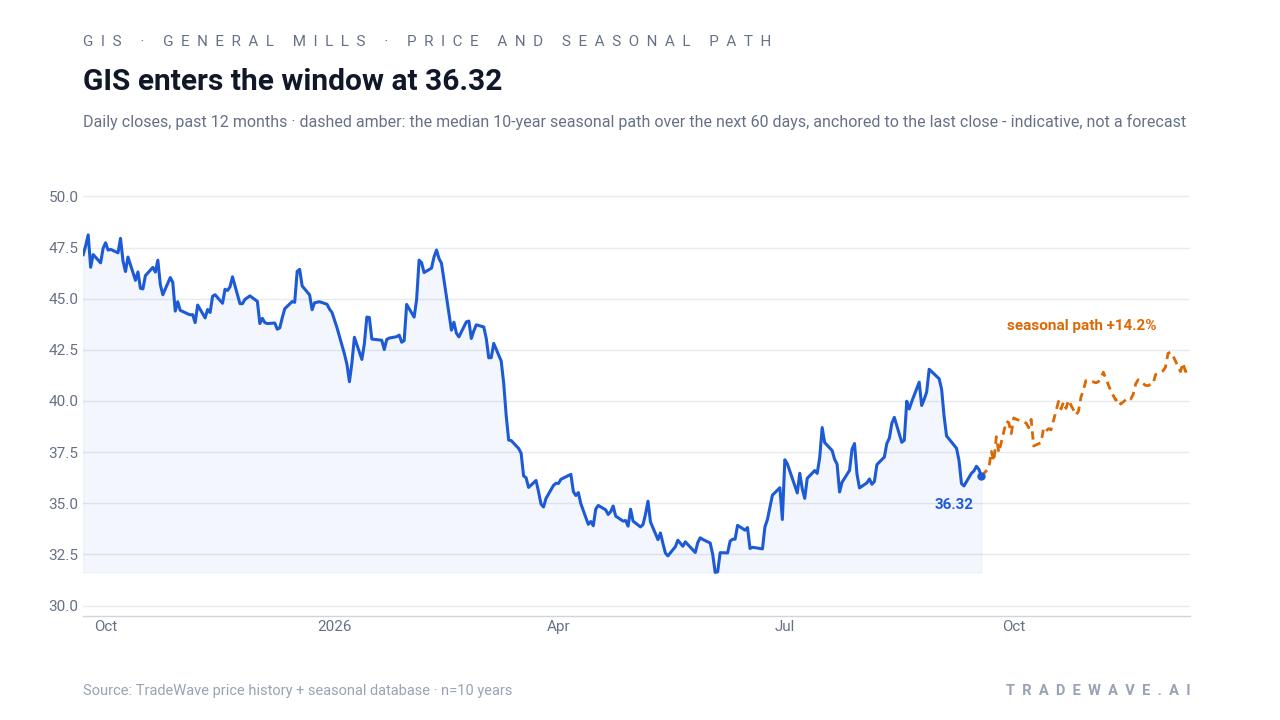
General Mills closed Monday at 36.32, down 0.93% on the day and roughly 21.6% below its 52-week high of 46.34, leaving the stock deep in negative territory for 2026 with a year-to-date decline of 21.89%. The move comes just two days before an estimated earnings date of Sep 23, 2026, when the company is expected to update investors on a fiscal 2026 that saw net sales of $18.4 billion, a net loss of $88 million and mixed quarterly EPS beats and misses across the year.[2] Barron’s lists the stock with a consensus Hold rating and a blended price target around 37.12, only slightly above the current quote, suggesting Wall Street sees limited upside until the earnings narrative improves.[3]
In the Consumer Staples and packaged-foods space, General Mills has been reshaping its portfolio by selling mature businesses and acquiring growth brands, a strategy that aims to balance slower legacy categories with higher-growth niches.[2] That repositioning sits alongside product moves such as Old El Paso’s expansion into broths and soups, which could modestly support top-line growth in center-store grocery aisles over time. For investors, the question is how quickly those shifts can offset cost pressures and volume softness that have weighed on fiscal 2026 results.
Short interest has also crept higher. Barron’s reports roughly 46 million GIS shares sold short, with short interest up 2.91% and representing about 8.64% of the float, a meaningful level for a large-cap staples name.[3] MarketBeat and other trackers show a steady drumbeat of insider transactions, including both executive sales and purchases, which together paint a picture of active but not one-sided insider positioning.[6][7] Earlier in 2026, ChartMill flagged an unusual volume day on Mar 18, when GIS fell 2.74% on volume more than 24% above average, a reminder that even a defensive stock can see sharp single-day moves when positioning and news collide.[8]
The chart below puts the latest pullback and the opening of the Sep–May window in the context of the past year’s trading range and the median 60-day seasonal path.
What should traders watch in this General Mills (GIS) seasonal window?
First, the earnings print around Sep 23 will set the tone for how the market treats this historically strong window: a clean beat and constructive commentary could let the seasonal pattern work from a low base, while another disappointment might keep GIS pinned despite the backdrop.[2] Second, price action around the 36 level and the 50-day moving average near 37.83 will show whether sellers remain in control or if buyers start leaning into the midterm-year seasonal trend. Third, watch short interest and volume: if the 8.64% short base begins to shrink on rising volume, that would signal shorts respecting the historical Sep–May bias, whereas a further build in short interest would suggest traders are willing to fight the pattern.[3] Finally, as the window progresses into early 2027, behavior relative to the historical drawdown profile will matter; if GIS can avoid the kind of double-digit intraperiod dips seen in years like 2018 while still tracking higher, it would mark a cleaner, less volatile iteration of a pattern that has already been 10 for 10.
Sources
- Yahoo Finance (Analysis page) - General Mills, Inc. (GIS) Analyst Ratings, Estimates & Forecasts - Yahoo Finance
- The Motley Fool - General Mills - GIS - Stock Price & News | The Motley Fool
- Barron's - GIS | General Mills Inc. Stock Overview (U.S.: NYSE) | Barron's
- Markets Insider (Business Insider) - General Mills Stock Price | GIS Stock Quote, News, and History | Markets Insider
- Yahoo Finance (Quote page) - General Mills, Inc. (GIS) Stock Price, News, Quote & History - Yahoo Finance
- MarketBeat - GIS News Today | Why did General Mills stock go down today?
- MarketBeat (Insider trades) - General Mills (GIS) Insider Trading Activity 2026
- ChartMill - Which S&P500 stocks have an unusual volume on Wednesday?
- ChartMill (profile) - GIS Stock Price, Quote & Chart | ChartMill.com
About this seasonal analysis
Seasonal pattern data is sourced from TradeWave.ai, which analyzes historical price behavior across annual calendar windows going back up to 30 years. Read the full data methodology or the book The 100-Year Pattern by Afshin Moshrefi (2026 edition). Past performance of seasonal patterns does not guarantee future results. This article is for informational purposes only and does not constitute investment advice.