Cooper Companies (The) (COO) Has Risen in 9 of 9 Midterm Windows, Averaging 30.53% Gains
Cooper Companies (The) is slumping in 2026 after weak guidance, but an October seasonal window that has never produced a losing midterm-year stretch is about to open.
Price as of Sep 16, 2026: $54.61 (last close).

What is the seasonal pattern for Cooper Companies (The) (COO)?
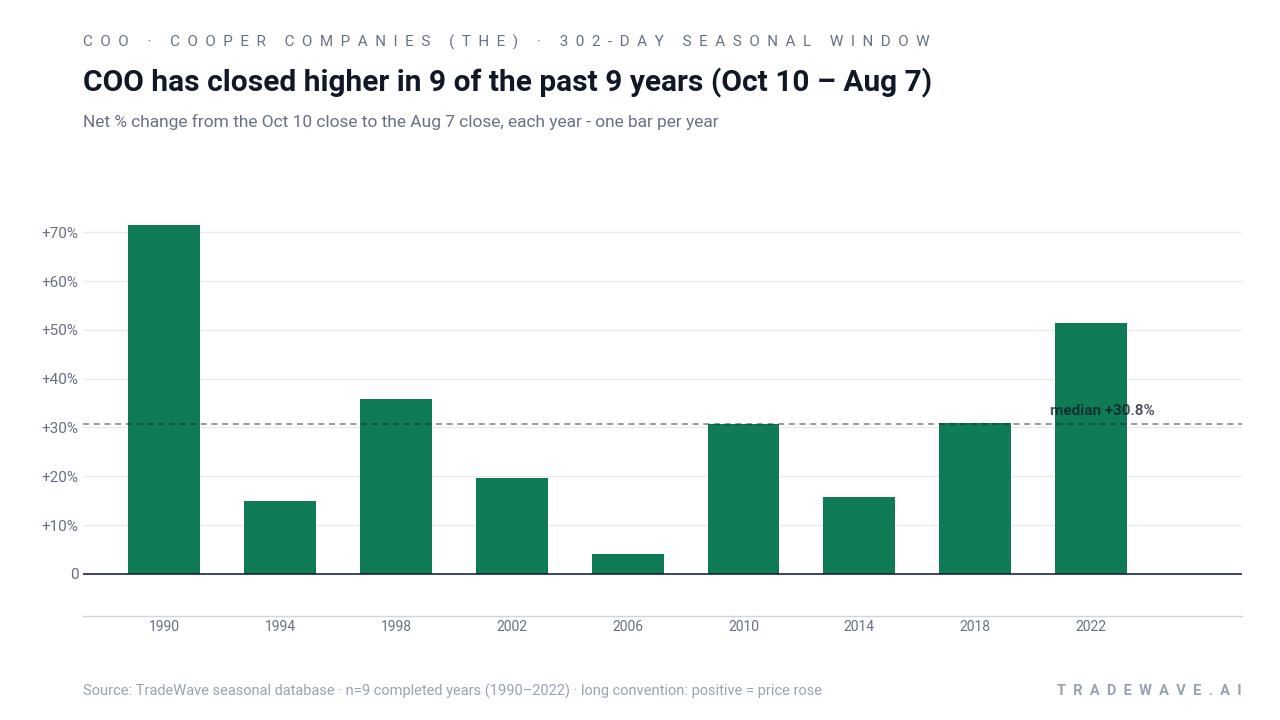
Cooper Companies (The) has risen in 9 of 9 midterm-election-year windows from Oct 10 to Aug 7, with an average gain of 30.53% in winning years.
- 9 for 9 in this window, averaging 30.53% gains in winning years across the last 9 midterm election cycles.
- The upcoming 302-day trading window runs from Oct 10 to Aug 7 and has historically favored long positions in COO.
- Percent Profitable is 100.0%, with 9 winners and 0 losers across the historical sample.
- Average profit of 30.53% per completed window comes with a Sharpe ratio of 1.32 and a TradeWave Ratio of 1.33.
- Intraperiod swings have been meaningful, with some years showing double-digit drawdowns even as the window ultimately finished higher.
- The pattern is tied to the last 9 midterm election years, a phase that often precedes stronger pre-election-year performance for U.S. equities.
According to historical data from TradeWave.ai, this midterm-election-year stretch in COO has behaved very differently from an average year, and the next iteration is only weeks away.
How has Cooper Companies (The) (COO) traded in this midterm-year window?
Cooper Companies (The) has closed higher in every one of the last 9 midterm-election-year windows from Oct 10 to Aug 7, averaging gains of 30.53% per cycle. Shares finished Thursday at 54.61, leaving the stock about 39.2% below its 52-week high of 89.83 and down 33.37% year to date. That combination of a bruised chart and a spotless seasonal record gives this upcoming COO trading window unusual weight for investors trying to decide whether the selloff has gone too far.
The presidential election cycle matters here because this pattern is built only from midterm election years, a phase that often sees policy uncertainty give way to a more supportive backdrop as markets pivot toward the pre-election year. For a healthcare name like Cooper, that has historically meant investors look past near-term noise and refocus on structural demand for contact lenses and fertility services as Washington gridlock limits big legislative shocks.
Across the nine historical midterm-year samples, the trade direction is long, and every single window finished in the green. The strongest year in the dataset was 1990, when COO gained 71.42% between the Oct 10 entry and the Aug 7 exit, while the softest outcome was 4.14% in 2006, still a positive result over the 302-day stretch. Average profit of 30.53% and a median outcome of 30.8% show that the wins have not been driven by a single outlier year.
Intraperiod swings have been real. In 1994, for example, COO ultimately finished the window up 15.01%, but at one point it was down 29.99% from the entry before recovering. By contrast, 2010 delivered a 30.8% net gain with almost no downside from the starting point, as the worst drawdown was just 0.25%. That mix of deep but recoverable drawdowns in some years and relatively smooth climbs in others is what the TradeWave Ratio of 1.33 is flagging: the stock has typically traveled meaningfully in the trade direction during the window.
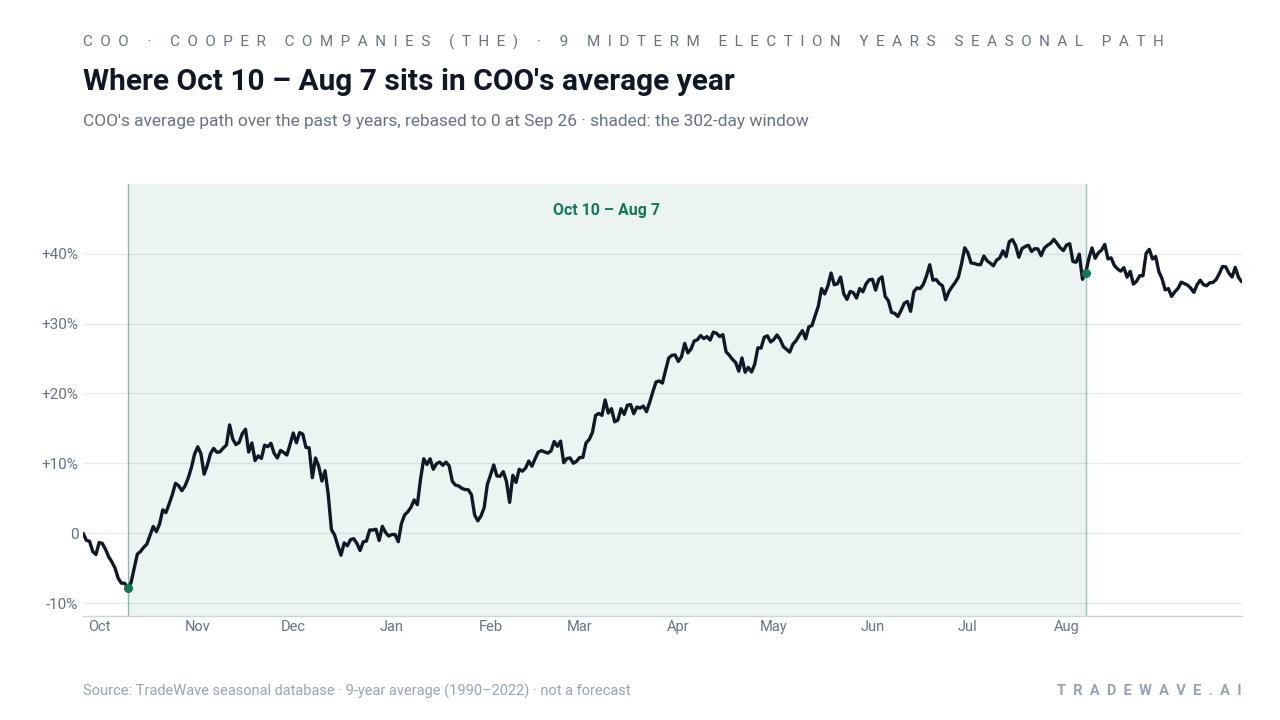
The historical seasonal average suggests that much of the upside has accrued steadily rather than in a single burst. The shaded 302-day window in the trend chart sits inside a broader pattern where COO’s “average year” in midterm cycles slopes upward from early in the window and continues to build into the following summer. That fits the idea of a long seasonal regime rather than a quick trading pop.
Year-by-year ranges show how far COO has tended to swing inside this window before settling at its final gain.
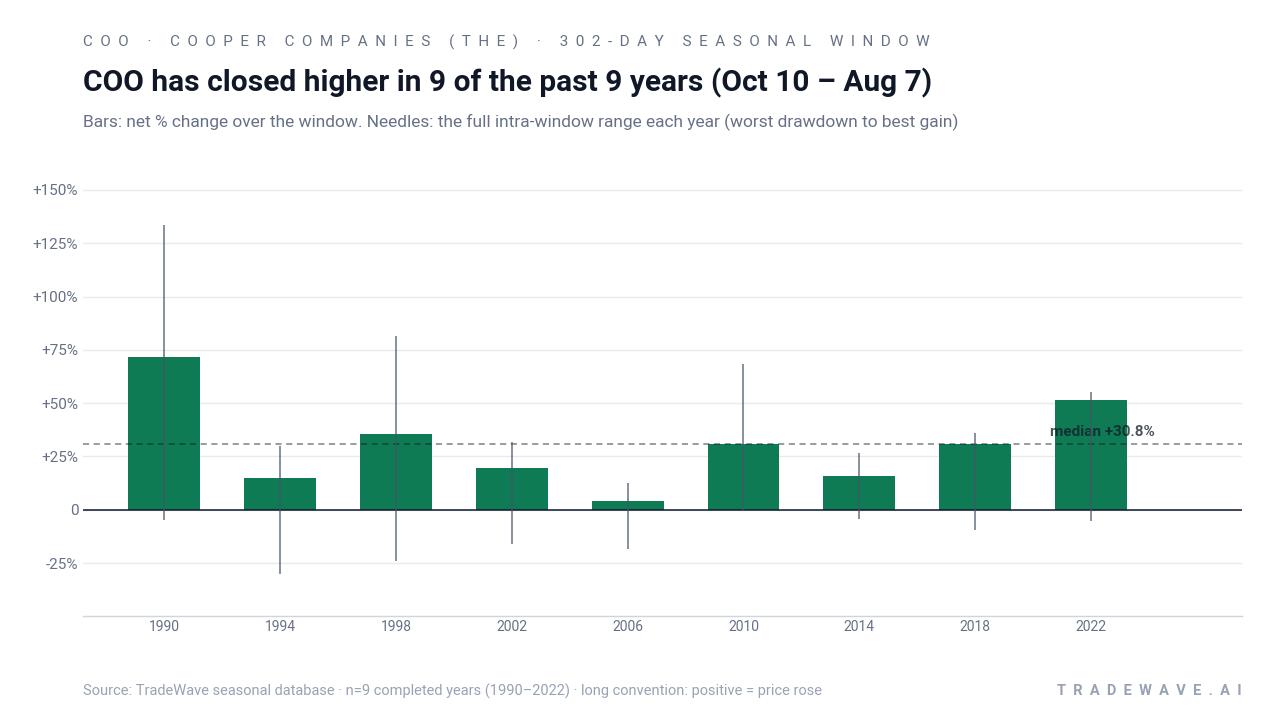
The combined net / best-gain / worst-drawdown view underlines that this has been a high-conviction but not low-volatility window. Maximum favorable moves have reached as high as 133.33% in 1990, while maximum adverse excursions have at times pushed near 30% underwater before the stock recovered. Add it up: nine straight winning windows with a 900.03% compounded cumulative return, but with enough downside noise that position sizing and risk management would have mattered.
History does not guarantee future results, and even in a window with a perfect win record, adverse excursions can be large before any recovery takes hold.
Why does Cooper Companies (The) (COO) follow this seasonal pattern?
This midterm-year pattern may reflect how investors position around Cooper’s fiscal calendar and the broader election cycle. One likely driver is that midterm years often bring policy uncertainty early on, followed by a more supportive risk backdrop as Washington gridlock sets in and markets look ahead to the pre-election year, which has historically been strong for equities. For COO specifically, analysts have pointed to recurring themes like contact-lens demand normalization and fertility procedure volumes, which can line up with fiscal-year guidance resets and portfolio rebalancing in the late-year to summer stretch.
What is driving Cooper Companies (The) (COO) today?
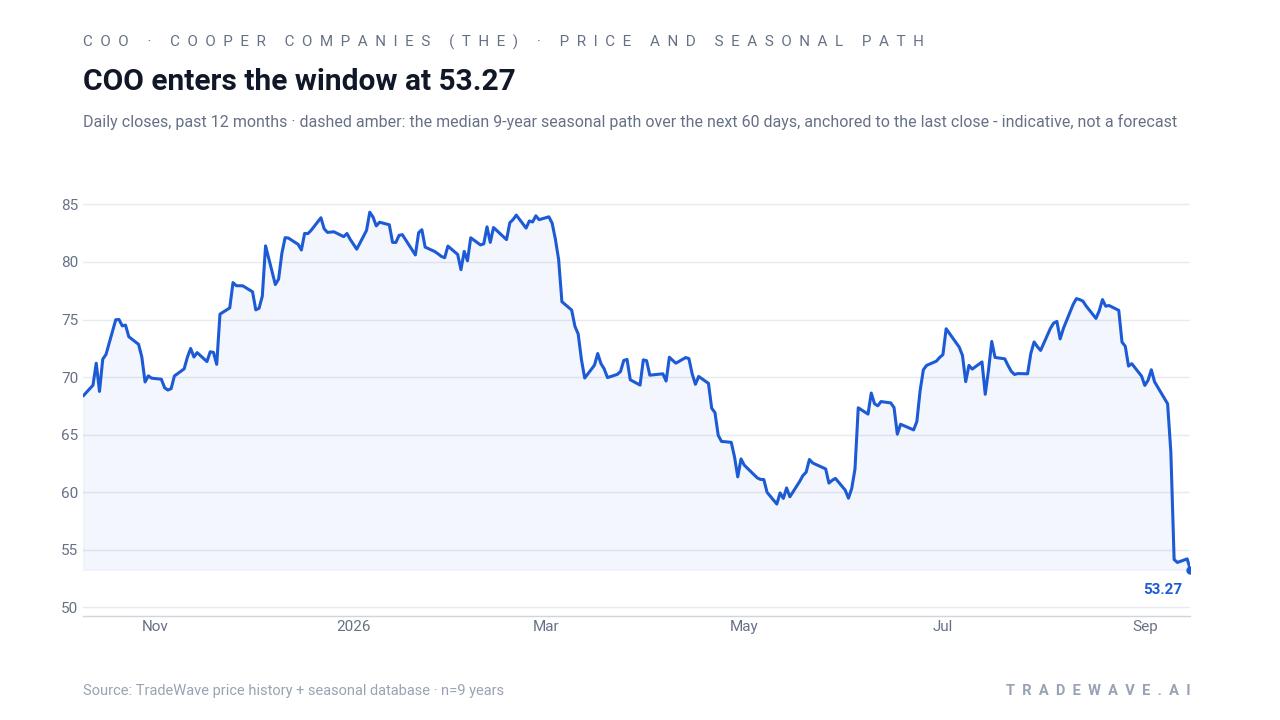
COO closed at 54.61 on Thursday, up 2.52% on the day but still roughly 39.2% below its 52-week high and tracking a 33.37% decline for 2026. The stock has been under pressure since its Sep 10 Q3 report, when revenue of about $1.07 billion missed top-line expectations and management issued Q4 EPS guidance of $1.05 to $1.09, below Wall Street’s roughly $1.19 estimate, sparking a double-digit drop and concern about softer contact-lens demand and inventory reductions.[5]
MarketWatch data show that the weak outlook followed a period of elevated options activity and heavy trading as investors reacted to signs of slowing growth in the CooperVision contact-lens segment and trimmed expectations for the year.[3] The company’s challenges sit inside a broader healthcare-contact-lens backdrop where U.S. inventory reductions and demand normalization have weighed on the group, even as longer-term structural demand for vision correction and fertility services remains intact.[4][6]
Analyst coverage referenced in MarketWatch and Yahoo Finance screens has coalesced around a “Hold” stance, reflecting a market that is not ready to write off the franchise but wants clearer evidence that guidance cuts are behind it.[3][4] In 2025, activist investor Jana Partners pushed Cooper to explore strategic options, including a potential breakup, arguing that the contact-lens and surgical businesses might be worth more apart than together, a debate that still hangs over the stock’s medium-term story.[6][7]
The chart below situates the latest slide and bounce in the context of COO’s past year and the approaching seasonal window.
What should traders watch as this COO seasonal window opens?
First, the calendar: the 302-day window begins on Oct 10, just as markets transition from a bruising midterm election year into the historically stronger pre-election year. If COO can stabilize above recent lows near 51 and start to build higher lows into year-end, that would rhyme with the prior midterm-year pattern where weakness into the fall often gave way to a long grind higher.
Second, earnings and guidance tone will be critical. The next few updates need to show whether the Q3 revenue miss and cautious Q4 EPS guide were a one-off reset or the start of a longer slowdown in contact-lens and fertility demand.[5] Any shift in commentary on U.S. inventory reductions or pricing power could either reinforce or undercut the bullish historical seasonality.
Third, watch positioning and liquidity. The earlier reports of elevated options activity around the selloff suggest that some investors were leaning hard into downside protection or speculation.[3] If that options flow cools and volume normalizes while the stock starts to respect support levels, it would signal that the panic phase is passing and that the seasonal tailwind might have room to operate.
Finally, policy and macro headlines tied to the election cycle matter at the margin. A quieter regulatory backdrop for medical devices, stable rates, and signs that healthcare spending is holding up would all be consistent with how prior midterm-to-pre-election transitions have played out for COO. If, instead, the stock keeps making new lows inside the window despite that historical pattern, it would be a clear sign that company-specific issues have overwhelmed the usual seasonal script.
Sources
- Yahoo Finance - The Cooper Companies, Inc. (COO) Stock Price, News, Quote & History - Yahoo Finance
- The Motley Fool - Cooper Companies - COO - Stock Price & News | The Motley Fool
- MarketWatch - COO Stock Price | Cooper Cos. Stock Quote (U.S.: Nasdaq) | MarketWatch
- Yahoo Finance (News) - The Cooper Companies, Inc. (COO) Latest Stock News & Headlines - Yahoo Finance
- The Motley Fool (article) - Why is CooperCompanies Stock Down 15% Today?
- CNBC - Jana Partners push to break up Cooper Cos. could change the stock's outlook - CNBC
- CNBC - Activist investor Jana Partners takes stake in medical device maker Cooper Companies, WSJ says - CNBC
About this seasonal analysis
Seasonal pattern data is sourced from TradeWave.ai, which analyzes historical price behavior across annual calendar windows going back up to 30 years. Read the full data methodology or the book The 100-Year Pattern by Afshin Moshrefi (2026 edition). Past performance of seasonal patterns does not guarantee future results. This article is for informational purposes only and does not constitute investment advice.