Copart (CPRT) Has Rallied in 7 of 7 Late-October Midterm Windows, Averaging 9.16% Gains
Copart is heading into a historically strong late-October seasonal window just as the stock trades well below its 52-week high and short interest builds, setting up a tension between skeptics and the calendar.
Price as of Sep 24, 2026: $28.04 (last close).

What is the seasonal pattern for Copart (CPRT)?
Copart has risen in 7 of 7 midterm-year late-October windows, with an average gain of 9.16% in winning years.
- 7 for 7 in this window, with Copart averaging 9.16% gains across all completed midterm-year late-October runs.
- Seasonal window runs from Oct 25 for 35 days, covering the final stretch of the midterm election year into early holiday trading.
- Percent Profitable is 100.0%, with 7 winners and 0 losers in the historical sample.
- Average winner profit of 9.16% stacks to an 84.12% cumulative gain when the window is repeated across the last 7 midterm cycles.
- Intraperiod swings have been meaningful, with some years showing double-digit peak run-ups and mid-single-digit drawdowns before finishing higher.
- The pattern aligns with a long trade direction, fitting a historically bullish CPRT seasonal trend into the midterm-to-pre-election transition.
According to historical data from TradeWave.ai, Copart’s late-October behavior in midterm election years has followed a distinct bullish script that most investors never see in standard charts.
How has Copart (CPRT) traded in the late-October midterm-year window?
Copart has closed higher in every single late-October to late-November window across the last 7 midterm election years, averaging 9.16% gains for long positions. Today the stock finished at 28.04, down 2.9% on the session and about 38.9% below its 52-week high of 45.89, after a tough year that has left shares 11.7% lower year to date. Rising short interest, which climbed to 45.10 million shares or 5.39% of float by mid-August with days to cover at 4.8, signals that skeptics have been leaning in just as this historically strong seasonal stretch approaches.[2]
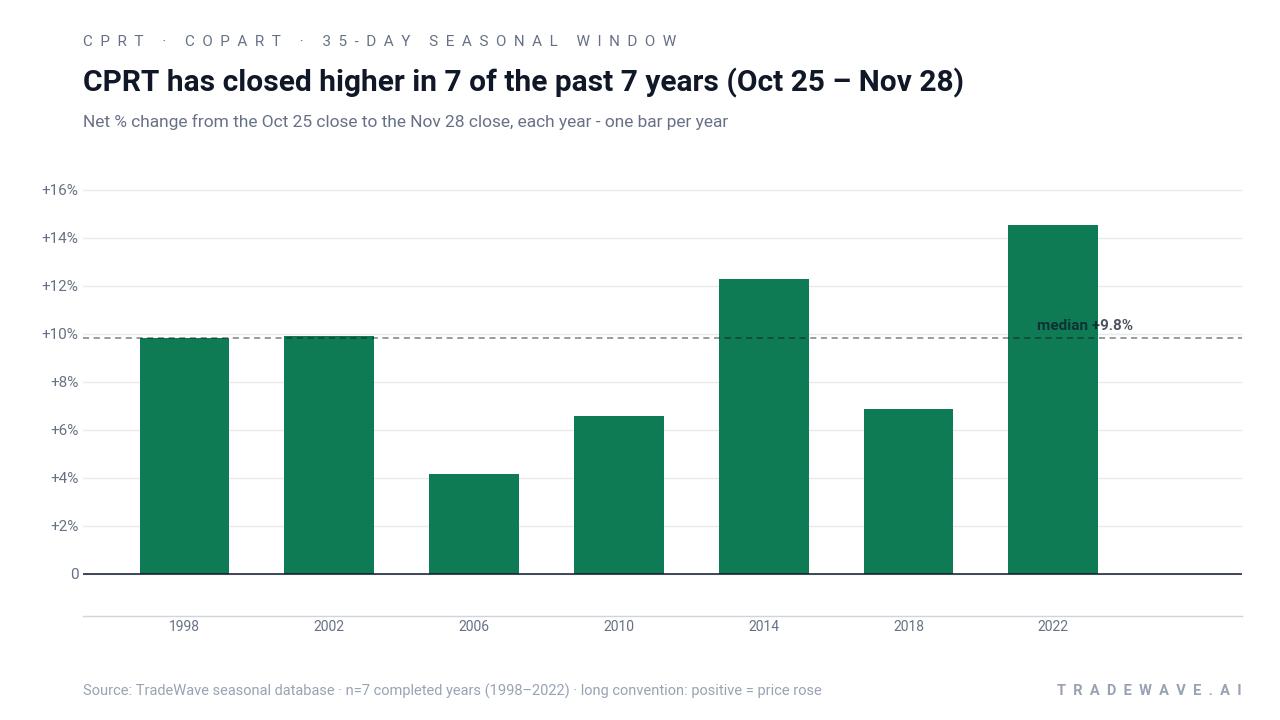
Grouping by the presidential election cycle matters here because this window sits at the handoff from the midterm election year into the year before the presidential election, a phase that has often coincided with friendlier policy tone and improving risk appetite across U.S. equities. For Copart, the pattern phase is defined as “the last 7 midterm election years,” so each data point reflects how CPRT traded from Oct 25 for 35 days in those specific midterm-year calendars, not in consecutive years.
Across those 7 midterm-year windows, Copart’s long trade direction has lined up cleanly with the historical results: 7 winners, 0 losers, and a 100.0% hit rate. Average profit of 9.16% means that a simple long held from the Oct 25 close to the end of the 35-day window would have produced mid- to high-single-digit gains in a typical year, with some cycles stretching into low double digits. Stacked back to back, those seasonal slices compound to an 84.12% cumulative return, which is why this specific CPRT seasonal trend stands out against more mixed patterns elsewhere in the calendar.
A second view shows how far Copart has typically swung inside the window before finishing higher.
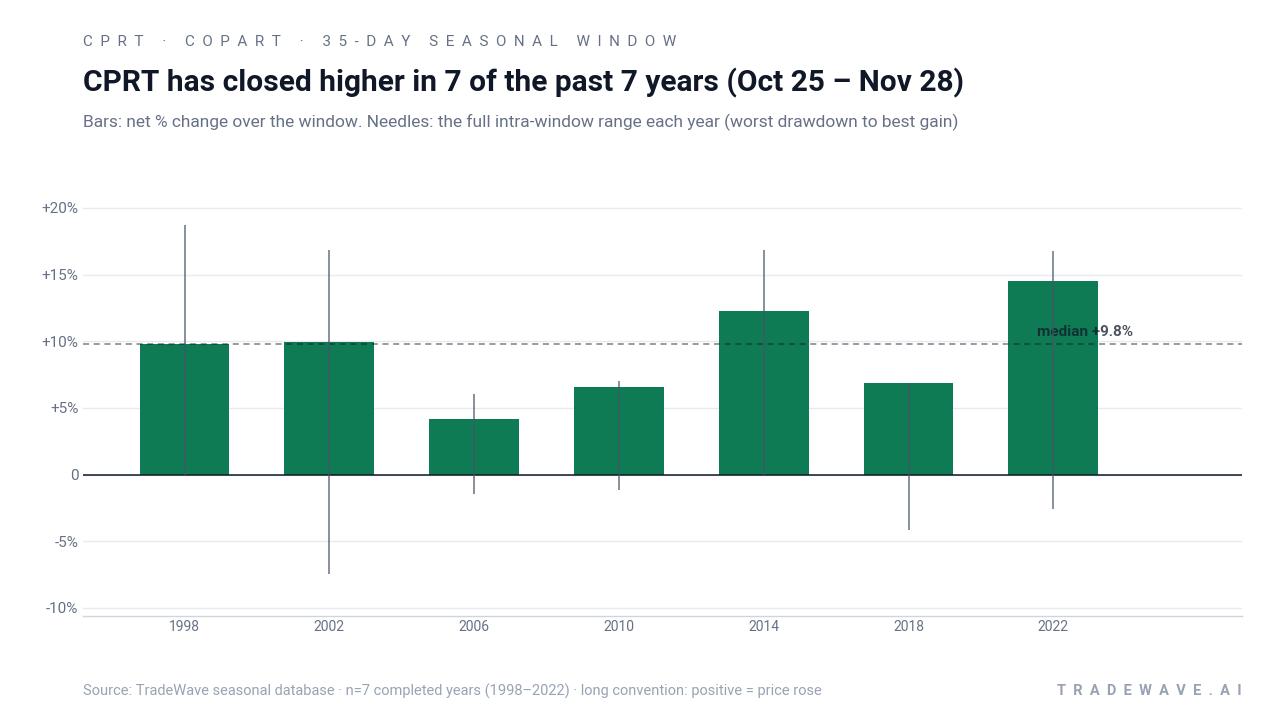
The per-year breakdown shows why this Copart trading window has caught quant attention. In 1998 and 2014, for example, the stock posted net gains of 9.8% and 12.27%, with best intraperiod moves of 18.69% and 16.81% from the entry price, and essentially no adverse drawdown recorded in those windows. Other years were choppier: in 2002, Copart still finished up 9.91%, but the worst intraperiod move was a 7.45% drawdown before the stock recovered, while 2018 saw a 6.88% net gain with a 4.13% dip at the low point. That mix of strong maximum favorable excursions and manageable, but real, maximum adverse excursions is what the TradeWave Ratio of 2.16 is capturing.
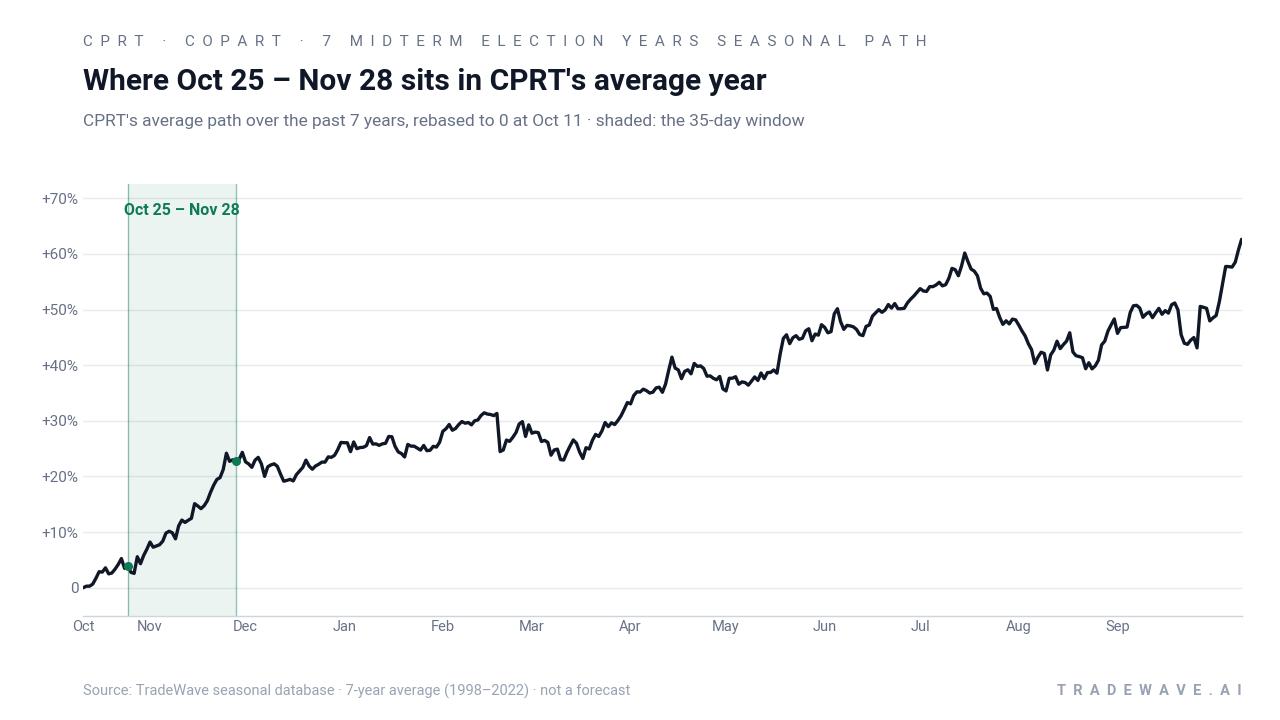
The historical seasonal average path suggests that strength has tended to build through the middle of the window rather than spiking on day one. In several years, CPRT has started the period with modest gains or even small early dips, then accelerated into the back half of the 35 days as the broader market shifted from midterm-election noise toward the pre-election-year playbook. The Sharpe ratio of 2.47, based on end-of-window outcomes, reflects that the average return has been high relative to the volatility of those final results, even though intraperiod swings could still be uncomfortable.
Viewed cumulatively, repeating this Oct 25 to late-November slice across the last 7 midterm election years has produced a smooth upward staircase rather than a jagged line. There are no losing years in the sample, and the compounding effect of stacking mid-single to low-double-digit gains each cycle is what drives the 84.12% cumulative return figure. Add it up: seven for seven, with no historical instance of this specific midterm-year Copart trading window finishing in the red.
History does not guarantee future results; adverse excursions can still be large inside the window even when the final outcome has been positive in prior years.
Why does Copart (CPRT) follow this seasonal pattern?
One likely driver is the way the presidential election cycle shapes risk appetite and sector rotation as markets move from the midterm election year into the year before the presidential election, a phase that has often favored cyclical and economically sensitive names. For Copart, that timing overlaps with insurers finalizing loss trends, setting budgets, and preparing for the next policy year, which can influence salvage volumes and pricing. Analysts have also pointed to year-end portfolio repositioning and tax planning as potential contributors, as investors adjust exposure to niche industrial and auto-related stocks heading into the pre-election year.
What is driving Copart (CPRT) today?
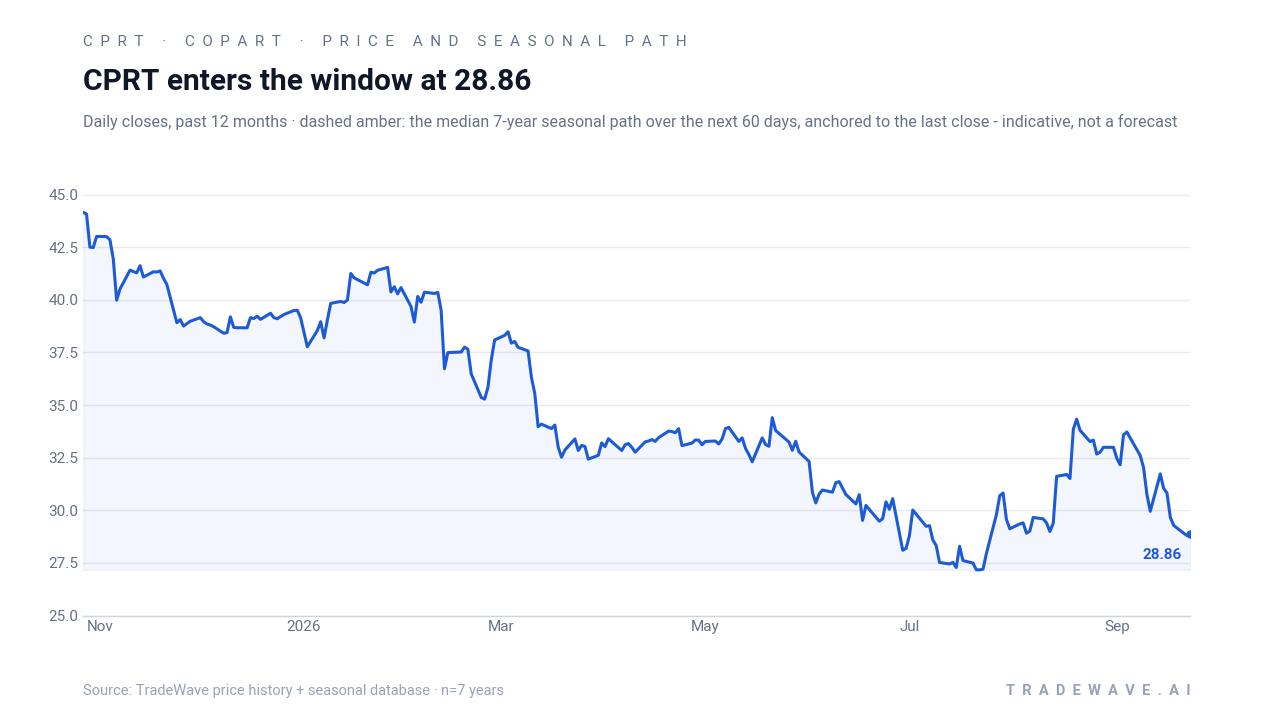
Copart closed Friday at 28.04, down 2.9% on the day, extending a one-month slide of 13.4% and leaving the stock about 38.9% below its 52-week high of 45.89. The pullback comes after a relatively quiet fundamental stretch, with earlier commentary this year highlighting modest revenue growth but strong margins and higher average selling prices for salvage vehicles, helped by rising total loss frequency in the insurance market.[1] The bigger story into late summer has been positioning: as of Aug 14, short interest had climbed to 45.10 million shares, or 5.39% of the public float, with a short-interest ratio of 4.8 days to cover, signaling that bearish bets have been building into a stock that historically has not been very volatile.[2]
That backdrop followed a rare 6.1% single-day gain on Sep 3 after Copart was reported as a suitor for CCC Intelligent Solutions, a software provider in the insurance claims and repair workflow.[5] The move stood out because Copart has logged only five daily moves greater than 5% over the last year, underscoring how unusual that burst of enthusiasm was relative to its typical trading pattern.[5] Insider activity has also been active in 2025 and 2026, with multiple sales by CEO Jeffrey Liaw and transactions by other insiders and politically exposed investors, giving traders another lens on sentiment around the stock’s long-term valuation.[3]
The chart below situates the latest move in its recent multi-month context alongside the historical seasonal projection.
How does the macro and policy backdrop shape this Copart seasonal outlook?
In the broader macro picture, Copart sits at the intersection of auto demand, insurance pricing, and claims volume. Rising total loss frequency, which reached 22.6% for the first nine months of 2025, has been supplying more salvage inventory and supporting revenues, while higher average selling prices for damaged vehicles have helped margins even in periods of softer unit growth.[1] That dynamic ties directly into the presidential election cycle: as the midterm election year concludes and the year before the presidential election begins, fiscal and regulatory uncertainty often eases, and insurers gain clearer visibility on pricing and capital requirements, which can stabilize or even boost activity in the salvage ecosystem.
For traders watching Copart’s seasonal pattern, the policy calendar matters because it shapes both the macro tone and sector flows. The year before the presidential election has historically been one of the stronger phases for U.S. equities, and a supportive backdrop for risk assets can amplify stock-specific seasonal tendencies. If broader markets lean risk-on into 2027 while Copart’s own fundamentals remain anchored by steady claims volume and strong margins, the historical late-October CPRT seasonal trend could again play out against a friendlier macro canvas than the stock’s current drawdown might suggest.
What should traders watch in this Copart (CPRT) window?
Into the Oct 25 start of the 35-day window, the first thing to watch is whether Copart stabilizes above the recent low near 26.81, the 52-week trough, or continues to leak lower into the seasonal turn. A firming tape into late October would rhyme with prior midterm-year patterns where CPRT used this stretch to pivot from weakness to strength. Second, monitor how the stock behaves relative to the historical intraperiod ranges: in past cycles, even winning years have seen drawdowns of 2% to 7% before recovering, so a sharp early dip would not automatically break the seasonal script.
Positioning is the other key variable. With short interest elevated at 5.39% of float and days to cover at 4.8 as of mid-August, traders will be watching whether bearish bets continue to build or start to unwind as the window approaches.[2] A squeeze-like rally driven by shorts covering into strength would be one way the historical maximum favorable excursions have shown up in prior years, while a steady or rising short base could cap upside even if the seasonal tendency remains intact. Finally, keep an eye on any follow-up headlines around strategic moves such as the reported interest in CCC Intelligent Solutions, as well as ongoing insider trading disclosures, since fresh corporate or governance signals could either reinforce or overwhelm the usual late-October Copart trading pattern.[3][5]
Sources
- Forbes - Should You Consider Adding Copart Stock To Your Portfolio?
- MarketBeat - Copart (CPRT) Short Interest & Short Float | Updated Aug 2026
- MarketBeat - Copart (CPRT) Insider Trading Activity 2026
- Yahoo Finance - Copart, Inc. (CPRT) - META_TITLE_QUOTE
- Yahoo Finance - Why Copart (CPRT) Stock Is Trading Up Today
About this seasonal analysis
Seasonal pattern data is sourced from TradeWave.ai, which analyzes historical price behavior across annual calendar windows going back up to 30 years. Read the full data methodology or the book The 100-Year Pattern by Afshin Moshrefi (2026 edition). Past performance of seasonal patterns does not guarantee future results. This article is for informational purposes only and does not constitute investment advice.