Amphenol (APH) Has Risen in 8 of 8 Midterm Sep-Apr Windows, Averaging 16.48% Gains
Amphenol is stepping into a historically powerful 202-day seasonal window just as shares press toward record territory and investors weigh AI growth against insider selling.
Price as of Sep 24, 2026: $83.08 (last close).

What is the seasonal pattern for Amphenol (APH)?
Amphenol has risen in 8 of 8 midterm-election-year windows starting Sep 25 and lasting 202 days, with an average gain of 16.48% in winning years.
- 8 for 8 in this window, with Amphenol averaging 16.48% gains across all completed midterm-election-year cycles.
- Seasonal window runs from Sep 25 to Apr 14, spanning 202 calendar days in the midterm election year.
- Percent Profitable is 100.0%, with 8 winners and 0 losers in the historical sample.
- Trade Direction is long, supported by a Sharpe ratio of 2.36 and a TradeWave Ratio (TWR) of 2.08.
- Individual years have seen strong upside bursts, with maximum favorable moves reaching as high as 43.38% within the window.
- Adverse moves have still appeared inside winning years, with worst intraperiod drawdowns as deep as 20.09% before recovering.
According to historical data from TradeWave.ai, this specific midterm-election-year stretch has behaved very differently from an average calendar period for Amphenol. The next section unpacks how that pattern has played out across prior cycles and what it implies for the current window.
How has Amphenol (APH) traded in this midterm-year seasonal window?
Amphenol has closed higher in every one of the last eight midterm-election-year windows that began on Sep 25 and ran for 202 days, averaging 16.48% gains across those cycles. The stock enters this year’s iteration at $83.08 after a 1.1% move in the latest session and sits about 1.7% below its 52-week high of $84.48. This combination of a perfect historical record, strong recent momentum and proximity to the highs makes the new window one of the more closely watched stretches on the Amphenol calendar.
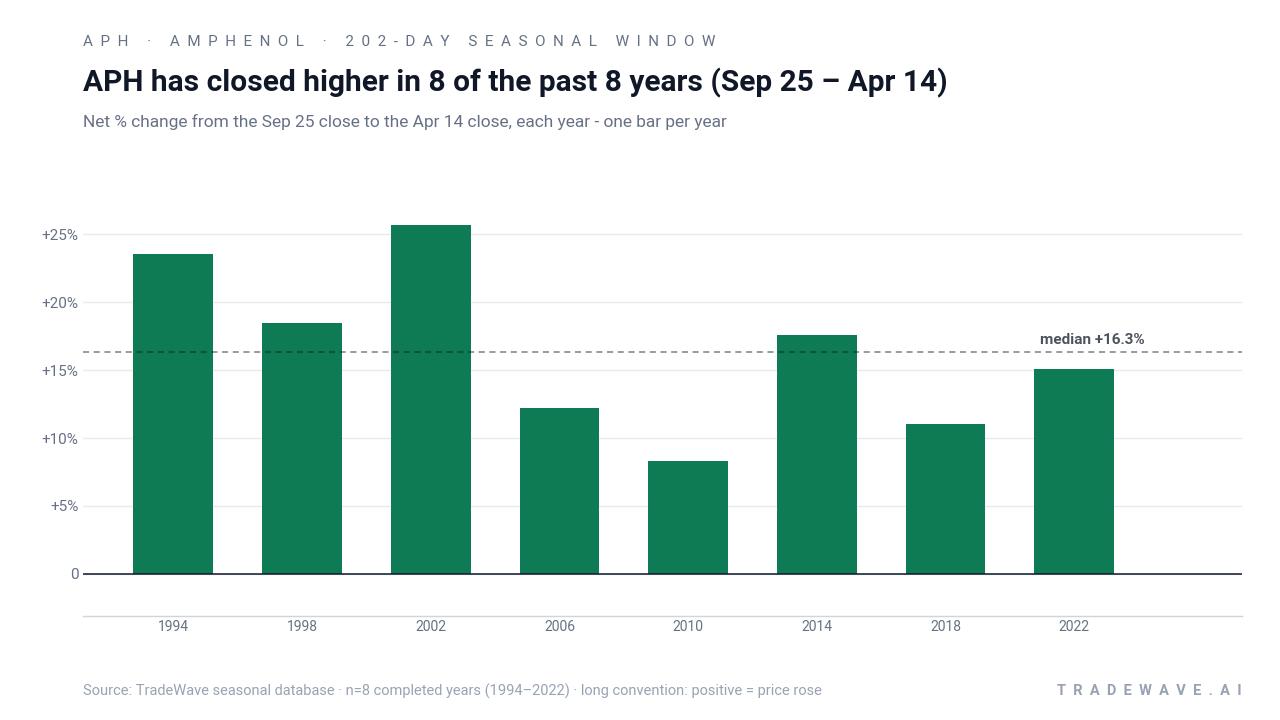
The pattern is grouped by the presidential election cycle, focusing on the last eight midterm election years rather than consecutive calendar years. That matters because midterm years often feature a distinct policy and liquidity backdrop, with Washington shifting from early-term agenda setting toward positioning for the pre-election year, and institutional investors adjusting sector exposure accordingly.
Across those eight midterm-year windows, Amphenol’s average gain of 16.48% lines up with a cumulative return of 235.79% when the window is hypothetically repeated and compounded each cycle. The median outcome of 16.3% is almost identical to the average, which suggests the distribution of returns has been tight around that mid-teens gain rather than skewed by a single outlier year.
Every year in the sample has been a winner for a long bias, but the path has not been smooth. Maximum favorable moves inside the window have ranged from 11.36% in 2018 to 43.38% in 2002, showing that in strong years the stock has often staged sizable rallies before the window closes. On the downside, worst intraperiod drawdowns have stretched to -20.09% in 2018 and -19.41% in 1998, reminding traders that even “all green” windows can involve deep pullbacks before finishing higher.
The per-year table highlights 2002 as the standout cycle, with a 25.66% net gain and a 43.38% best run-up from entry, while 2010 delivered a more modest 8.29% net return despite a 22.01% peak move. That gap between the best intraperiod rally and the final close is a good example of why the TradeWave Ratio and intraperiod excursions matter: the stock has often traveled much further in the trade direction than the final net result suggests.
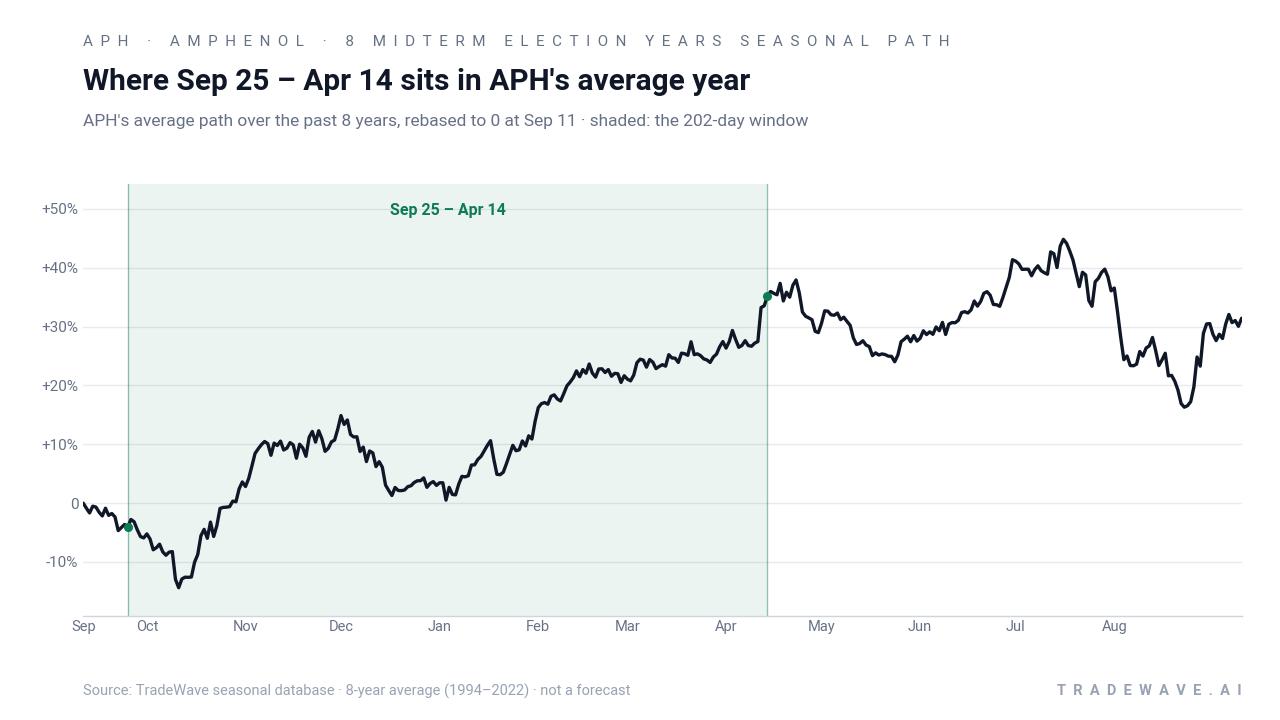
A second view shows how far Amphenol has typically swung both up and down inside each of these winning windows.
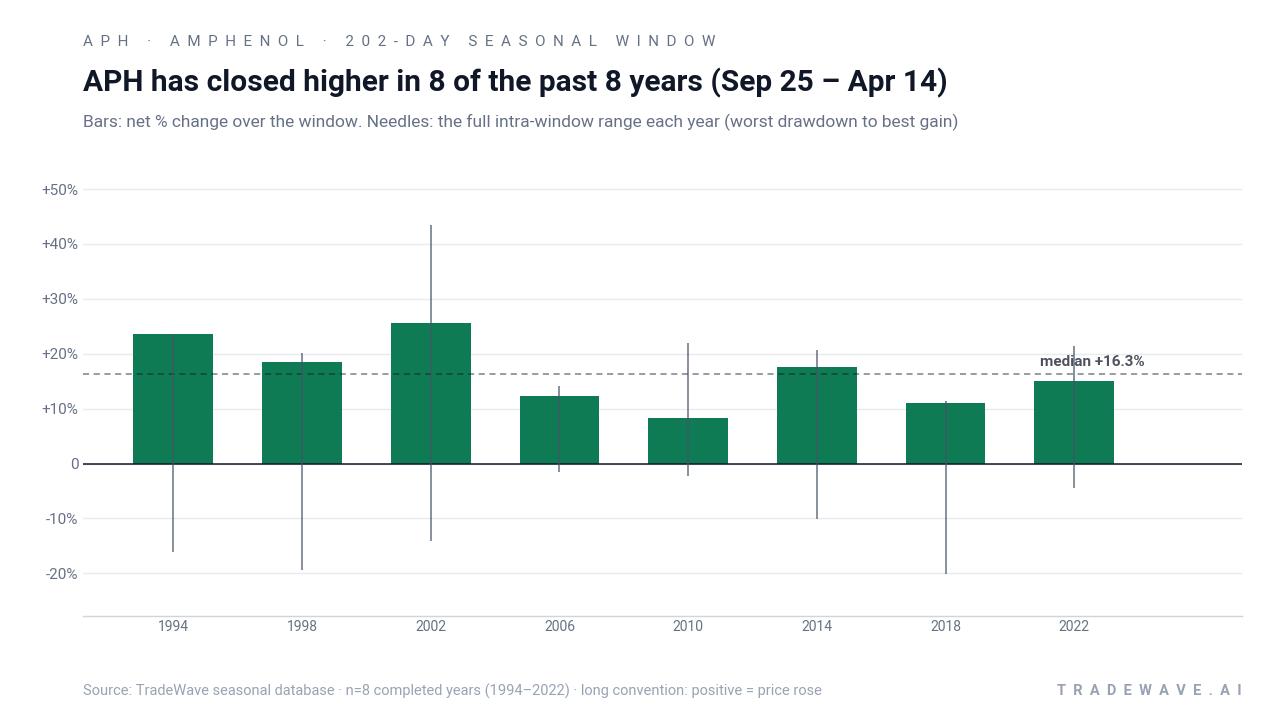
The combined net/MFE/MAE profile paints this as a high-conviction but not low-volatility window. Large maximum favorable excursions alongside sizable worst drawdowns suggest a regime where trend-followers have historically been rewarded, but only if they could tolerate swings of 10% to 20% against them along the way. The Sharpe ratio of 2.36 reflects strong risk-adjusted outcomes based on end-of-window results, yet the intraperiod ranges show that the ride has rarely been smooth.
History does not guarantee future results; adverse excursions can be large even in winning windows, and past seasonal strength does not ensure similar performance in this cycle.
Why does Amphenol (APH) follow this seasonal pattern?
One likely driver is the way Amphenol’s earnings and capital spending cycles line up with the broader presidential election calendar, with midterm-year autumn often marking the start of new budget and infrastructure cycles for data centers and communications customers.[2] Analysts have also pointed to institutional portfolio rebalancing into high-quality industrial and electronics names as visibility improves heading into the pre-election year, which can favor suppliers like Amphenol tied to AI and data center buildouts.[2] The pattern may also reflect a tendency for investors to rotate into more stable, cash-generative hardware names after early-year volatility in midterm years, reinforcing this specific Sep-to-Apr trading window.
What is driving Amphenol (APH) today?
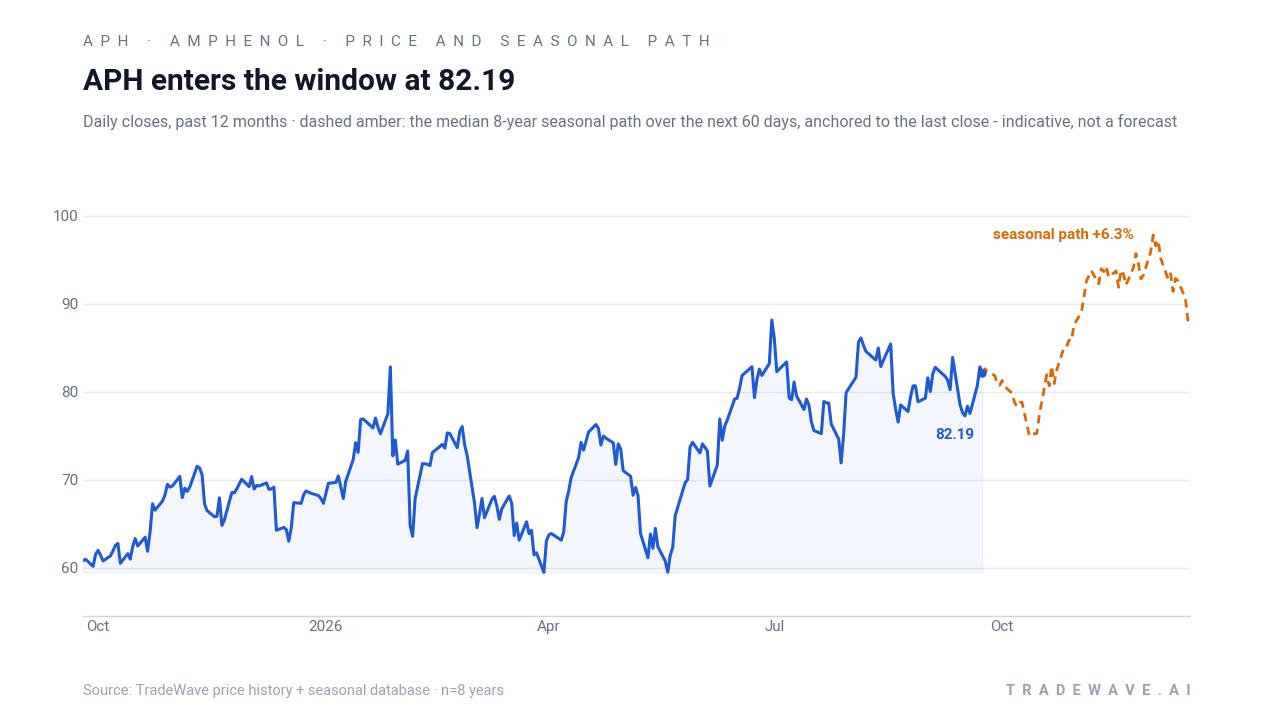
Amphenol shares finished the latest session at $83.08, up 1.1% on the day, after trading between $80.05 and $83.53 on volume slightly below the recent 20-day average of about 12.1 million shares. The stock is about 1.7% below its 52-week high of $84.48 and has surged roughly 107.05% over the past month, a sharp run that leaves it extended but firmly in an uptrend. In June 2026, Amphenol reported a Q1 beat that highlighted AI-related demand for higher-content components and data center builds as key growth drivers, even as the same report flagged insider selling that some investors saw as a potential overhang.[2]
The chart below situates the latest move in its recent multi-month context alongside the median 60-day seasonal path.
In June 2026, a Yahoo Finance analysis noted that Amphenol’s Q1 beat came alongside insider selling, including transactions by senior executives, which some investors interpreted as a signal to lock in gains after a strong run.[2] Earlier MarketBeat compilations of insider activity in 2025 and 2026 also show multiple sales by top management, including CEO Richard Adam Norwitt, reinforcing the perception that insiders have been trimming exposure into strength rather than adding to positions.[1] Against that backdrop, the stock’s powerful recent rally and entry into a historically strong seasonal window create a tension between bullish AI-driven fundamentals and more cautious insider behavior.
From a macro and sector standpoint, Amphenol sits at the intersection of electronic components and data center infrastructure, supplying connectors, cables and fiber that benefit directly from AI rack deployments and higher component content per server.[2] As AI-related capex has accelerated, investors have increasingly treated Amphenol as a derivative AI play, a view reinforced by a Bank of America upgrade in October 2025 that cited upside from AI-related revenue growth and M&A activity.[2] That positioning means the stock is sensitive not just to its own earnings but also to broader sentiment around AI spending, cloud budgets and industrial demand, all of which will shape how this midterm-year seasonal window ultimately plays out.
What should traders watch in this Amphenol seasonal window?
First, the calendar itself matters. This 202-day window runs from Sep 25 through Apr 14, bridging the late part of the midterm election year into the early months of the year before the presidential election. Historically, that transition has coincided with improving risk appetite as policy uncertainty around midterms fades and markets start to price a more supportive pre-election backdrop.
Second, price behavior relative to the historical pattern will be key. In prior cycles, Amphenol has often seen meaningful drawdowns of 10% to 20% inside the window before finishing higher, so a sharp pullback on its own would not contradict the seasonal trend. What would challenge the pattern is a sustained break that leaves the stock down over the full Sep-to-Apr stretch, something that has not occurred in the eight midterm-year windows in this dataset.
Third, traders should monitor how AI and data center spending headlines evolve into year-end and early 2027, since those themes have become central to Amphenol’s growth narrative.[2] Any signs of slowing rack deployments, delayed cloud capex or pressure on hardware budgets could blunt the historical seasonal tailwind, while continued strength in AI infrastructure orders would rhyme with prior cycles where the stock trended higher through this window.
Finally, insider activity bears watching. MarketBeat’s compilation of 2025 and 2026 transactions shows that insiders have been net sellers into prior strength, including notable sales by the CEO and other senior leaders.[1] If that pattern of selling accelerates as the stock trades near its highs during a historically strong seasonal window, it could temper enthusiasm and signal that management sees the risk/reward as less compelling at current levels. Conversely, a slowdown in insider selling or the appearance of meaningful insider buying would mark a clear departure from the recent playbook and could reinforce confidence in the seasonal trend.
Sources
About this seasonal analysis
Seasonal pattern data is sourced from TradeWave.ai, which analyzes historical price behavior across annual calendar windows going back up to 30 years. Read the full data methodology or the book The 100-Year Pattern by Afshin Moshrefi (2026 edition). Past performance of seasonal patterns does not guarantee future results. This article is for informational purposes only and does not constitute investment advice.