Baker Hughes (BKR) Has Rallied in 8 of 9 Midterm Spring Windows Set to Open in April
Baker Hughes is approaching a short but historically strong midterm-election-year window just as the stock trades well below its 52-week high and investors reassess energy demand, AI power needs and oil spending cuts.

Key takeaways
- Baker Hughes enters a seven-day midterm-election-year window starting Apr 11 that has produced gains in 8 of the last 9 cycles.
- The pattern is long-biased, with 89% Percent Profitable, 8 winners and 1 loser, and an Avg Profit of 4.79% for winning years.
- Including the lone down year, Avg Profit - All still comes in at 4%, pointing to a consistently positive tilt across the sample.
- The TradeWave Ratio of 1.68 suggests price has typically traveled meaningfully in the trade direction within the window, while the Sharpe ratio of 1.08 reflects solid risk-adjusted returns.
- Intraperiod swings have featured both notable run-ups and drawdowns, so traders should treat the window as short but potentially punchy rather than smooth.
- All of this plays out with BKR down 2.9% on Friday’s close and sitting well below its 52-week high of 67, leaving room on the chart if the pattern repeats.
According to historical data from TradeWave.ai, this upcoming stretch has behaved very differently from an average week on the calendar for Baker Hughes. The next section walks through what that election-cycle pattern has looked like in prior midterm years and how it frames the backdrop for April.
Seasonal window
The seven-day window for Baker Hughes that begins on Apr 11 in midterm election years has been a quietly powerful spot on the calendar, with the stock rising in 8 of the last 9 cycles and posting an average gain of 4.79% in those winning years. Shares closed Friday at 54.26, down 2.9% on the day and sitting about 19.0% below their 52-week high of 67, leaving a sizable gap if the historical pattern exerts any pull this time.
Because this pattern is grouped by the presidential election cycle, it only looks at midterm election years, not every calendar year. That matters for a name like Baker Hughes, where policy, regulation and capital spending often move in waves tied to Washington’s cycle and global energy policy debates rather than in smooth annual increments.
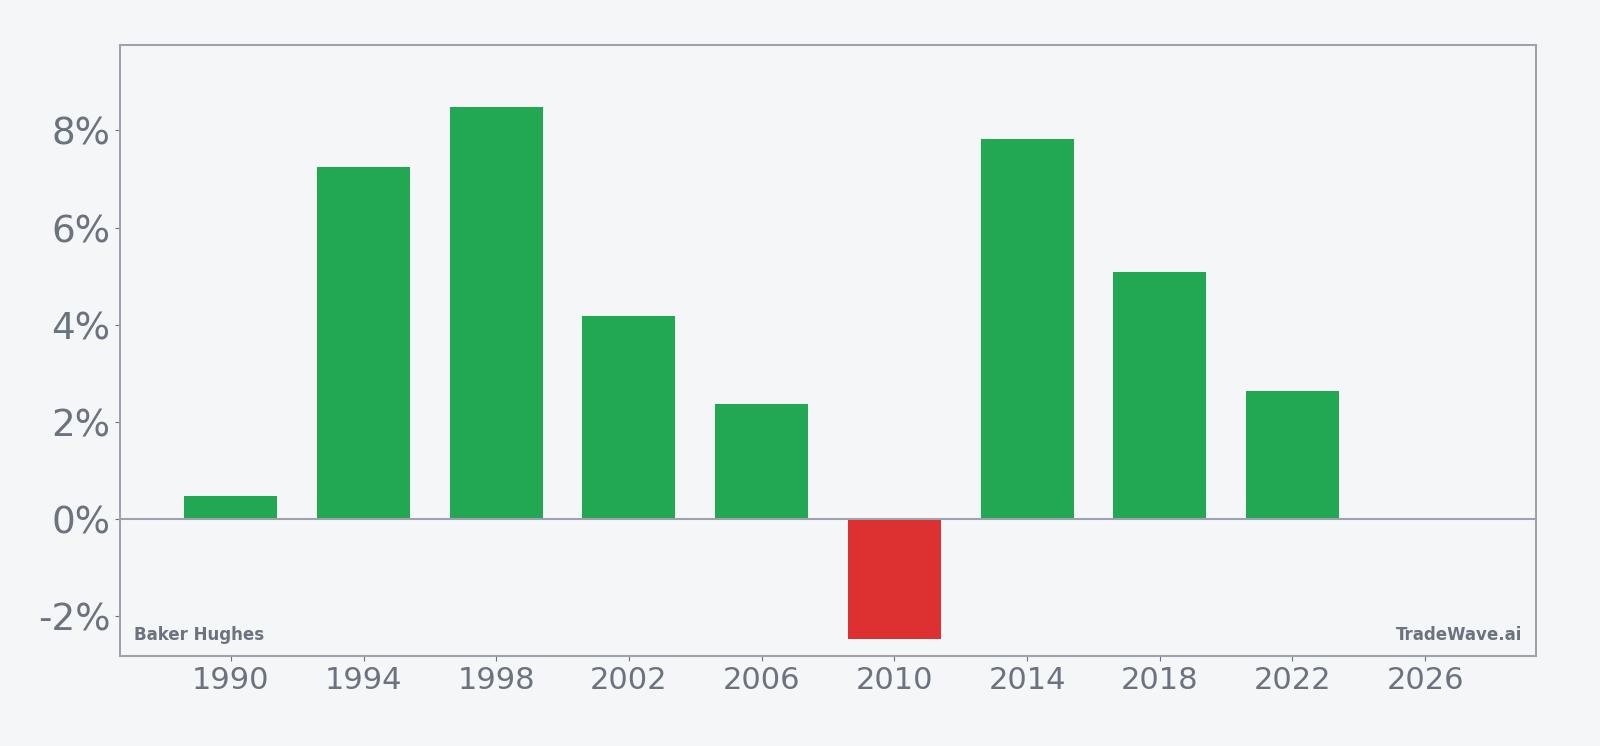
This seasonal window begins on Apr 11 and spans 7 days. Historically, during this period, Baker Hughes has shown a strong upside tendency in midterm election years, aligned with a long trade direction. Across the last nine midterm cycles, the stock has finished the window higher in 8 years and lower in just 1, for an 89% Percent Profitable record with 8 winners and 1 loser.
The average gain in those winning years is 4.79%, while the single losing year in 2010 saw a decline of 2.46%. When every year is included, the Avg Profit - All still comes in at 4%, which is unusually close to the winners-only figure and signals that the lone down year has not dragged the overall profile down very far.
Looking at individual years shows how the pattern has played out. The strongest outcomes came in 1998 and 2014, when Baker Hughes gained 8.49% and 7.83% respectively over the seven-day stretch, with maximum favorable moves of 9.62% and 10.15% from entry to peak. The weakest year for the pattern was 2010, when the stock fell 2.46% and experienced a worst intraperiod drawdown of 3.75% from the starting level.
The MFE/MAE profile, which tracks best and worst intraperiod excursions from the entry price, shows that even in positive years the ride has not always been smooth. In 2002, for example, Baker Hughes finished the window up 4.19% but first saw a worst drawdown of 6.17% before recovering, while the best run-up topped out at 5.74%. That mix of strong final gains and meaningful interim downside is typical of a short, punchy window in a cyclical stock.
Trend metrics in the pattern suggest that the bulk of the move has often come from steady grinding rather than a single spike. The historical seasonal average points to gains that tend to build across the week rather than front-loading on day one, which fits with the idea of positioning flows and macro headlines accumulating over several sessions in midterm years.
Year-by-year bars with both peak run-ups and worst drawdowns show how much the stock has tended to move inside the window.
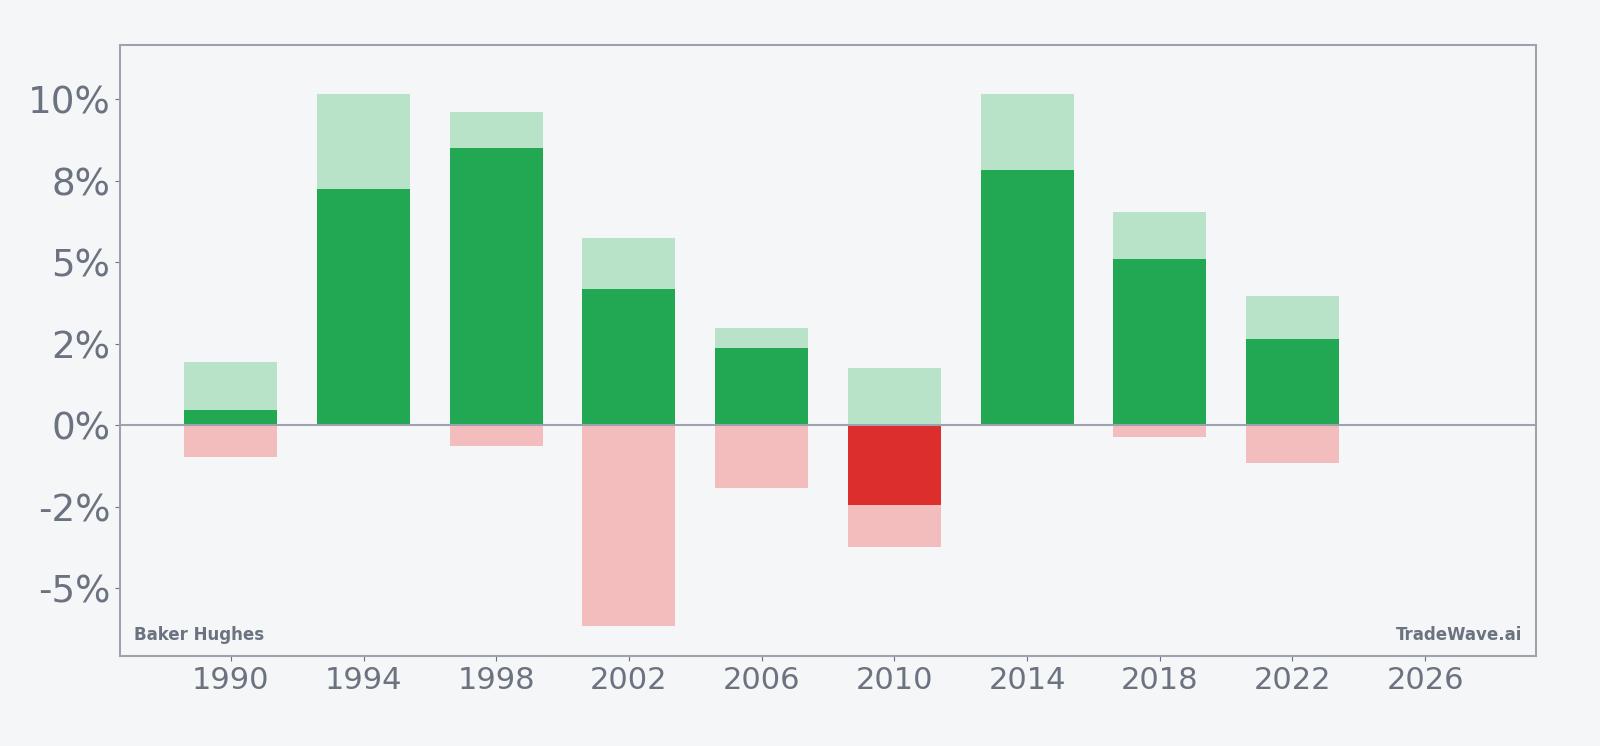
The stacked view of net results, maximum favorable excursion and maximum adverse excursion underlines the trade-off. In most years, upside peaks have pushed well beyond the final close, while downside excursions have stayed smaller but still meaningful. That combination, along with a TradeWave Ratio of 1.68 and a Sharpe ratio of 1.08, paints a picture of a short window that has historically rewarded long exposure but has not been free of sharp pullbacks.
History does not guarantee future results; adverse excursions (MAE) can be large even in winning windows.
Price and near-term drivers
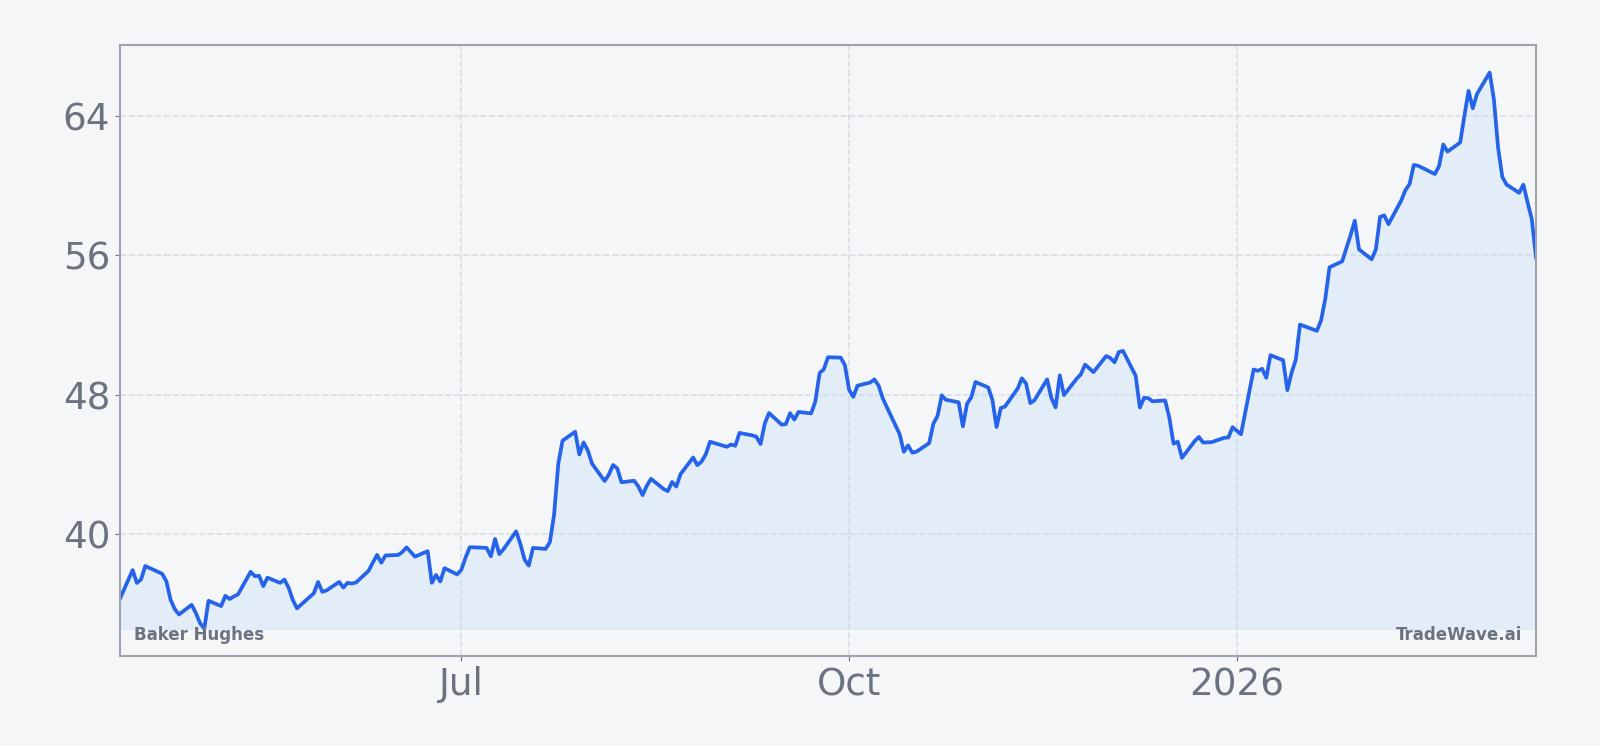
Baker Hughes closed Friday at 54.26, down 1.64 points or 2.9% on the session, extending a one-month slide of 11.61% and leaving the stock well below its 52-week high of 67 on heavier-than-average volume of 17.5 million shares versus a 20-day average of about 9.6 million. The stock is also trading under its 50-day moving average of 56.9, a sign that the near-term trend has softened even as the longer-term story remains tied to gas technology, LNG and AI-driven power demand.
Fresh earnings numbers from late January showed that Baker Hughes’ adjusted net income for the fourth quarter of 2025 rose 11% to $772 million, helped by demand for gas technology equipment and services that offset weaker oilfield services activity.[1] That result reinforced a theme that has run through the last year: the company’s industrial and energy technology segment, including LNG and power-related offerings, has been doing more of the heavy lifting as traditional upstream spending cools.[1]
In June 2025, Baker Hughes beat second-quarter profit estimates on strong demand for natural gas technology, again highlighting the shift toward gas and LNG as key earnings drivers.[2] By late July 2025, the company moved to deepen that exposure with a $13.6 billion deal to acquire Chart Industries, a bet on LNG infrastructure and data center cooling that management framed as a way to capture structural growth in both energy transition and AI-related power needs.[3]
Strategic pressure has also been building. In November 2025, activist investor Ananym Capital argued that Baker Hughes could unlock at least 60% upside by spinning off its oilfield services business, contending that the market undervalues the company’s LNG and industrial technology assets inside the current conglomerate structure.[4] That debate sits in the background as investors weigh how much of the AI and power-demand story is already in the stock and how much might still be latent if the portfolio is reshaped.
Management has been clear that the macro backdrop is a mix of tailwinds and headwinds. In October 2025, CEO Lorenzo Simonelli said AI-driven power demand was a key reason for the company’s resilience but warned that global upstream oil investment was likely to decline at a high-single-digit rate in 2025, reflecting oversupply in crude markets.[6] That combination of softer oil spending and stronger gas and power demand is exactly the kind of environment where a short, historically strong seasonal window can matter, because it can intersect with shifting expectations around capital allocation and order books.
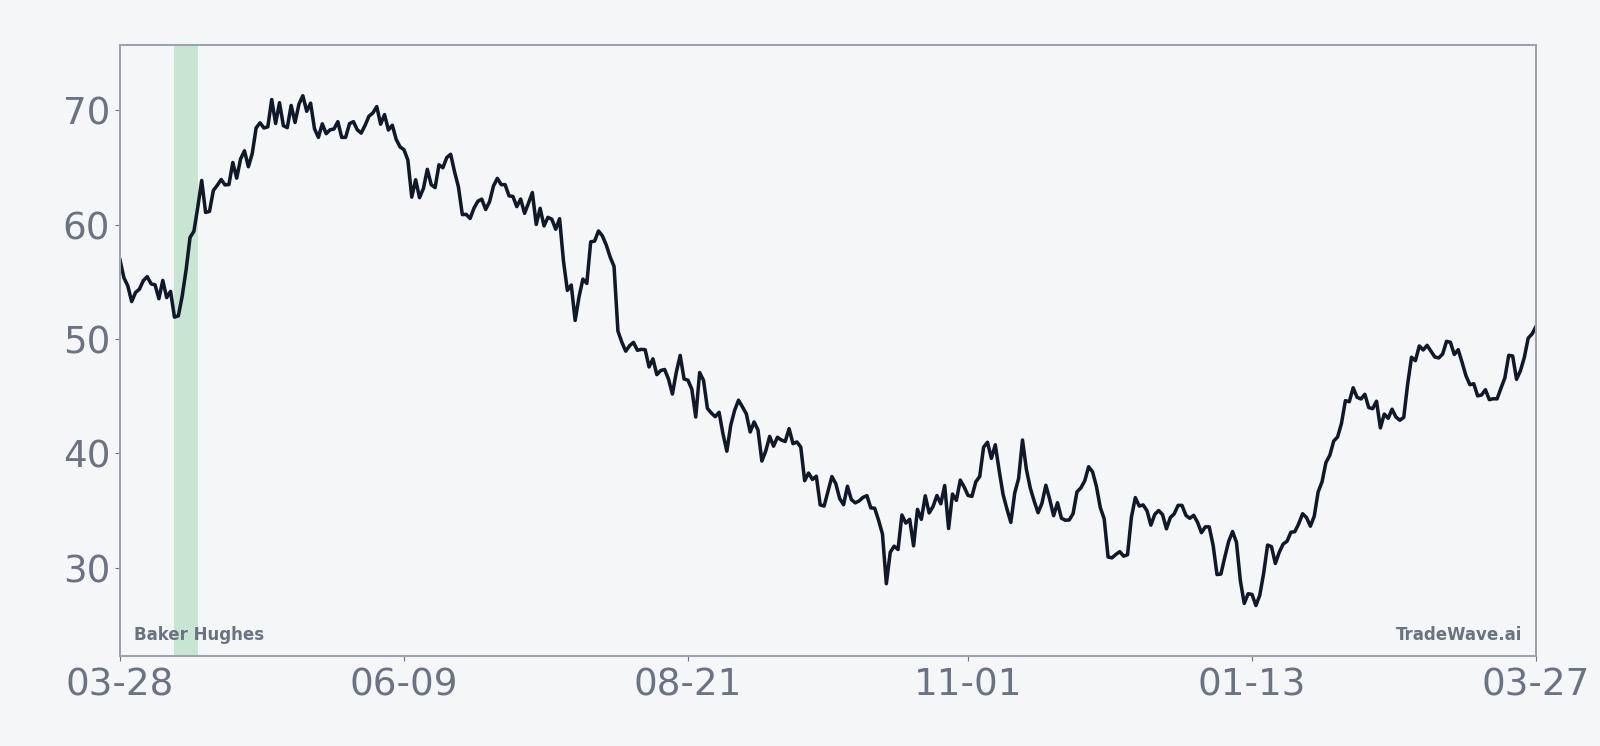
The chart below situates the latest move in its recent multi-month context.
Election-cycle and macro backdrop
The upcoming window sits in the early part of the midterm election year, a phase that often brings more policy noise around energy, climate and industrial spending. For a company like Baker Hughes, which straddles traditional oil services and newer LNG and power technologies, that means headlines on regulation, permitting and fiscal support can hit both sides of the business at once.
Energy policy debates in midterm years frequently focus on fuel prices and reliability, which can influence how quickly utilities and industrial customers commit to long-dated gas and LNG projects. At the same time, the surge in AI deployment is driving power demand higher, a trend Baker Hughes has already flagged as a key support for its 2025 resilience.[6] The seasonal pattern in April effectively overlays that policy and demand backdrop on a stock that is already in motion, which is why the seven-day window can punch above its weight.
What to watch as the April window approaches
With the midterm-election-year window set to open on Apr 11, traders will be watching a few key markers. First, price action relative to the 50-day moving average of 56.9 will matter; a push back above that level into the window would signal that the recent 11.61% one-month slide is stabilizing, while continued trading below it would frame any seasonal strength as a countertrend bounce.
Second, policy and macro headlines around energy, LNG and AI power demand will be in focus. Any signs that utilities, data center operators or LNG buyers are accelerating orders could reinforce the gas and industrial technology narrative that has underpinned Baker Hughes’ earnings beats and profit growth over the past year.[1][2] Conversely, renewed pressure on upstream budgets or delays in large projects would test how much of the historical seasonal strength can show up against a softer fundamental tape.
Third, intraday volatility inside the window will be a tell. Historically, maximum favorable and adverse excursions have both been meaningful, so traders will be looking to see whether early dips are bought or whether downside runs away from them. A pattern of higher lows and strong closes during the seven days would rhyme with prior midterm years, while persistent selling into strength would mark a break from the script.
Finally, any fresh developments on portfolio strategy, including renewed activist pressure or commentary on the Chart Industries integration, could intersect with the seasonal window in a way that amplifies moves.[3][4] Add it up: a stock that has historically liked this exact week in midterm years, a chart that has pulled back from highs, and a macro story that is still evolving. The calendar is about to test whether that combination still favors the bulls.
Sources
- Reuters: Oilfield service company Baker Hughes posts 11% rise in adjusted quarterly profit (Jan 25, 2026)
- Reuters: Baker Hughes beats second-quarter profit estimates on strong demand for natgas technology (Jul 22, 2025)
- Reuters: Baker Hughes bets LNG, data center demand with $13.6 billion Chart Industries deal (Jul 29, 2025)
- CNBC: Activist Ananym Capital sees upside if Baker Hughes spins off its oilfield services business (Nov 22, 2025)
- Reuters: Baker CEO says 2025 resilience driven by AI growth, sees oil investment slowdown (Oct 24, 2025)