Lean Hogs (HE) Has Rallied in 10 of 10 Late-Spring Windows Since 2016
Lean Hogs is approaching a late‑spring stretch that has quietly delivered double‑digit annualized gains, just as prices trade near the upper end of the past year’s range.
Key takeaways
- A 27‑day spring window for Lean Hogs starting Apr 1 has produced gains in 10 of 10 years, a rare 100% hit rate.
- The pattern is long‑biased, with average profits of 9.19% across winners and a cumulative 137% gain since 2016.
- Intraperiod swings have been large, with some years seeing double‑digit rallies and mid‑single‑digit drawdowns before finishing higher.
- The historical profile shows strength skewed toward the middle of the window, with choppier action at the start and end.
- Even in winning years, adverse moves have reached nearly 25% in extreme cases, underscoring the need to respect downside risk.
According to historical data from TradeWave.ai, this upcoming stretch in Lean Hogs has behaved very differently from an average month on the calendar, and the next iteration is about to open again.
Seasonal window
Lean Hogs has finished higher in this 27‑day spring window in all 10 years since 2016, averaging 9.19% gains for long positions. The next run of that pattern begins on Apr 1, with front‑month futures recently closing at 90.90 cents per pound, leaving the contract about 20.1% below its 52‑week high of 113.70 and roughly 17.5% above the 77.35 low.[1] For hog traders, that combination of a clean 10‑for‑10 track record and a price sitting mid‑range sets up a window where historical tailwinds and current positioning could collide.
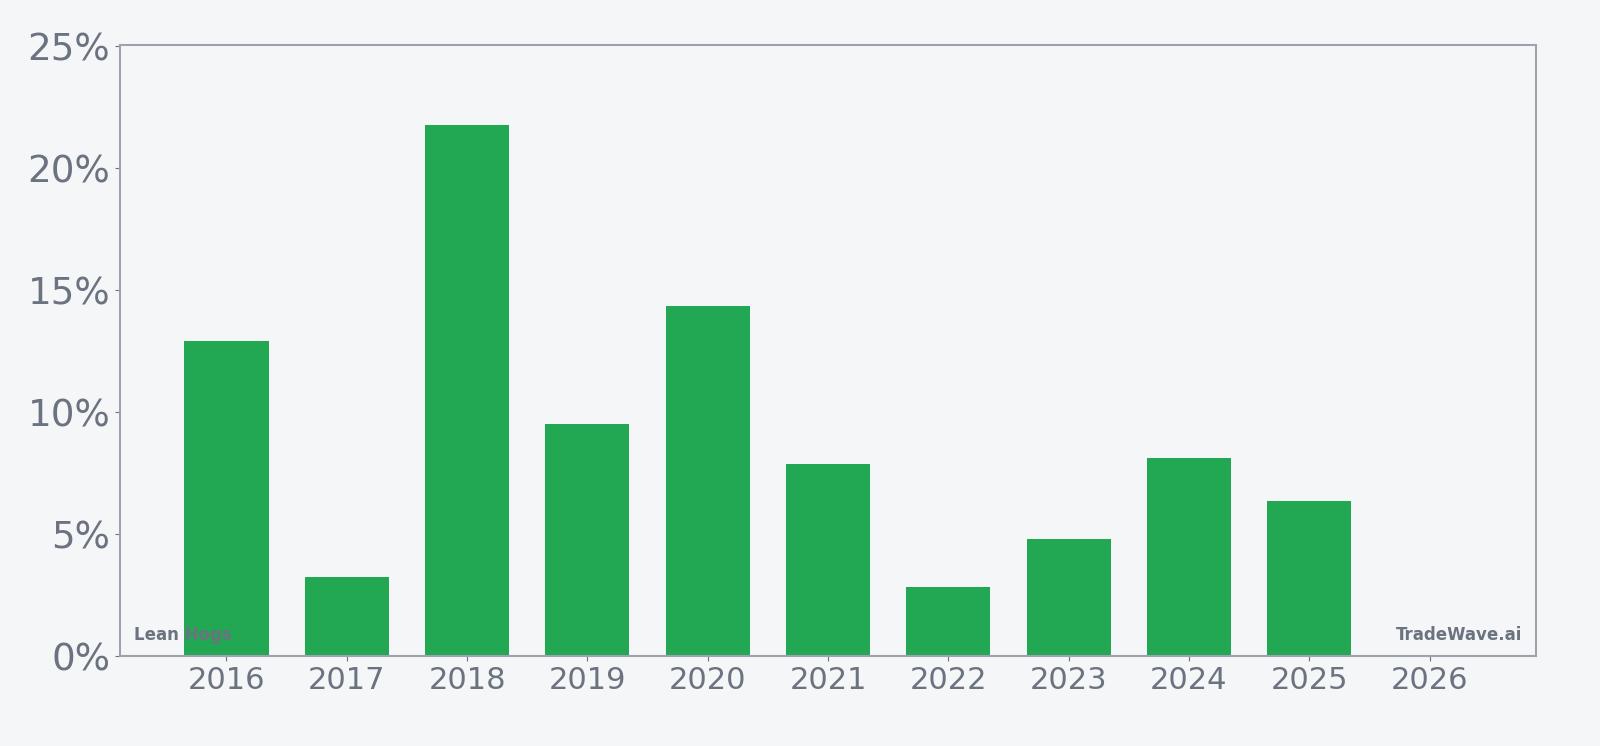
Across the decade, the pattern has been consistently friendly to longs. The strongest year in the sample was 2018, when the window delivered a 21.80% net gain, with a maximum favorable move of 30.37% from entry before settling back.[1] The softest outcome still finished positive: 2017 booked a 3.24% net rise, even after a mid‑window dip of 4.51% from the starting level.
Intraperiod volatility is the catch. In 2020, Lean Hogs ultimately gained 14.37% over the window, but at one point the contract traded 24.80% below the entry price before recovering.[1] Several other years show adverse swings of 4% to 7% even as the final result stayed green, which fits the contract’s reputation for sharp, liquidity‑driven air pockets around supply headlines.
The 10‑year seasonal trend chart shows a fairly steady upward slope, with gains tending to build from the first week of the window and plateauing toward the final days.[1] That shape suggests the historical bias has not depended on a single news event or one‑off shock, but rather on a recurring flow of demand and positioning through late April.
A second view that layers net returns with peak rallies and worst drawdowns helps frame how far prices have tended to travel inside the window.
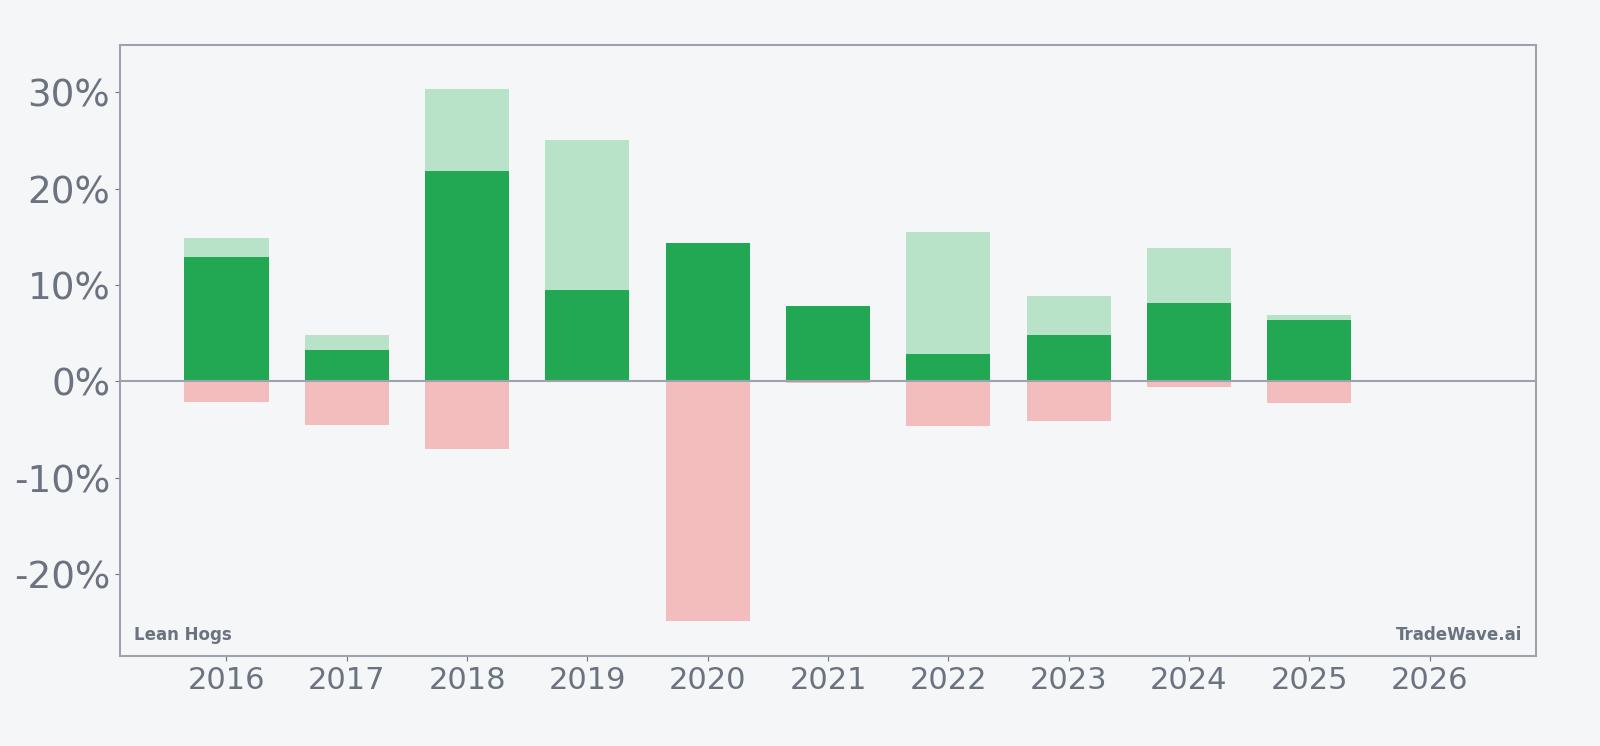
The stacked bars highlight a key feature of this pattern: upside potential has often been much larger than the final net gain, while downside excursions have varied from shallow to severe. In several years, Lean Hogs rallied more than 10% at the best point in the window, yet still gave back a chunk of that move by the close, and in 2020 the worst drawdown approached a quarter of the entry price before the contract finished strongly higher.[1] For traders, that mix of a 100% win rate and chunky MAE means the window has historically rewarded patience but punished tight risk limits.
History does not guarantee future results, and even in a decade of winning windows, adverse excursions have at times been large enough to challenge unprepared positions.
Price and near-term drivers
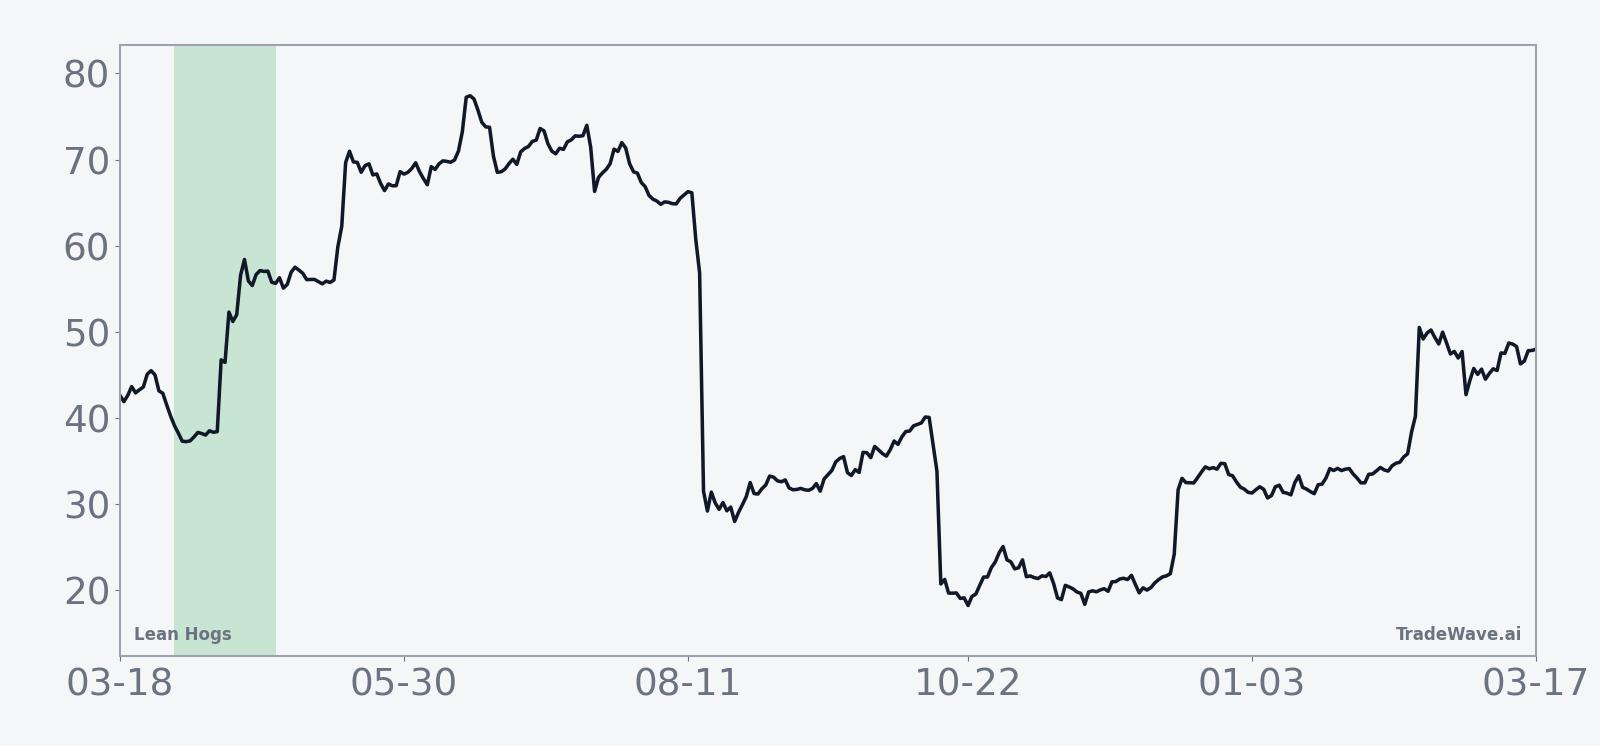
Front‑month Lean Hogs futures last settled at 90.90 cents per pound, leaving the contract well off last year’s 113.70 peak but comfortably above the 77.35 low that marked the bottom of the recent cycle.[1] Over the past month, prices have climbed 8.26%, a brisk move that has carried the market back toward its 50‑day moving average near 91.93, with average 20‑day volume running around 22,329 contracts.[1] That backdrop means the seasonal window is approaching with the tape already firming, not trying to catch a falling knife.
The chart below situates the latest rebound in its recent multi‑month context and overlays the next 60 days of seasonal projection.
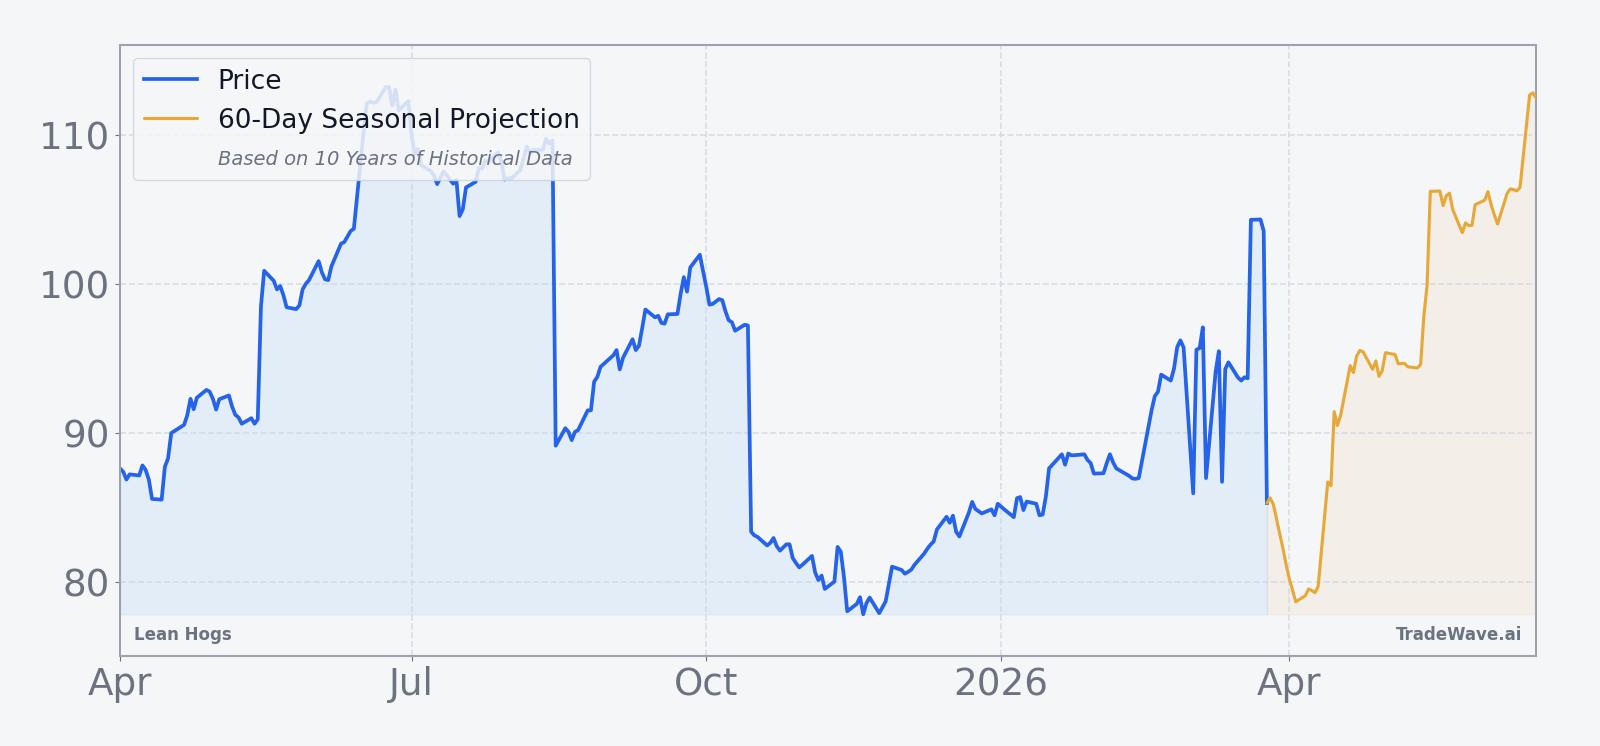
Macro drivers around hogs remain the usual mix of feed costs, consumer demand and export flows, but the seasonal pattern cuts across those shifting narratives. In some years, the window has coincided with improving demand expectations as grilling season approaches in key markets. In others, it has overlapped with supply adjustments as producers respond to prior price weakness. The common thread in the data is that, regardless of the specific story, this slice of the calendar has repeatedly seen buyers willing to step in on dips.
On the supply side, the pattern’s strongest years have often followed periods of stress earlier in the curve, when producers had already scaled back and the market was primed for any hint of tighter availability. The 2018 window, for example, saw Lean Hogs surge more than 30% at the best point in the period before settling with a 21.80% gain, a move that lined up with concerns about disease and export disruptions at the time.[1] By contrast, more muted years like 2017 and 2022 still finished positive but with smaller net gains, reflecting a backdrop where supply was less constrained.
Positioning data in the current research set is limited, but the historical pattern suggests that speculative length has tended to build into this window rather than unwind. The long‑biased Trade Direction and a TradeWave Ratio of 1.72 indicate that, on average, price has traveled meaningfully in the trade direction inside the window, even when the final close did not capture the full move.[1] For hedgers and speculators alike, that has historically translated into a period where timing entries and exits inside the 27 days has mattered as much as the decision to be long at all.
Logistics and inventory dynamics also play a role. While the current dataset does not include explicit cold‑storage or slaughter statistics, the pattern’s consistency suggests that recurring bottlenecks and demand pulses around late spring have been enough to tilt the odds. In years with larger adverse excursions, such as 2020, the combination of macro shock and supply chain disruption produced a deep intraperiod drawdown before the seasonal tailwind reasserted itself.[1] That history is a reminder that even a strong seasonal bias can be overwhelmed temporarily by unexpected shocks.
What to watch as the window opens
With the 27‑day window set to start on Apr 1, the first thing to watch is how Lean Hogs behaves on early dips. In prior years, pullbacks of 4% to 7% inside the window have been common, and in the outlier 2020 case the contract fell nearly 25% from entry before recovering to a double‑digit gain.[1] If similar weakness appears this time and buyers step in quickly, that would be consistent with the historical pattern.
Second, monitor whether the current 8.26% one‑month rally extends or stalls as the window begins.[1] A continued grind higher that respects the 50‑day moving average would fit the typical seasonal trend, which shows gains building through the middle of the period. A sharp rejection from current levels, especially if it pushes price back toward the mid‑80s, would signal that macro or supply factors are overpowering the usual spring tailwind.
Third, keep an eye on volume and intraday ranges. The historical MFE and MAE profile shows that when this window moves, it can move quickly, with large swings both up and down inside the 27 days.[1] Expanding ranges on up days would suggest speculative length is leaning into the seasonal pattern, while heavy volume on down days could hint at hedging pressure or a break from the decade‑long script.
Finally, watch upcoming supply reports and export headlines for confirmation or contradiction of the seasonal story. In years where fundamentals have lined up with the pattern, such as 2018 and 2024, the window has delivered mid‑ to high‑single‑digit gains or better with relatively contained drawdowns.[1] If fresh data instead point to oversupply or demand softness, traders should remember that even a 10‑for‑10 track record is a tendency, not a promise.