Live Cattle (LE) Has Dropped in All 10 Midterm Windows From Apr 17, Averaging 6.8% Short Wins
Live Cattle is pulling back from record territory just as a 44-day midterm-election-year window opens that has historically favored downside moves in the contract.
What is the seasonal pattern for Live Cattle (LE)?
Live Cattle has fallen in 10 of 10 midterm-election-year windows starting around Apr 17, with an average 6.8% gain for short positions in winning years.
- 10 for 10 in this window, with short trades averaging 6.8% gains across winning years.
- Seasonal window begins Apr 17 and runs for 44 trading days during the last 10 midterm election years.
- Percent Profitable is 100%, with 10 winners and 0 losers for the short-side pattern.
- Annualized return across these midterm windows is 6.75%, with a Sharpe ratio of 1.93 for end-of-window outcomes.
- TradeWave Ratio of 2.19 signals that price typically travels meaningfully in the trade direction within the window.
- Individual years have seen adverse moves against the short before working lower, so intraperiod drawdowns can still be uncomfortable.
According to historical data from TradeWave.ai, this midterm-election-year stretch in Live Cattle has behaved very differently from an average spring. The next section walks through how that pattern has played out across the last 10 comparable cycles.
How has Live Cattle (LE) traded in this midterm-year spring window?
Live Cattle has declined in every one of the last 10 midterm-election-year windows starting around Apr 17, with short positions averaging 6.8% gains over the 44-day stretch. Today the front-month contract settled at 247.6 cents per pound, down 2.0% on the session and about 1.7% below its 52-week high of 252.0, keeping prices elevated even as this historically weak window for bulls begins.
Grouping the data by the presidential election cycle matters here because this window only looks at the last 10 midterm election years, a phase that often brings policy uncertainty, shifting farm-support expectations and changing risk appetite across commodities. In that context, Live Cattle has shown a clear tendency for prices to soften in the early part of the midterm year even when the broader trend in agriculture remains firm.
The historical seasonal trend line slopes steadily lower across most of the 44-day span, with only brief pauses where prices have tended to consolidate before resuming the drift down. That profile fits a short-bias pattern where the bulk of the move often accrues gradually rather than in a single shock day.
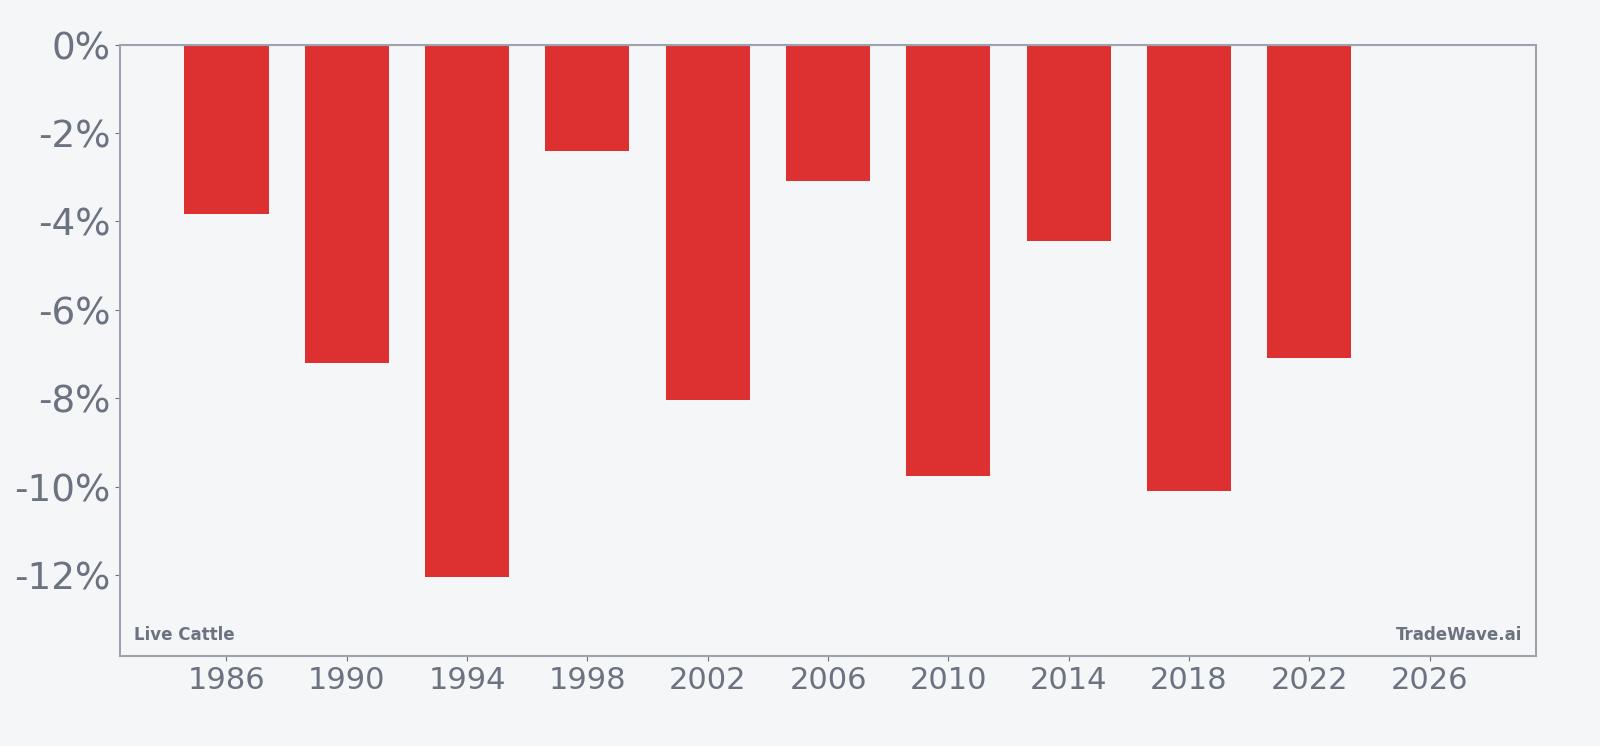
Across individual years, the per-year table shows that 1994 and 2018 were among the strongest stretches for shorts, with net returns of about 12.0% and 10.1% respectively as Live Cattle rolled over from spring levels. The softest outcome for the pattern came in 1998, when the contract only slipped around 2.4% over the window, still a win for shorts but far less dramatic than the bigger midterm-year breaks.
Yearly net and intraperiod swings highlight how far Live Cattle has tended to move in both favorable and adverse directions during this window.
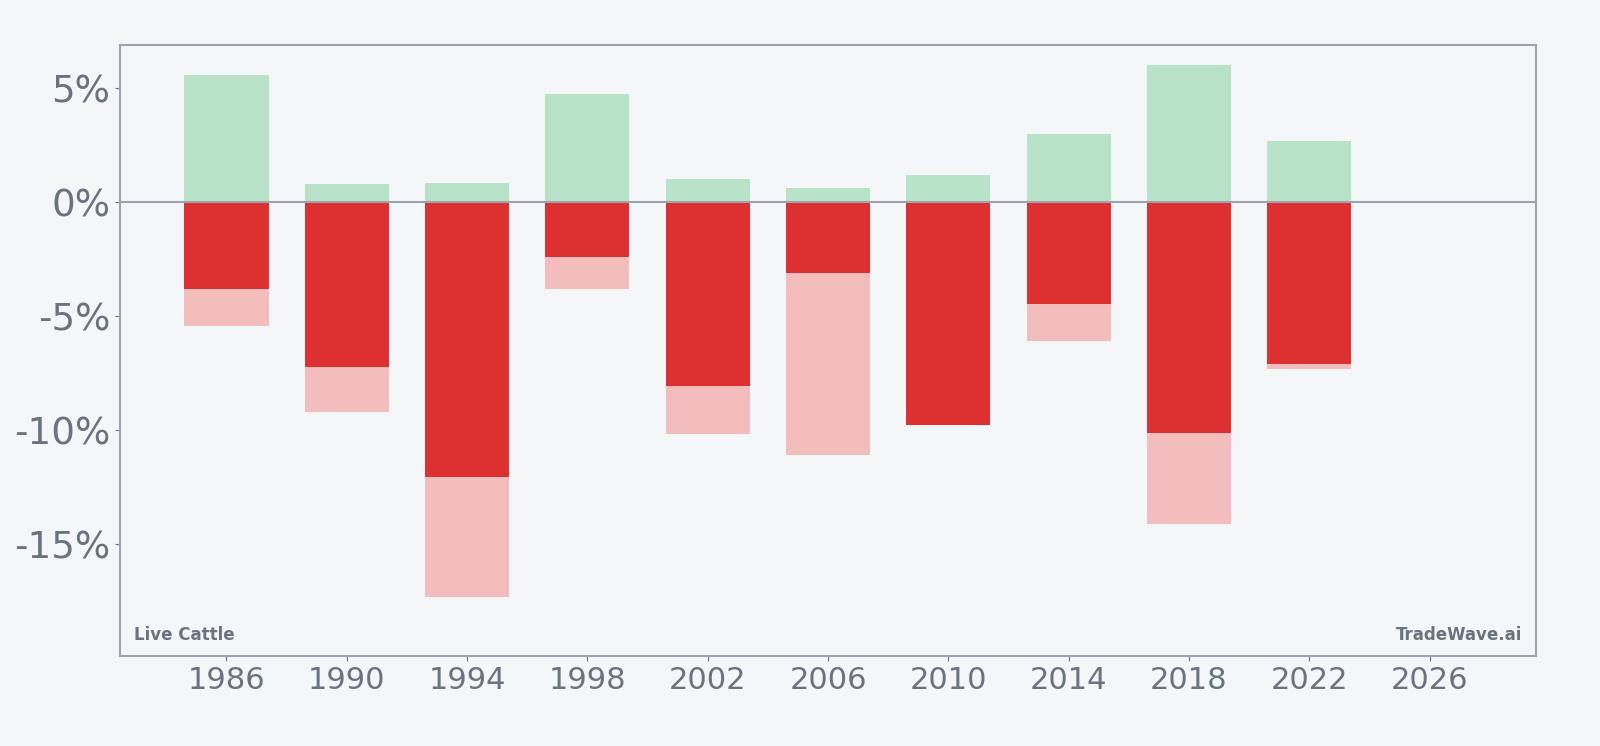
The maximum favorable move in winning years has often been sizable, with several cycles showing Live Cattle dropping more than 9% from the entry point at some stage in the window. At the same time, maximum adverse excursions have not been trivial, with years like 1994 and 2018 seeing intraperiod rallies of 5% to 6% against the short before prices ultimately finished lower, a reminder that even consistent patterns can involve sharp countertrend squeezes.
Put together, the pattern is unusually clean for a commodity: 10 winners, no losers and a steady downward seasonal bias in this specific midterm-year slice of the calendar. History does not guarantee a repeat, but the record shows that this 44-day window has repeatedly favored short exposure rather than long Live Cattle positions.
Why does Live Cattle (LE) follow this seasonal pattern?
This midterm-year spring pattern may reflect a mix of supply and policy dynamics in the cattle market. One likely driver is the transition from winter feeding to pasture, when weight gains and slaughter schedules can increase available supply just as grilling-season demand has not fully ramped, pressuring prices. Analysts have also pointed to shifting expectations around farm policy and trade in midterm years, which can nudge hedging behavior and amplify downside pressure in Live Cattle during this part of the calendar.
History does not guarantee future results; adverse excursions can still be large within the window even when the final outcome has favored the short side in prior years.
What is driving Live Cattle (LE) today?
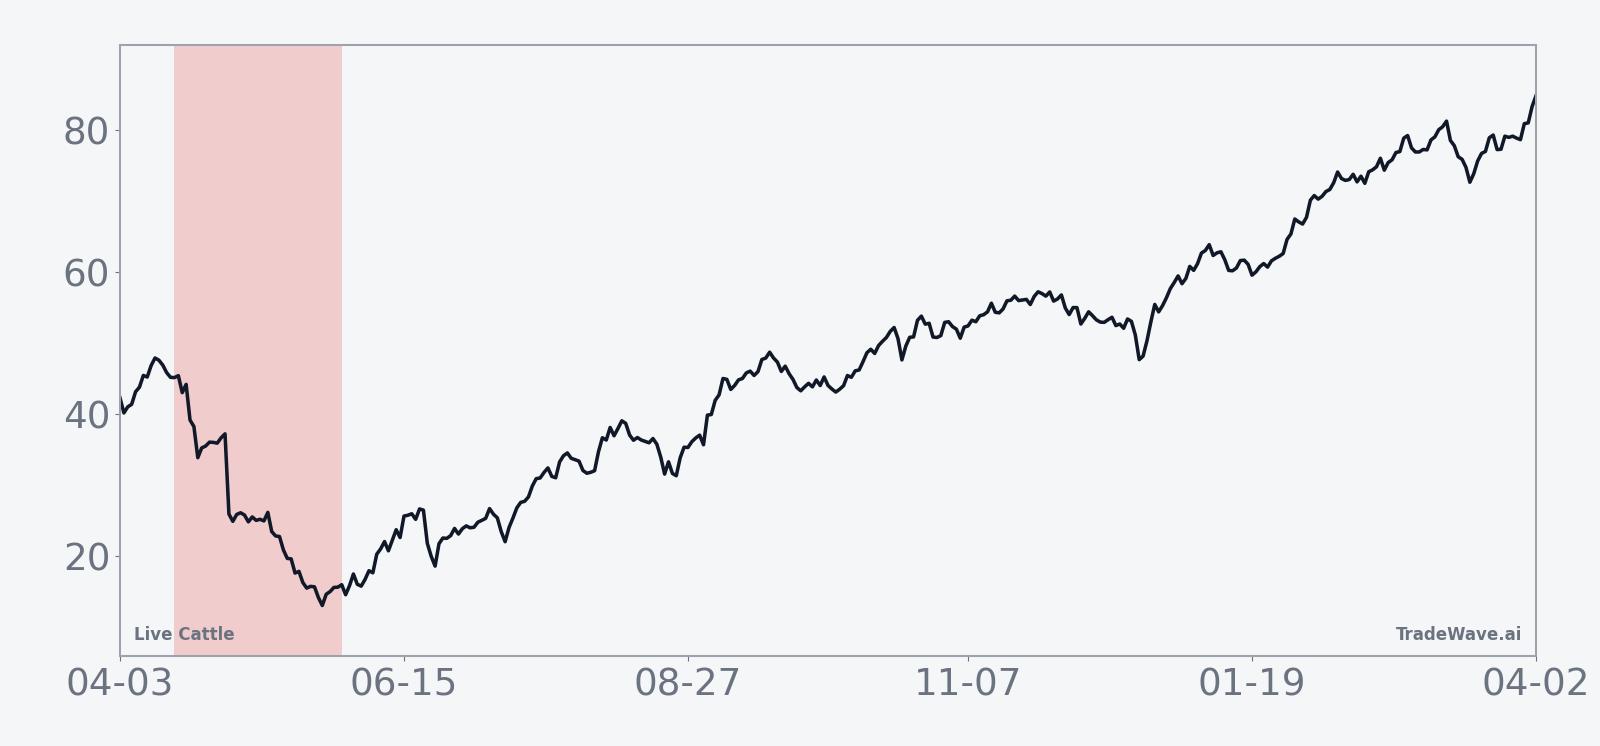
Live Cattle futures slipped 1.98% on Friday to 247.6, backing off from this week’s record area while remaining up about 18% year to date and trading near the top of the recent range around $2.48 per pound.[2] The contract is still only about 1.7% below its 52-week high, underscoring how tight supplies and strong beef demand have kept prices elevated even as some of last year’s beef price pressure has started to ease.[1]
The chart below shows how that pullback fits into the past year’s rally and the projected seasonal path for the next two months.
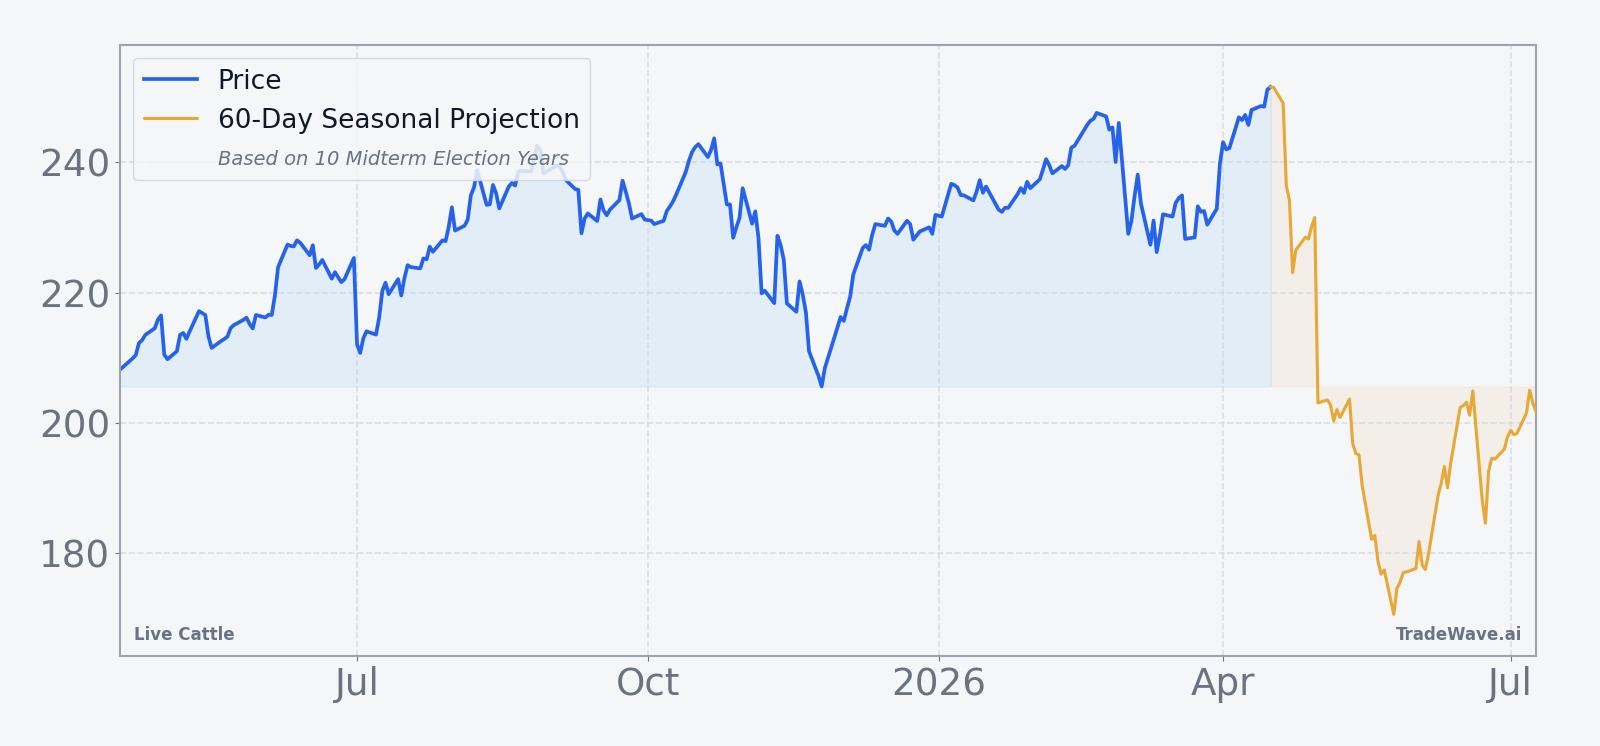
In November 2025, Live Cattle prices were already high enough to squeeze restaurant margins, with chains like Texas Roadhouse citing elevated beef costs as a key headwind.[1] By late December 2025, futures were trading around $2.29 per pound, up 18% for that year and pressing toward historical highs near $2.48, a level that has since been tested and briefly exceeded before the latest pullback.[2] Policy efforts aimed at easing beef prices, including initiatives under President Trump to encourage lower consumer costs, have so far run into the reality of weather-driven supply tightness and slow herd rebuilding, leaving Live Cattle as one of the stickier components of food inflation.[3]
For producers and packers, the current Live Cattle seasonal outlook intersects with a still-challenging margin picture. High cattle prices continue to pressure feedlots and meat processors, while restaurant operators and retailers weigh how much of the cost to pass through to consumers.[1] If this midterm-year window again brings softer cattle prices, it could offer some relief down the chain, though the historical pattern also shows that intraperiod rallies can be sharp enough to keep hedgers on edge.
What should traders watch in this Live Cattle (LE) window?
For this 44-day midterm-year stretch, the first watchpoint is whether Live Cattle can hold near the $2.40 to $2.50 band or whether prices start to roll over in line with the historical seasonal trend. A sustained break below recent support levels during the window would line up with the 10-for-10 record of lower finishes for the contract, while a firm hold or breakout above the 52-week high would mark a clear departure from the past pattern.
Macro catalysts will matter as well. Any signs of easing beef demand from restaurant traffic, grocery sales or export data could reinforce the typical midterm-year softening, especially if combined with better pasture conditions that support herd weights.[1] On the policy side, further detail on efforts to curb food inflation or adjust agricultural support programs could shift expectations for producer behavior and hedging, potentially amplifying or muting the usual seasonal pullback.[3]
Traders who track seasonality closely will also be watching intraperiod volatility. In prior cycles, some of the biggest short-side wins still involved 4% to 6% rallies against the position before prices ultimately finished lower, so whether early strength fades or accelerates will be a key tell for how closely this year tracks the historical script. Add it up: price behavior inside this window, especially around the $2.48 area and any policy or demand headlines, will show whether Live Cattle respects a decade-long midterm-year pattern or breaks it.
Sources
- [1] CNBC, “Texas Roadhouse is in a tough spot but still delivering on everything it can control,” Nov 7, 2025.
- [2] CNBC, “From farm to table, high beef prices squeeze margins,” Dec 24, 2025.
About this seasonal analysis
Seasonal pattern data is sourced from TradeWave.ai, which analyzes historical price behavior across annual calendar windows going back up to 30 years. Read the full data methodology or the book The 100-Year Pattern by Afshin Moshrefi (2026 edition). Past performance of seasonal patterns does not guarantee future results. This article is for informational purposes only and does not constitute investment advice.