6-for-6: Corn (CME) (ZC) Has Dropped in Every Midterm May Window for Shorts Averaging 5.56%
Corn (CME) futures are pushing toward their 52-week high just as a historically bearish midterm-year May window approaches, raising the stakes for grain traders.

What is the seasonal pattern for Corn (CME) (ZC)?
Corn (CME) has fallen in 6 of 6 midterm-year May windows during this 24-day stretch, with an average gain of 5.56% in winning years for short positions.
- 6 for 6 in this window, with short trades averaging 5.56% gains across the last six midterm election years.
- The upcoming 24-day Corn (CME) trading window starts on May 15 and has historically favored downside moves.
- Percent Profitable is 100%, with 6 winners and 0 losers for the short-side seasonal pattern.
- Average winner profit of 5.56% reflects consistent, medium-sized declines in prior cycles.
- Intraperiod swings have included sharp adverse moves against shorts, with worst drawdowns approaching double digits in some years.
- The pattern aligns with midterm election-year dynamics, when policy uncertainty and planting-season headlines often amplify volatility in grain futures.
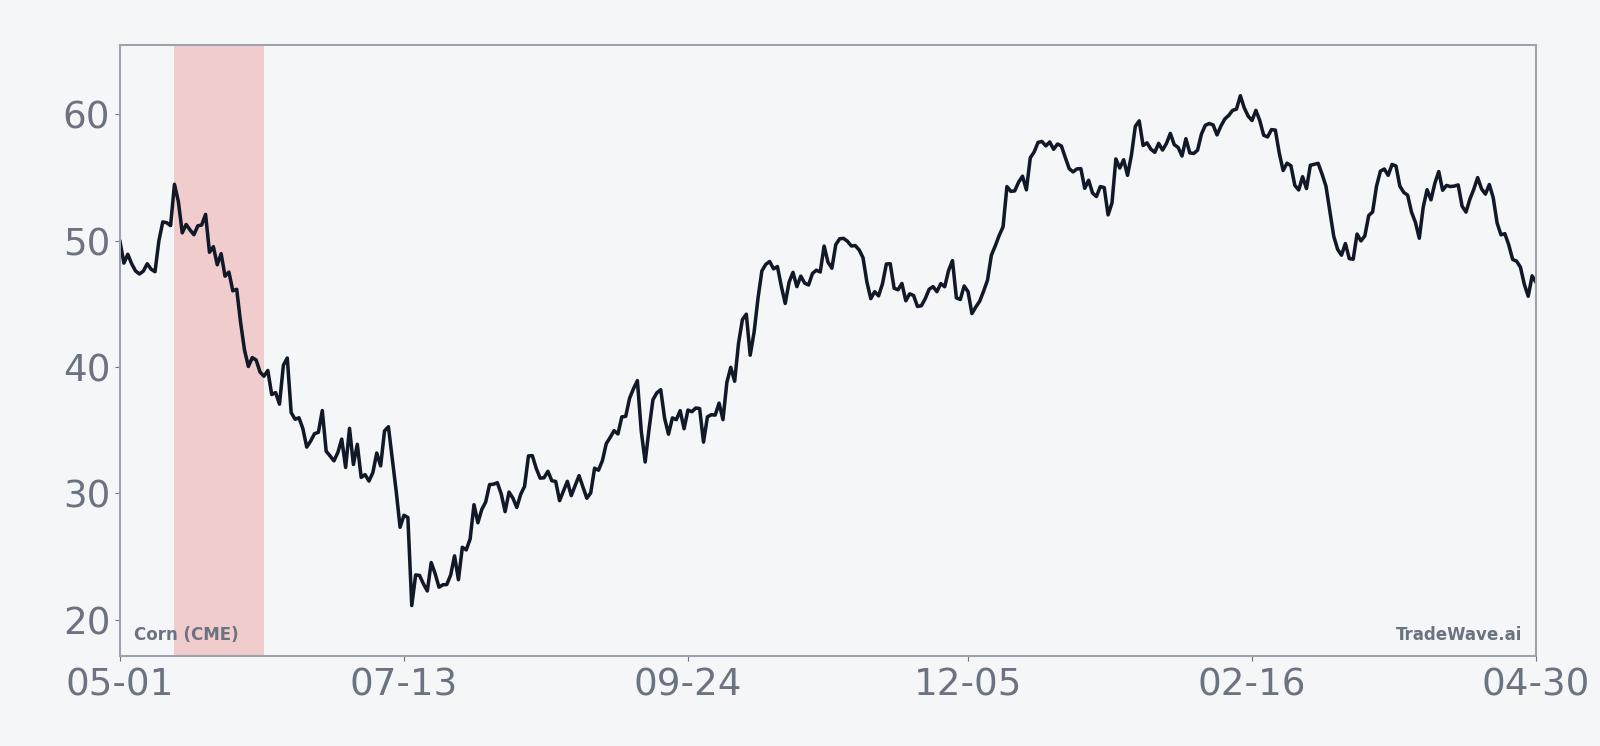
According to historical data from TradeWave.ai, this mid-May stretch in midterm election years has behaved very differently from an average month for corn futures, and the next iteration is about to begin.
How has Corn (CME) (ZC) traded in this midterm-year May window?
Corn (CME) has declined in all six midterm election years during this 24-day window starting May 15, with short positions averaging 5.56% gains. Futures settled Tuesday at 479.25 cents a bushel, up 2.57% on the day and sitting about 1.7% below the 52-week high of 487.5.
This pattern is built specifically on the last six midterm election years, a phase of the presidential cycle that often brings shifting farm policy debates, budget wrangling and uncertainty around biofuel mandates. Grouping the data this way matters because corn is tightly linked to Washington’s stance on ethanol, crop insurance and export programs, which tend to be revisited in the middle of a presidential term rather than on a simple calendar-year schedule.
The seasonal window itself begins on May 15 and runs for 24 trading days. Historically, during this period Corn (CME) has shown a clear bearish tendency, with every midterm-year sample producing a net decline by the end of the window. The trade direction for this pattern is short, meaning the historical “wins” are years when prices finished lower over the window.
Across those six midterm cycles, Percent Profitable stands at 100%, with 6 winners and 0 losers for the short-side setup. Average profit for winning years is 5.56%, which matches the all-years average because there have been no losing years in the sample. That is a rare level of consistency for a commodity contract that usually trades on weather and headlines.
The per-year breakdown shows how those declines have played out. The softest outcome was in 2006, when the window delivered a 3.46% drop from entry to exit. The sharpest was in 2014, when corn fell 6.87% over the same stretch, followed closely by 2018 and 2022 with net returns of about minus 6.5% for shorts. Add it up and the cumulative return across the six windows is 38% for the short side.
Intraperiod swings have not been one-way traffic. The historical best and worst excursions within the window, known as maximum favorable move and maximum adverse move, show that shorts have often had to sit through sizable rallies before the pattern paid off. In 2022, for example, the worst drawdown from entry for shorts reached nearly 11% even though the window still finished with a 6.49% gain for the trade.
That mix of strong end-of-window results and choppy paths is captured in two key metrics. The Sharpe ratio, a measure of risk-adjusted average return based on end-of-window outcomes, sits at 3.92, which is unusually high for a commodity pattern. The TradeWave Ratio, defined as how far price typically travels in the trade direction within the window regardless of the final close, is 3.25, underscoring that when this window moves, it tends to move decisively.
Trend statistics back up the idea that the downside pressure builds steadily rather than in a single air pocket. The long-vs-short trend counts show 70 “trend long” days in the direction of the trade and zero “trend short” days against it across the sample, with a similar skew in the shorter-term trend measures. In plain English, prior midterm-year windows have tended to grind lower for shorts rather than whip violently back and forth.
A second view combines yearly net results with the best and worst intraperiod swings to show how far prices have typically traveled in both directions.
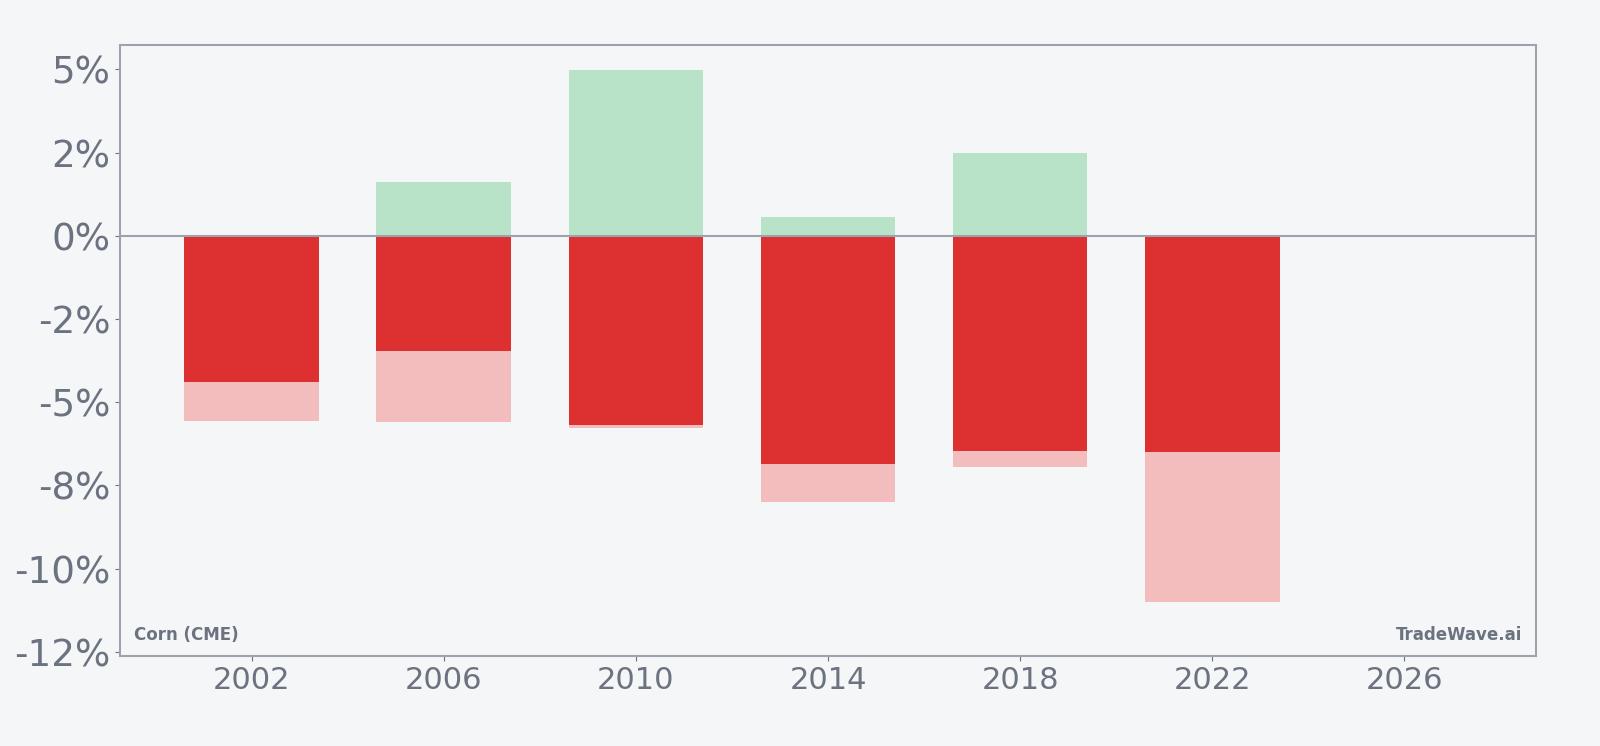
The stacked net, best-case and worst-case bars show a consistent pattern: shorts have ultimately finished ahead in every year, but the maximum adverse move has often been large enough to test conviction. In several cycles, the contract rallied a few percent before rolling over, which matters for anyone trying to time entries inside the window rather than at the start.
History does not guarantee future results, and adverse excursions within the window can be large even when the final outcome has favored the seasonal pattern.
Why does Corn (CME) (ZC) follow this seasonal pattern?
One likely driver is commodity supply and demand seasonality around U.S. planting and early crop-condition reports, which cluster in late spring and can trigger repricing of weather and yield risk. Analysts have also pointed to midterm election-year policy debates on farm support and ethanol mandates, which can shift expectations for demand just as acreage and emergence data firm up. The combination of fresh supply information and shifting policy signals may explain why this specific mid-May window has repeatedly leaned bearish for corn prices in midterm years.
What is driving Corn (CME) (ZC) today?
Corn (CME) futures closed at 479.25 on May 12, up 12 cents or 2.57% on the session, and are trading in the upper end of their recent range with the contract about 1.7% below its 52-week high of 487.5. The move extends a roughly 8.07% one-month gain, helped by signs of a broader agriculture commodity recovery and expectations of a mean-reversion rally after heavy selling earlier in the year.[1]
Fundamentally, the backdrop is still heavy. The USDA projects U.S. corn ending stocks at 2.23 billion bushels, up from prior estimates, and earlier revisions to harvested acreage and yields pushed down prices and forced farmers to rethink 2026 planting plans.[1] Analysts project 2026 corn plantings at 94.9 million acres, with steady export sales, suggesting ample supply even if weather turns less favorable.[1] At the same time, improved U.S. weather forecasts and a retreat in oil prices into late April eased concerns about planting delays and biofuel-driven demand, contributing to the earlier slide in Chicago grain futures.[1]
Sector-wide, U.S. farmers still see big corn acreage as the best path to break even despite pressure from prices and exports, which keeps a floor under supply even when margins are thin.[1] That leaves futures trading in a tug-of-war between comfortable inventories and the prospect of a cyclical bounce if weather or policy headlines tighten the outlook into summer.
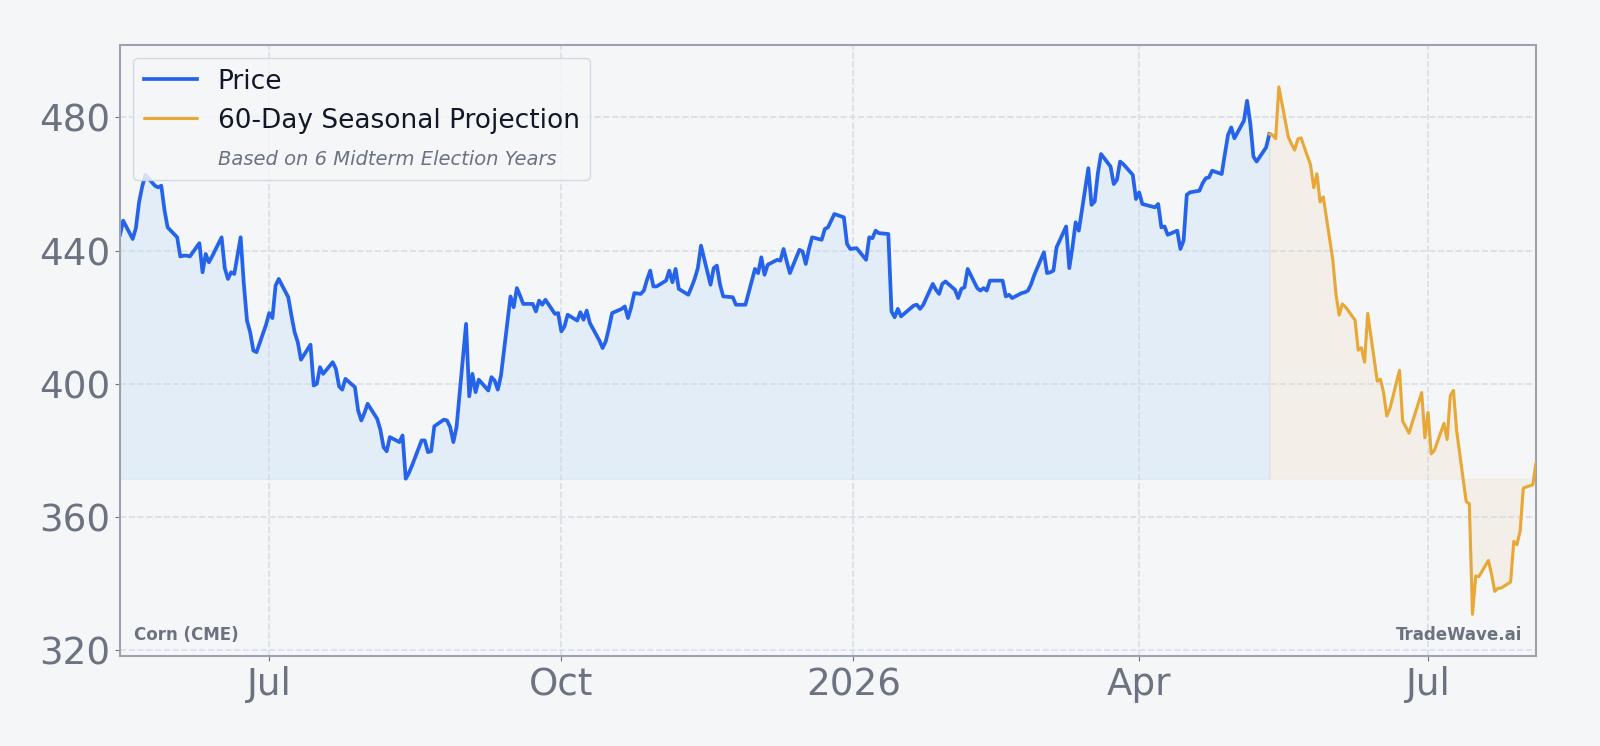
The chart below shows how the latest rebound fits into the past year’s trading range and overlays a 60-day seasonal projection.
What should traders watch in this seasonal window?
First, the calendar: the 24-day window starting May 15 has historically been a clean bearish stretch for Corn (CME) in midterm election years, so how price behaves in the first week will be an early tell. A quick rejection from the 480 to 490 band would rhyme with prior cycles, while a sustained breakout above the 52-week high would mark a clear departure from the historical ZC seasonal trend.
Second, watch the usual spring catalysts. Weekly crop-progress and planting reports, any shift in U.S. weather toward prolonged dryness or excessive rain, and updates to USDA supply and demand estimates can all change the tone of this Corn (CME) trading window. With inventories projected higher and acreage still robust, it would likely take either a meaningful weather scare or a policy surprise on ethanol or exports to overwhelm the established seasonal pattern.[1]
Finally, monitor volatility inside the window, not just the closing levels. Past midterm-year samples show that even winning short trades have endured sizable rallies before rolling over, so intraday and intraweek spikes will matter for risk management. If this year’s window delivers smaller adverse swings than history, it would suggest a calmer backdrop than prior midterm cycles; if MAE-style drawdowns reappear, it would confirm that this slice of the calendar remains a high-stakes period for corn futures.
Sources
About this seasonal analysis
Seasonal pattern data is sourced from TradeWave.ai, which analyzes historical price behavior across annual calendar windows going back up to 30 years. Read the full data methodology or the book The 100-Year Pattern by Afshin Moshrefi (2026 edition). Past performance of seasonal patterns does not guarantee future results. This article is for informational purposes only and does not constitute investment advice.