Corn (CME) (ZC) Faces USDA Supply Shock as Higher Stocks Deepen Mid-May Downside Risk
Corn (CME) futures sit just above a fresh 52-week high as they head toward a mid-May window that has consistently rewarded short positions in past midterm election years.
What is the seasonal pattern for Corn (CME) (ZC)?
Corn (CME) has fallen in 6 of 6 midterm-election-year May–June windows during this pattern, with an average gain of 5.56% for short positions in winning years.
- 6 for 6 in this window, with short trades averaging 5.56% gains across the winning years.
- The seasonal window starts on May 15 and runs for 24 trading days in midterm election years.
- Percent Profitable is 100%, with 6 winners and 0 losers for the short-side pattern.
- Average winner profit of 5.56% comes with relatively tight dispersion, reflected in a 1.36% standard deviation.
- The TradeWave Ratio of 3.25 signals that price has typically traveled meaningfully in the short direction within the window.
- A Sharpe ratio of 3.92 points to unusually consistent risk-adjusted returns for this specific Corn (CME) trading window.
According to historical data from TradeWave.ai, this mid-May stretch in midterm election years has behaved very differently from an average month on the corn calendar, and the next iteration is just days away.
How has Corn (CME) (ZC) traded in this mid-May seasonal window?
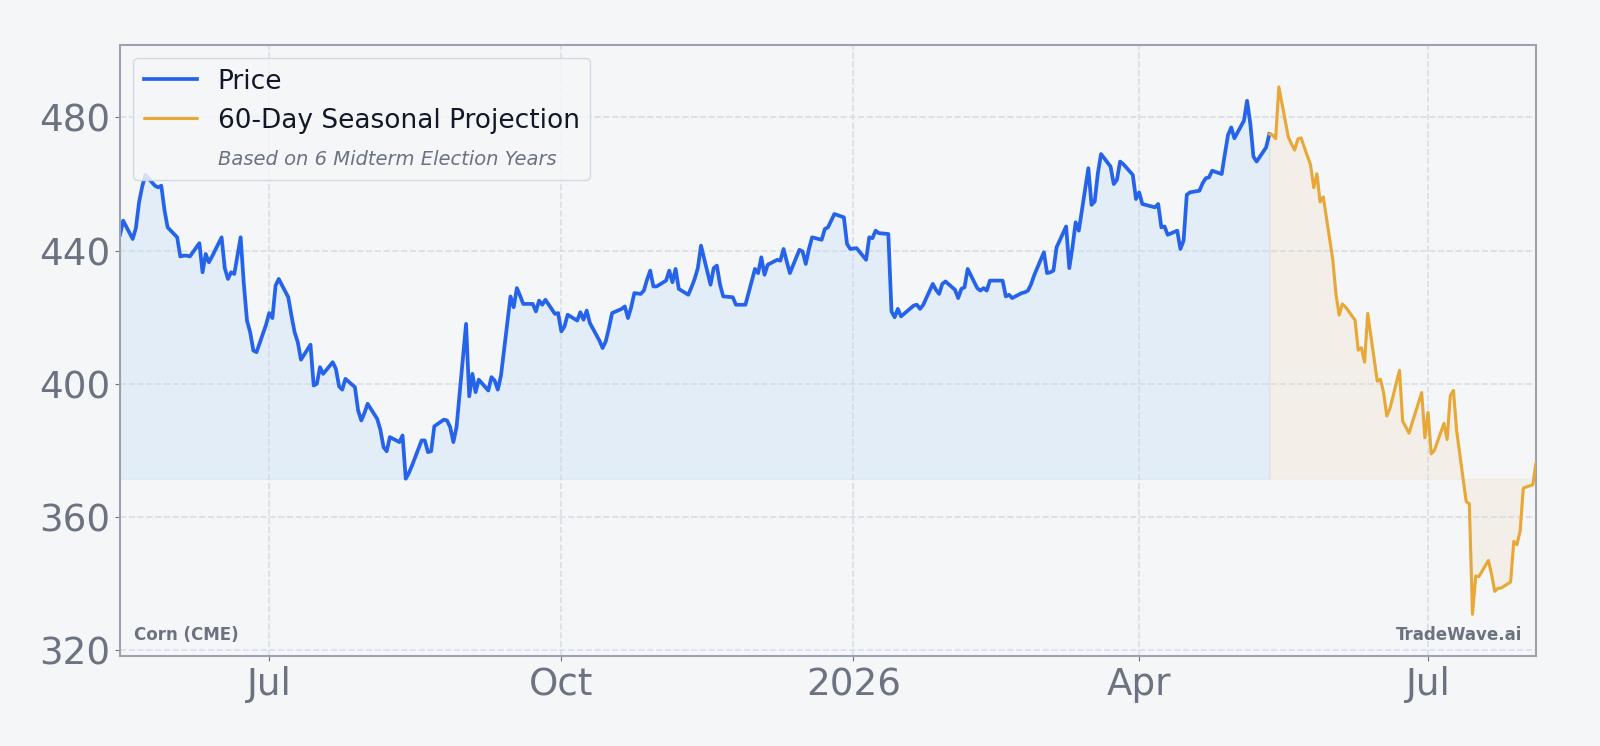
Corn (CME) has delivered profitable short-side trades in all 6 midterm-election-year windows starting around May 15, with an average move of 5.56% in favor of the shorts over 24 trading days. Futures settled Monday at 478.75 cents per bushel, up 2.24% on the day and about 1.1% above their 52-week high of 473.75, leaving the contract stretched as this historically weak window approaches.
Because this pattern is grouped by the presidential election cycle, it only looks at the last six midterm election years rather than every calendar year. That focuses the analysis on periods when policy uncertainty, farm-bill debates and shifting subsidy expectations have tended to reshape grain-market positioning in similar ways.
Across the six midterm-year samples, every window ended with corn lower than it started, which is favorable for a short pattern. The weakest year for prices in this slice was 2014, when the contract fell 6.87% from 484.25 to 451.00, while the smallest decline was 3.46% in 2006 as prices slipped from 260.00 to 251.00. Even in the milder years, the short side still finished ahead.
The intraperiod swings have been meaningful. In 2022, for example, corn dropped 6.49% from 809.50 to 757.00 during the window, but the worst drawdown against the short position reached 10.99% at one point before the market rolled over again. That maximum adverse excursion shows how rallies inside the window can be sharp even when the final outcome favors the shorts.
On the favorable side, some years saw only modest bounces before the downtrend reasserted itself. In 2002, the best move against the short was just 0.12% before prices slid 4.39% lower by the end of the window. Other years, such as 2010, saw a 4.99% intraperiod rally against the short before the contract ultimately finished 5.69% lower, underscoring that both sides of the tape can be active.
The historical seasonal average shows the bulk of the downside accruing in the middle of the 24-day stretch, with a tendency for prices to stabilize or even bounce slightly toward the end. That profile suggests that, in prior midterm years, the heaviest selling pressure has often arrived after the window is already underway rather than on day one.
Year-by-year bars with maximum favorable and adverse moves highlight how consistently the window has leaned lower, even with sizable countertrend rallies.
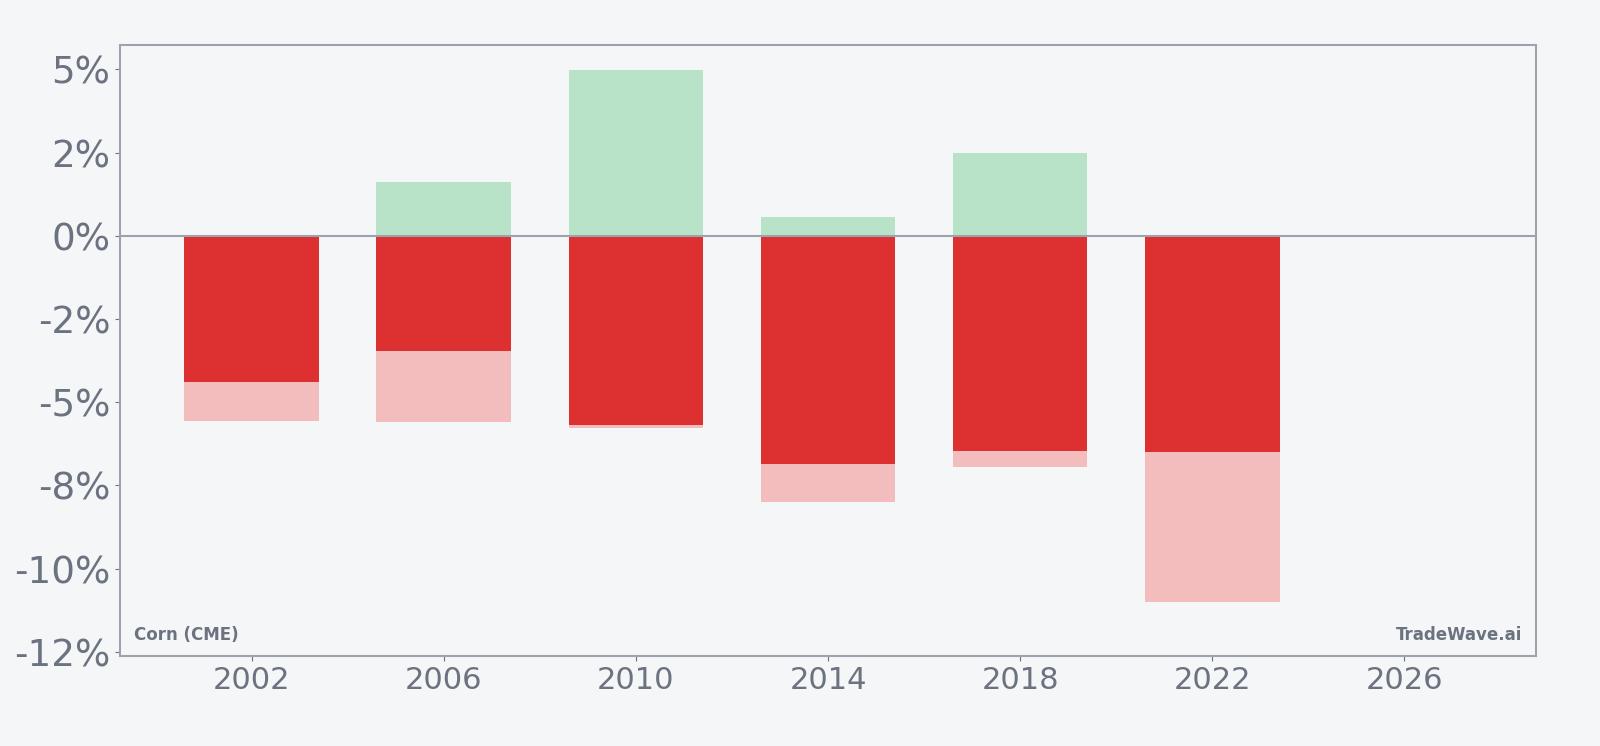
The stacked bars show a tight cluster of net declines between roughly 3% and 7%, while the maximum adverse excursions often run deeper than the final net move. That combination of steady short-side wins and sizable intraperiod rallies is what drives the high TradeWave Ratio and Sharpe ratio for this Corn (CME) seasonal trend.
History does not guarantee future results, and the worst intraperiod drawdowns in this window have been large enough to challenge even correctly positioned trades.
Why does Corn (CME) (ZC) follow this seasonal pattern?
This mid-May window sits squarely in the U.S. planting season, when weather forecasts, acreage updates and early crop-condition reports can quickly shift expectations for supply. One likely driver is that improved planting progress and better weather in midterm election years have often eased supply fears, encouraging producers and funds to sell into strength. The pattern may also reflect hedging flows tied to biofuel demand and export programs that tend to be recalibrated as the growing season firms up.
What is driving Corn (CME) (ZC) today?
Corn (CME) futures climbed 2.24% Monday to 478.75, trading in a 477.25 to 481.50 range and pushing just above the prior 52-week high of 473.75 on relatively light volume of 16,934 contracts versus a 20-day average of 177,709.6. The move comes after a late-April pullback in Chicago grain futures tied to retreating oil prices and improved U.S. Corn Belt weather, which had eased concerns about planting delays and biofuel-linked demand support.[1]
Higher ending stocks and stronger yield estimates from the U.S. Department of Agriculture earlier this year added to the sense of ample supply, even as export demand remains robust compared with historical norms.[1] In July 2025, USDA commentary pointed to record U.S. corn exports for the 2024–25 marketing year, with trade flows shifting away from China and toward other buyers, a structural change that still shapes how traders think about global demand today.[2]
Commodity funds have been net sellers of corn during the recent consolidation, according to positioning data, reflecting a shift away from grains as weather risks eased and energy prices softened. At the same time, USDA inventory estimates show higher ending stocks, reinforcing the idea that supply is comfortable heading into the heart of the growing season.[1] That backdrop leaves Corn (CME) entering this historically weak mid-May window from a position of relative price strength rather than stress.
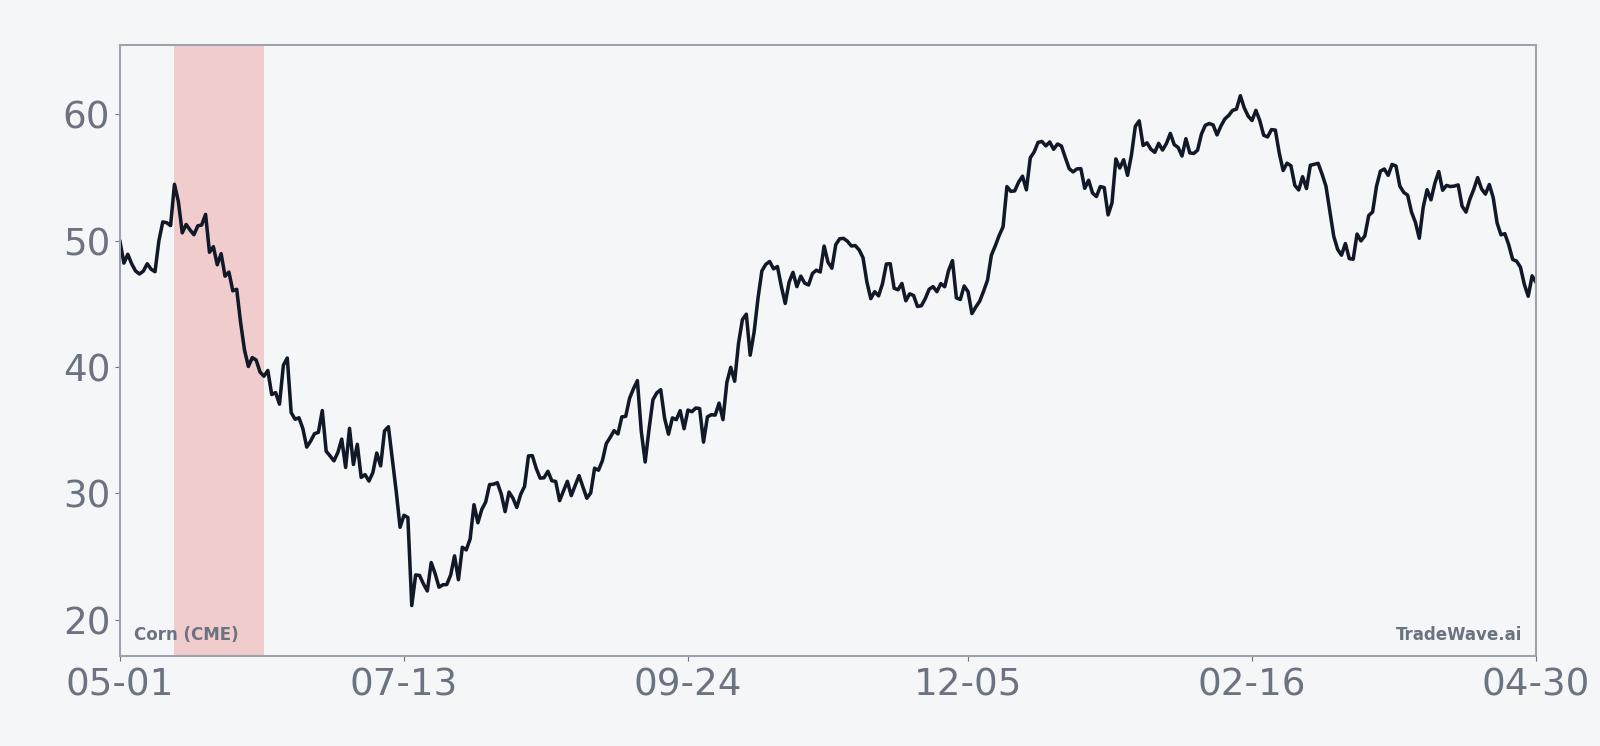
The chart below places the latest bounce in the context of the past year and overlays a 60-day seasonal projection.
What should traders watch as this Corn (CME) window opens?
For this cycle, the key test is whether corn can hold above the recent 52-week high as the May 15 window begins. Historically, the pattern has seen prices roll over within the first week or two of the 24-day stretch, with the heaviest downside often clustering in the middle of the window. A sustained break below the 450 to 460 area during the period would be more in line with the past midterm-year behavior, while a squeeze that keeps futures pinned near or above 480 would mark a clear departure from the historical seasonality.
Fund flows and positioning will matter as much as weather headlines. If commodity funds continue to pare exposure or add to short hedges into late May, that would echo the selling pressure seen in prior midterm election years. On the other hand, a renewed bid tied to energy prices or export surprises could blunt the typical pattern and keep intraperiod rallies larger than usual.
Macro traders will also be watching how this Corn (CME) seasonal trend interacts with the broader agriculture and biofuel complex. Softer oil prices and comfortable inventories have already taken some heat out of grain markets.[1] If those forces persist while the historical mid-May window opens, the combination of fundamental and seasonal pressure could amplify volatility across related futures and agribusiness equities.
Bottom line: the last six midterm election years have all delivered profitable short-side outcomes in this specific Corn (CME) trading window, but the path has rarely been smooth. Traders watching this season should focus on how quickly any early-May strength fades, how deep intraperiod rallies run before sellers reassert control, and whether price action respects or rejects the well-defined historical pattern.
Sources
About this seasonal analysis
Seasonal pattern data is sourced from TradeWave.ai, which analyzes historical price behavior across annual calendar windows going back up to 30 years. Read the full data methodology or the book The 100-Year Pattern by Afshin Moshrefi (2026 edition). Past performance of seasonal patterns does not guarantee future results. This article is for informational purposes only and does not constitute investment advice.