Corn (CME) (ZC) Faces USDA Supply Shock as 2.23B-Bushel Stocks Signal More Downside
Corn futures are trading near a 52-week high just weeks before a 24-day midterm-year window that has historically rewarded short positions with consistent downside moves.

What is the seasonal pattern for Corn (CME) (ZC)?
Corn (CME) has fallen in 6 of 6 midterm-election-year windows starting May 15, with an average gain of 5.56% for short positions in winning years.
- 6 for 6 in this window, with short trades averaging 5.56% gains across winning years.
- The 24-day Corn (CME) trading window begins May 15 and is grouped across the last 6 midterm election years.
- Percent Profitable is 100%, with 6 winners and 0 losers for the short-side seasonal pattern.
- Median profit for the pattern is 6.08%, pointing to a fairly tight cluster of outcomes around mid-single-digit returns.
- The TradeWave Ratio of 3.25 signals that price has typically traveled meaningfully in the short direction within the window.
- A Sharpe ratio of 3.92 indicates unusually strong risk-adjusted performance for this specific seasonal short setup.
According to historical data from TradeWave.ai, this mid-May window in Corn (CME) behaves very differently from an average month on the calendar, especially in midterm election years.
How has Corn (CME) (ZC) traded in the upcoming May 15 midterm-year window?
Corn (CME) has declined in all six midterm-election-year windows starting May 15, with short positions averaging 5.56% gains over the 24-day stretch. Futures are trading at 467.0 cents per bushel, up 2.6% on the day and sitting about 1.4% below the 52-week high of 473.75, which makes the setup especially interesting for traders watching this historical seasonality.
Grouping the data by the presidential election cycle matters here because this window only looks at the last six midterm election years, a phase that often brings shifting farm policy debates, budget wrangling and volatility in risk assets. Corn sits at the intersection of food inflation, biofuel policy and export competitiveness, so a recurring pattern in this specific political year can reflect how traders repeatedly position around those macro themes.
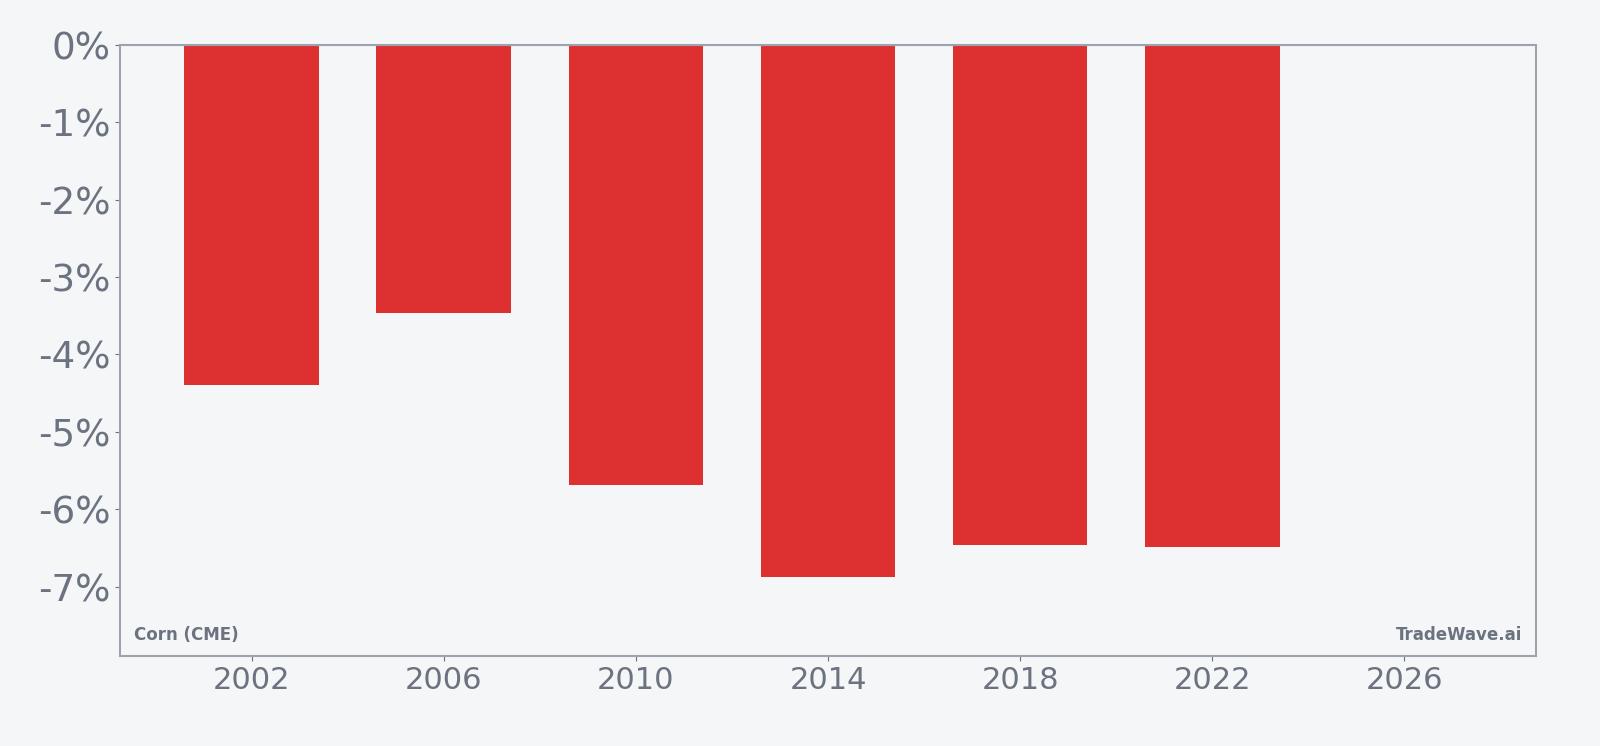
The trade direction for this pattern is explicitly short. In each of the six midterm-year samples, corn futures finished the 24-day window lower, with net returns ranging from a 3.46% drop in 2006 to a 6.87% decline in 2014. For a short seller, those are all winning years, and the 6.08% median profit suggests the ZC seasonal trend has not been driven by a single outlier but by a fairly consistent cluster of mid-single-digit moves.
Average profit of 5.56% across all years means that even after accounting for the smaller moves, the typical outcome for a short position has been meaningful. The cumulative return across the six midterm cycles is 38%, and the annualized return of 5.55% reflects how this relatively short window has stacked up over time when repeated every four years. A Sharpe ratio of 3.92 is unusually high for a commodity pattern, indicating that the historical risk-adjusted profile of this Corn (CME) trading window has been strong for shorts.
The per-year table shows that 2022 delivered one of the sharper moves, with a 6.49% net decline for corn over the window and a worst intraperiod drawdown of 10.99% from the entry price. In 2010, the contract fell 5.69% over the window, but at one point rallied almost 5% against the short before rolling over, a reminder that even “clean” seasonal patterns can involve uncomfortable squeezes along the way.
The historical seasonal average trend line slopes steadily lower across the 24 days, with much of the move typically accruing in the middle of the window rather than in a single sharp break. That suggests a pattern of pressure building as planting progress, weather updates and positioning flows converge, rather than a one-day shock.
A stacked view of yearly net returns alongside best and worst intraperiod moves shows how far corn has tended to travel in both directions during this window.
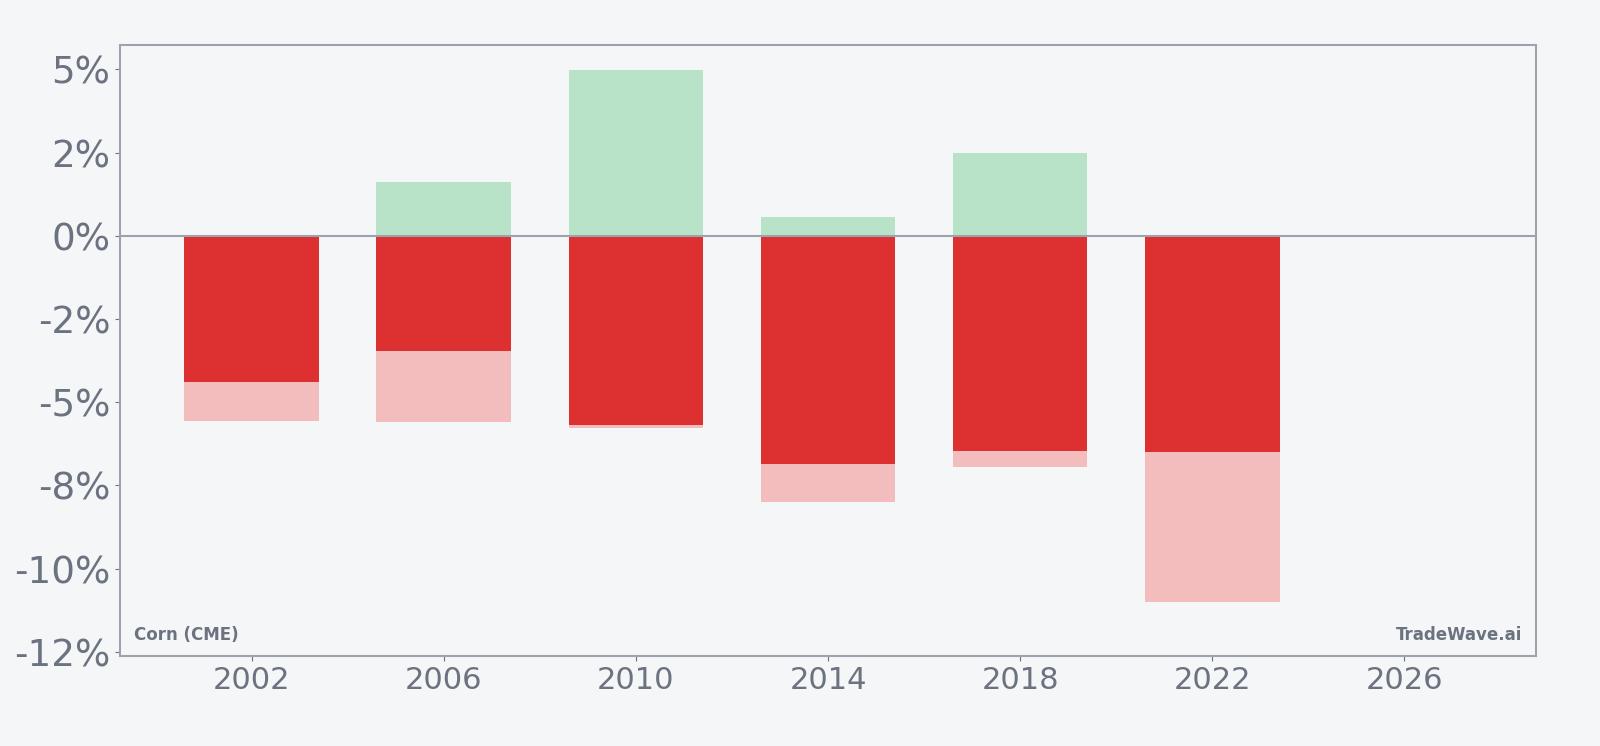
The bars with maximum favorable excursion show that in several years, shorts saw additional unrealized gains beyond the final close, while the maximum adverse excursion bars highlight that intraperiod rallies of 5% or more against the short have not been unusual. Add it up: this has been a window where the short side has ultimately won every time in the sample, but the path has often involved sizable swings both ways.
History does not guarantee future results, and the worst intraperiod drawdowns (MAE) in this window have been large enough that even winning years would have tested risk limits for poorly sized positions.
Why does Corn (CME) (ZC) follow this seasonal pattern?
This pattern may reflect commodity supply and demand seasonality around U.S. planting, when acreage decisions, early weather and USDA updates collide with speculative positioning. Analysts have pointed to midterm election years as periods when farm policy, biofuel mandates and budget debates can add another layer of uncertainty, encouraging hedgers and funds to lean into downside protection. The combination of fresh crop expectations and shifting policy headlines may be why this specific mid-May window has repeatedly favored short exposure in Corn (CME).
What is driving Corn (CME) (ZC) today?
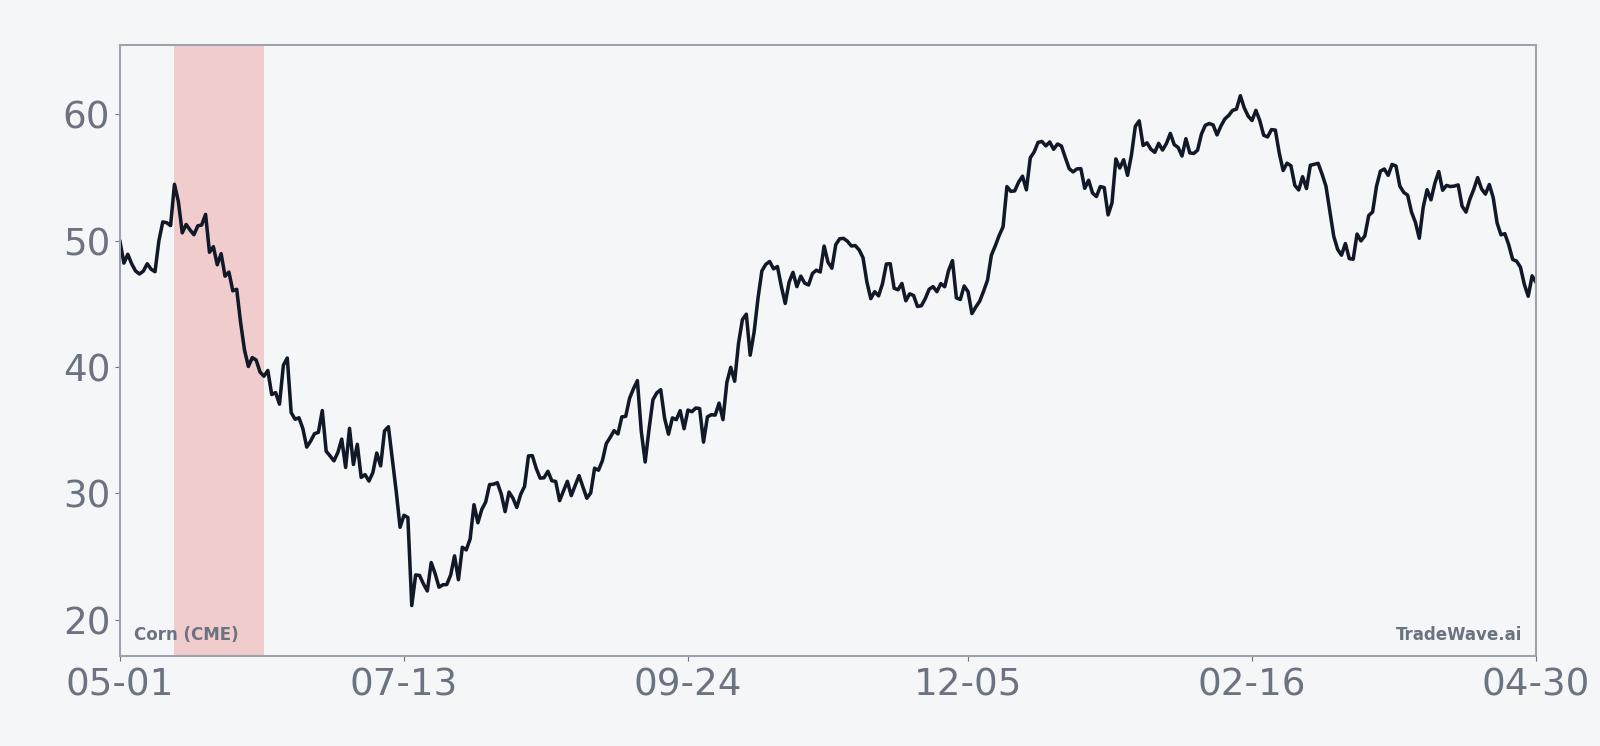
Corn futures settled at 467.0, up 12 cents or 2.6% on the session, with volume of 21,250 contracts against a 20-day average of 177,709.6. That leaves the contract about 1.4% below its 52-week high of 473.75 and well above the 52-week low of 368.75, while price also sits comfortably above the 50-day moving average of 447.52, underscoring a market that has firmed after earlier pressure from heavy supply projections.
USDA’s January outlook projected U.S. corn ending stocks at 2.23 billion bushels, an ample cushion that has weighed on grain markets since the start of the year, even as speculators remained heavily bearish but stopped adding to short bets.[1] In July 2025, USDA commentary around record U.S. corn exports and strong biofuel demand showed how quickly sentiment can flip when demand surprises to the upside, even in the face of big crops.[1] For now, the backdrop is one of comfortable inventories, cautious speculative positioning and a contract that has quietly climbed back toward the top of its one-year range.
The chart below situates the latest move against the past year of trading and a 60-day seasonal projection.
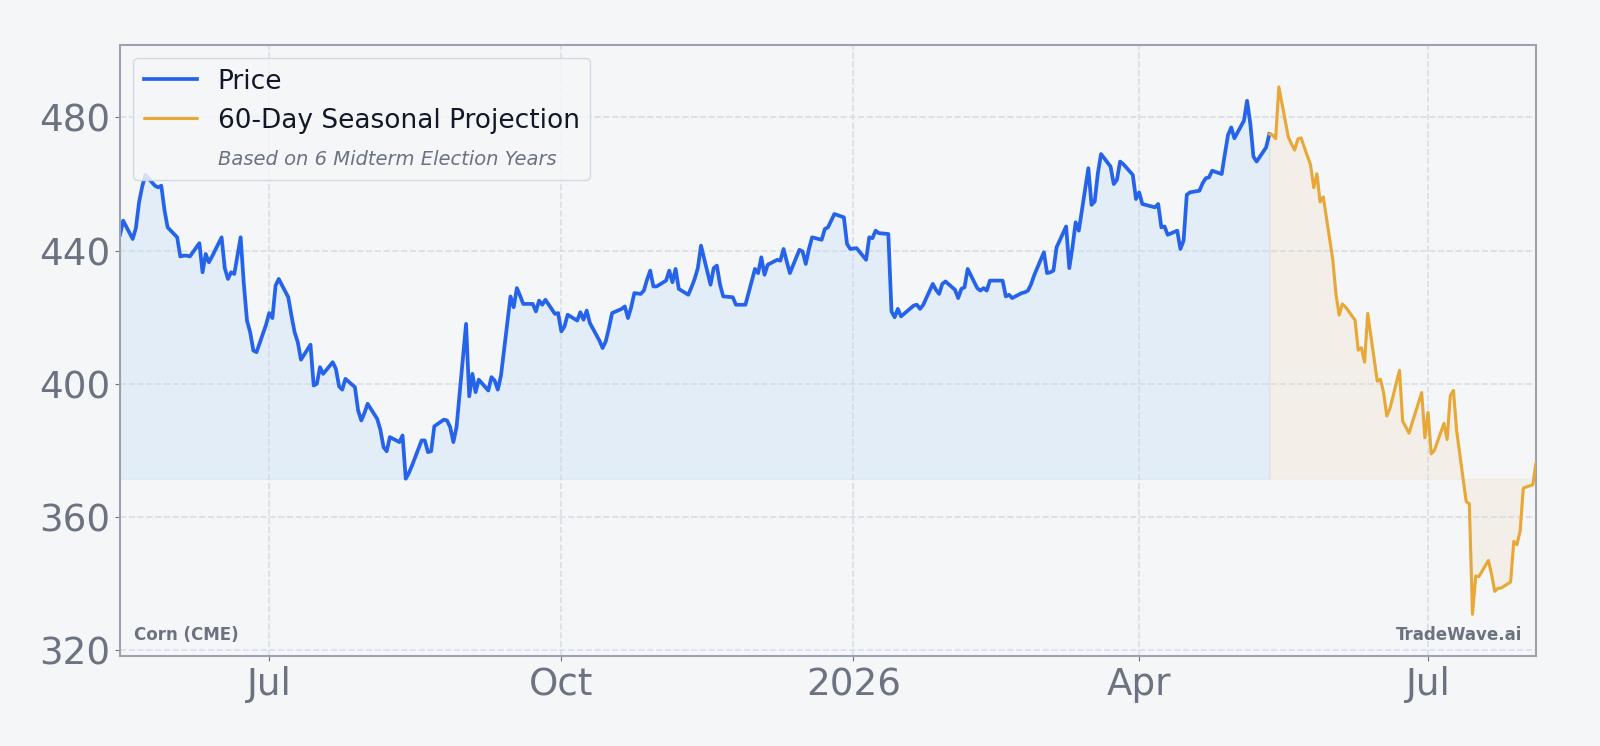
For traders, the tension is clear. On one side is a market that has bounced from last year’s lows and is flirting with fresh highs despite comfortable stocks. On the other is a mid-May seasonal window that, in midterm election years, has consistently rewarded short exposure. Corn is a systemically important commodity for food inflation, feed costs and biofuel margins, so any volatility around this window can ripple into related equities and broader inflation expectations.
What should traders watch as the May 15 window approaches?
First, the calendar. The 24-day window begins on May 15, so positioning in the first half of May will show whether funds lean into the historical pattern or fade it. If corn continues to trade near or above the 50-day moving average into the start of the window, the contrast between a strong tape and a historically bearish seasonal stretch will be even sharper.
Second, watch USDA updates and early-season weather. Any shift in projected ending stocks away from the current 2.23 billion bushels, or signs that planting is either delayed or ahead of schedule, can quickly change the tone in grain markets.[1] A surprise tightening in the balance sheet could blunt the historical downside tendency, while confirmation of comfortable supplies would align with the past pattern of midterm-year weakness.
Third, monitor speculative positioning and intraday volatility once the window opens. The historical MFE and MAE profile shows that even in winning short years, corn has often staged sharp rallies before rolling over. If early days of the window feature squeezes that fail near the 52-week high or stall just above the 50-day moving average, that would rhyme with prior cycles. A clean breakout to sustained new highs, by contrast, would be a clear break from the historical script.
Finally, keep an eye on related macro assets. Corn is a key input for livestock feed and a major feedstock for U.S. ethanol, so big moves in ZC can influence food inflation narratives and biofuel-linked equities.[1] If the upcoming seasonal window again delivers meaningful downside, it could ease some pressure on food prices and margins. If it does not, traders will have learned that this particular midterm-year pattern has finally met its match.
Sources
About this seasonal analysis
Seasonal pattern data is sourced from TradeWave.ai, which analyzes historical price behavior across annual calendar windows going back up to 30 years. Read the full data methodology or the book The 100-Year Pattern by Afshin Moshrefi (2026 edition). Past performance of seasonal patterns does not guarantee future results. This article is for informational purposes only and does not constitute investment advice.