Corn (CME) (ZC) Has Dropped in 6 of 6 Midterm May Windows, Shorts Averaged 5.56% Gains
Corn (CME) futures are trading near the upper end of their 12‑month range just as a midterm‑year seasonal window that has produced six straight declines from May 15 begins to play out.
What is the seasonal pattern for Corn (CME) (ZC)?
Corn (CME) has fallen in 6 of 6 midterm‑year windows starting May 15 and lasting 24 trading days, with an average gain of 5.56% in winning years for short positions.
- 6 for 6 in this window, with short trades averaging 5.56% gains in winning years across the last six midterm election cycles.
- Seasonal window runs from May 15 for 24 trading days, targeting a historically weak early‑summer stretch for Corn (CME).
- Percent Profitable is 100%, with 6 winners and 0 losers for the short trade direction in this ZC seasonal trend.
- Average winner delivers a 5.56% move in favor of shorts, while the median outcome is a 6.08% decline in futures prices over the window.
- Intraperiod swings have been meaningful, with past years showing sizable peak run‑ups and drawdowns before settling lower by the end of the Corn (CME) trading window.
- Sharpe ratio of 3.92 and a TradeWave Ratio of 3.25 point to a historically efficient risk‑adjusted pattern for this specific midterm‑year slice.
According to historical data from TradeWave.ai, this midterm‑year window in Corn (CME) behaves very differently from an average month on the calendar, and the next few weeks sit squarely inside that pattern.
How has Corn (CME) (ZC) traded in this midterm‑year May window?
Corn (CME) has declined in all six midterm election years during the 24‑day window that starts on May 15, with short positions averaging 5.56% gains as futures drift lower. The current contract settled Monday at 467.25 cents per bushel, up 2.5% on the day and sitting about 4.2% below its 52‑week high of 487.50, leaving prices elevated relative to the past year as this historically weak stretch unfolds.
Grouping the data by the presidential election cycle matters here because this pattern only shows up in midterm years, not across the full history of ZC. Midterm years often bring shifting policy expectations around farm support, biofuel mandates and trade, which can change how weather and USDA headlines translate into price moves for grains.
This seasonal window is already underway in 2026, running from May 15 through roughly mid‑June. The trade direction in the historical pattern is short, meaning the “winning” years are the ones where corn futures finished the window lower than they started. Across the last six midterm election years in this slice, every single iteration has been a winner for that short bias, producing a 100% Percent Profitable record with 6 winners and 0 losers.
The average profit of 5.56% reflects the mean gain for those short trades, while the median profit of 6.08% shows that half the years delivered at least that much downside. Because there were no losing years in this sample, the all‑years average lines up closely with the average winner, and there is no separate drag from big upside squeezes against the short.
Intraperiod behavior has not been gentle. In the weakest year for corn prices in this window, 2014, the contract fell 6.87% from entry to exit, with the worst drawdown from the short entry reaching about 8.0% before the move stabilized. In 2022, the pattern still finished as a winner for shorts with a 6.49% decline, but the worst adverse excursion from entry was nearly 11%, showing that even successful years have featured sharp counter‑trend rallies before rolling over.
The best‑case runs have also been notable. In 2010, for example, corn dropped 5.69% over the window, but at one point the move in favor of shorts reached almost 5% from entry before some of that gain was given back. That mix of sizable peak favorable moves and meaningful adverse swings is what the TradeWave Ratio of 3.25 is capturing: TradeWave Ratio (TWR) reflects how far price typically travels in the trade direction within the window regardless of the final close.
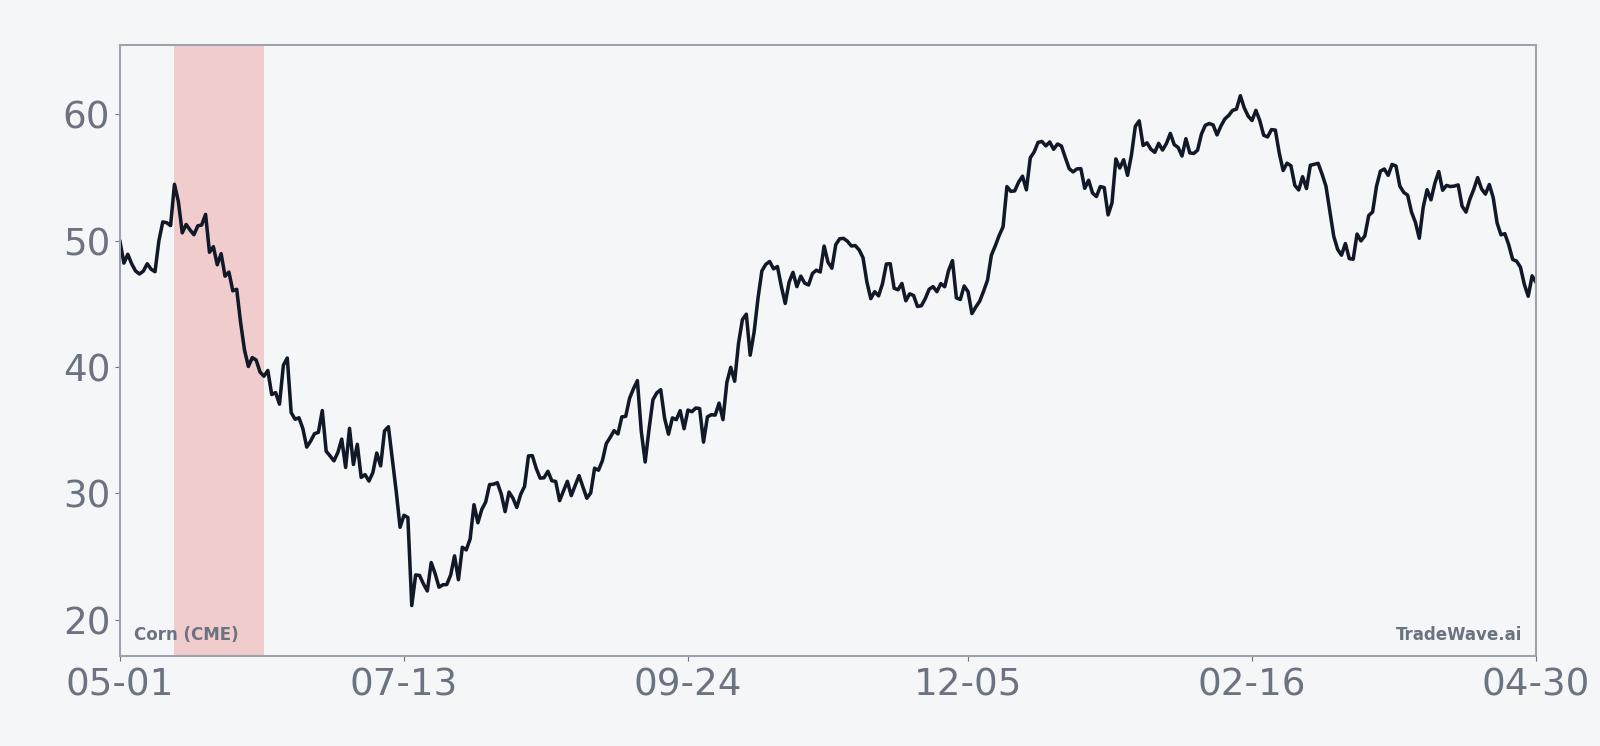
The historical seasonal trend chart for this window shows a fairly steady downward bias rather than a single crash day. On average, prices tend to soften early in the window, see a brief pause or bounce around the middle, then resume grinding lower into the final week. That shape suggests the pressure has usually been a process, not a one‑day shock tied to a single USDA report.
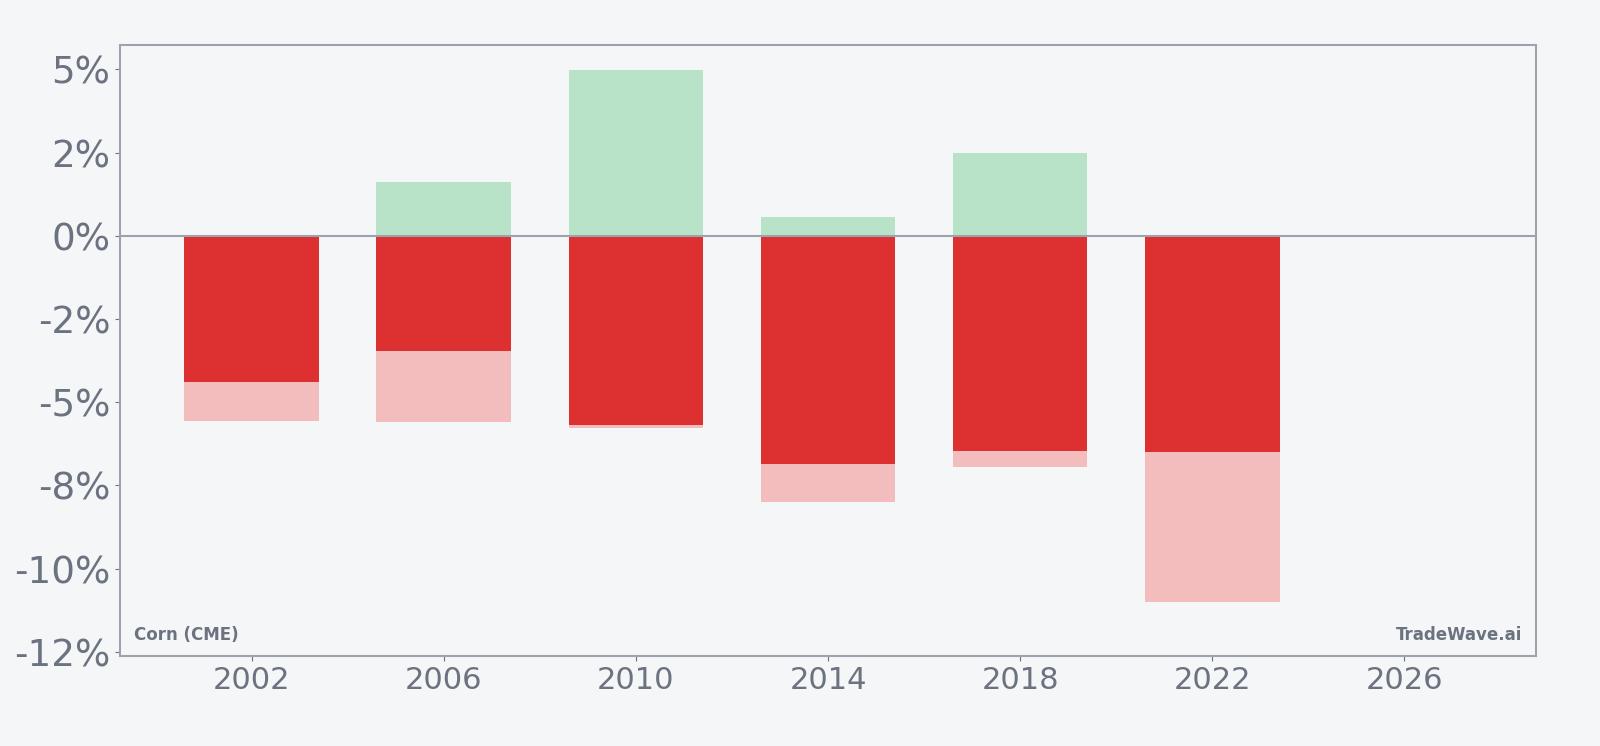
When you stack the yearly net returns against the best and worst intraperiod moves, the picture is of a high‑conviction but bumpy path. Maximum favorable excursions have often been larger than the final net decline, which means traders who timed exits well could have captured more than the average 5.56% move, while maximum adverse excursions remind that even a “perfect” 6‑for‑6 pattern has demanded real risk tolerance.
Add it up: six midterm election years, six profitable short windows, and an average mid‑single‑digit decline in corn futures over less than a month. History does not guarantee a repeat, but the consistency of this specific May‑to‑June stretch is hard to ignore.
Why does Corn (CME) (ZC) follow this seasonal pattern?
This pattern may reflect classic commodity supply and demand seasonality as U.S. planting nears completion and early crop conditions become clearer. Analysts have pointed to midterm‑year policy noise around farm programs and biofuel mandates as an extra layer that can weigh on prices when weather looks cooperative. The combination of improving supply visibility and less urgent policy support can leave corn vulnerable to downside repricing in this early‑summer window.
A second view combines yearly net results with the best and worst intraperiod swings to show how far prices have tended to travel inside the window.
What is driving Corn (CME) (ZC) today?
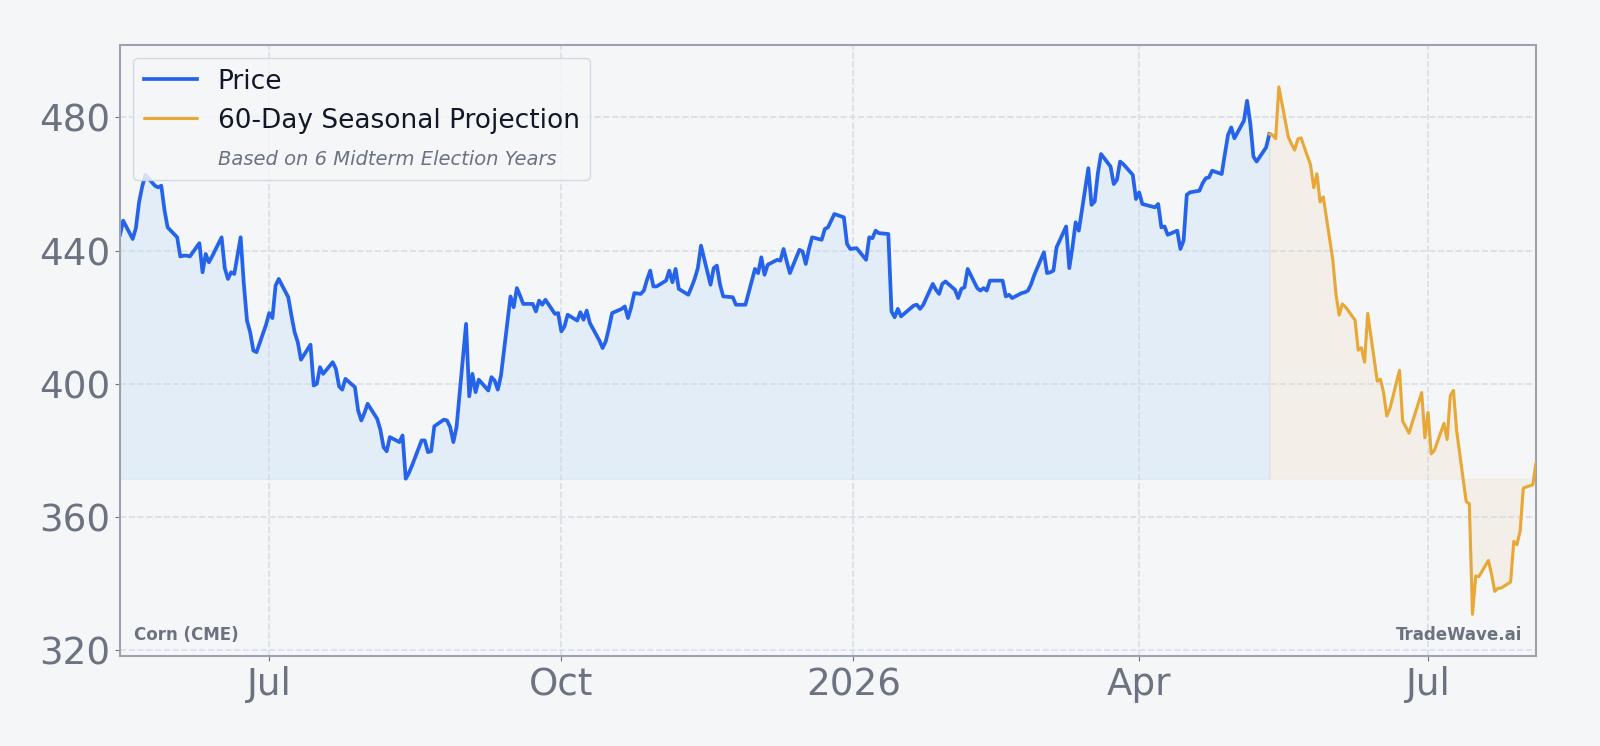
Corn futures climbed 2.5% Monday to 467.25, extending a roughly 8.07% one‑month rebound and leaving the contract within about 4.2% of its 52‑week high at 487.50. The move comes after a stretch of pressure tied to higher projected U.S. ending stocks and improved weather, which had weighed on grains earlier in the year as the USDA lifted corn ending stocks to 2.23 billion bushels in January and traders reacted to better planting conditions and softer energy prices in late April.[1]
The chart below situates the latest bounce against the past year of trading and a 60‑day seasonal projection.
Beyond domestic supply, the broader grain sector backdrop has been shaped by strong export demand and the biofuel story. In July 2025, U.S. corn exports for the 2024‑25 marketing year were on track for record volumes even with minimal participation from China, underscoring how global feed and fuel demand can absorb larger U.S. crops when logistics and policy align.[1]
Speculators remain heavily bearish on grains, though less so than a year earlier, according to positioning data cited alongside those export trends.[1] That backdrop means rallies like Monday’s can be amplified if short covering kicks in, especially when prices approach prior highs and seasonal patterns point in the opposite direction. For traders watching the ZC seasonal trend, the tension between a strong short‑side historical window and a market that has been grinding higher into late spring is the key dynamic to monitor.
What should traders watch in this Corn (CME) seasonal window?
First, watch how corn behaves around the 480 to 490 band that marks the upper end of the past year’s range. A sustained break above the 52‑week high near 487.50 during a window that has historically favored downside would signal that this midterm‑year pattern is being challenged, likely driven by a shift in weather, policy expectations or demand.
Second, track the cadence of USDA updates and weekly export sales. Softer supply estimates, weather scares or renewed biofuel optimism could blunt the usual early‑summer pressure, while confirmation of comfortable stocks and steady exports would be more consistent with the historical tendency for prices to ease as planting wraps up.[1]
Third, keep an eye on intraday volatility and how far prices swing inside the window. Past years have seen sizable peak favorable and adverse excursions before settling lower, so whether this cycle delivers similar two‑way swings will say a lot about how closely 2026 is tracking the historical script. If corn sells off in stages with sharp counter‑trend rallies that fade, it would rhyme with prior midterm‑year behavior; a smooth grind higher would be a clear break from the pattern.
Finally, monitor speculative positioning and whether bearish bets on grains rebuild or continue to normalize. In July 2025, heavy but easing speculative shorts coexisted with strong export demand, a mix that can fuel both squeezes and air pockets in price when sentiment shifts.[1] How that positioning evolves through mid‑June will help determine whether this 6‑for‑6 seasonal window remains a useful guidepost or becomes the year that breaks the streak.
Sources
About this seasonal analysis
Seasonal pattern data is sourced from TradeWave.ai, which analyzes historical price behavior across annual calendar windows going back up to 30 years. Read the full data methodology or the book The 100-Year Pattern by Afshin Moshrefi (2026 edition). Past performance of seasonal patterns does not guarantee future results. This article is for informational purposes only and does not constitute investment advice.